The list of the higher numbers of occupations of adult persons in the conurbation of Manchester in 1851 (Census), is given in the annexed file “Manchester Supplement Occupations 1851”.
From this we see that adult employment in the cotton industry is only 28 % (adult males) and 33 % (adult females) of the total. These are the “workers” in the “Engels” sense, who are employed in large companies, and thus are at a disadvantage against the business owners. The cotton operatives normally had three family members in the mills, and therefore had 30 to 40 shillings total income, in comparison with the often quoted 11 shillings per average person in the mills.
The other groups of occupations are in a free price system, their wage was sufficient to leave a little margin with respect to their food, clothing and rent costs. In some cases, they had also to cover their raw materials costs: meat for butchers, wood for carpenters, leather for shoemakers, etc. The domestic servants were usually paid a small amount in cash, and had bed and food free.
The professional persons, when they proffered an opinion about the workers in general, said that they could be divided in two groups, the “wasters” and the “disciplined” [expressions of this author]. The “wasters” although they earned good wages, they spent everything they had they could on drink, often at the cost of not being to pay for food, rent, and clothing. The “disciplined” did not spend money that they did not have, did deposit moneys in the Government Saving Banks, did spend a little on beer, and went to classes in the Mechanics’ Institutes and the Hall of Industry.
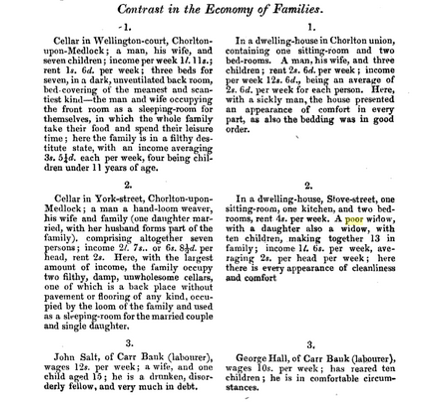
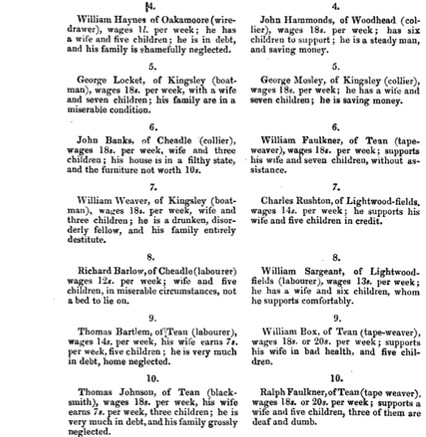
The following comparison is taken from the “Local Report” to the Poor Law Commissioners. It does explain why the better classes had a low opinion of the working classes. 1.02
1.02 Poor Law Commissioners, Local Reports on the Sanitary Condition of the Population, 17. Lancashire, Cheshire, Derbyshire and Staffordshire, 1842, pp. 238-239.
The Irish were about 15 % of the population. A large number of them were from the poorest parts of Ireland (the West Coast), and often they did not speak English when they arrived in England. Generally, they were not liked. They worked in informal jobs. Some imported pigs from Ireland that they could slaughter in their backyards, and then sell the pigmeat.
The first organism to exercise control over the whole town of Manchester, was that of the Police Commissioners, according to the Manchester and Salford Police Act of 1792. These had responsibility for the night-watch, road building, street cleaning, street lighting, and the maintenance of fire engines.
With the Reform Act of June 1832, Manchester had 2 Members of Parliament.
1837 Division of the Conurbation into 3 Registration Districts (Manchester, Salford, Chorlton) for births, deaths, marriages.
The Municipal Borough 1838 included Manchester, Chorlton, Hulme, but not Salford.
Manchester from 1800 to 1837, consisted basically of the Township, which was divided into 14 Police Districts. From 1837, with the introduction of the requirement that births, deaths and marriages should be informed in the Register Offices, the enlarged conurbation was divided into three Registration Districts. These were: Chorlton, Salford, and Manchester. The figure of 350,000 from Engels corresponds to the 341,000 of the 1841 Census for the total of the three Registration Districts.
Different administrative regions of the Manchester area, with populations:
RD
AreaAcres
1801
1811
1821
1831
1841
1851
Manchester Township
1,500
70,000
79,000
108,000
142,000
163,000
187,000
Manchester Parish
33,500
112,000
136,000
187,000
271,000
353,000
452,000
471
Chorlton
11,600
9,000
14,000
23,000
30,000
78,000
122,000
472
Salford
4,800
19,000
25,000
34,000
52,000
70,000
88,000
473
Manchester
12,700
81,000
91,000
125,000
165,000
193,000
227,000
Conurbation
29,100
109,000
130,000
182,000
247,000
341,000
437,000
Census of Great Britain 1851, Population Tables I, Vol. II, England and Wales, Divisions VII – IX, Number of the Inhabitants, Division VIII, North-Western Division, p. 8 and pp. 40-42
“RD” = Registration District defined in 1837, with the introduction of the General Register Office.
The centre of the RD Manchester was in 1820 the commercial centre of the town, and also where the business owners lived (*). From 1820 to 1840 the rich moved out to villas in the countryside areas, and the less rich to the suburbs (i. e. Chorlton). These persons converted their town houses to warehouses (a number of which were architecturally impressive). We can see that there was an effect in the population figures: while the Police Districts outside the centre increased in population by 30 % from 1821 to 1831, the four Police Districts of the centre had zero increase in population
The areas included in the RD Chorlton (Ardwick and Chorlton-upon-Medlock) had decent housing and drainage.
Also, a number of the better-paid workers who had been living in the Manchester Township, emigrated to the suburbs. But since the population of the Township in total increased from 1821 to 1831, it must have been the case, that there was an immigration into the Township, greater than the movement from there to the suburbs.
But it is not true that all of the commercial centre was taken up by warehouses and workers’ housing. In 1841-1851 there were a number of entertainment venues, hotels, and business buildings. We shall see this in detail, near the end of this document.
(*) According to Dr. Kay, these were the “central districts, containing the principal streets, the most respectable shops, the dwellings of the more wealthy inhabitants, and the warehouses of the merchants and manufacturers.” 1.01
These were the Police Districts 5 (St. Paul’s), 6 (Exchange), 8 (St. James), 9 (St. Ann’s).
1.01Kay, Dr. J. P., “The Moral and Physical Conditions of the Working Classes employed in the Cotton Manufacture in Manchester”,1832, p. 17.
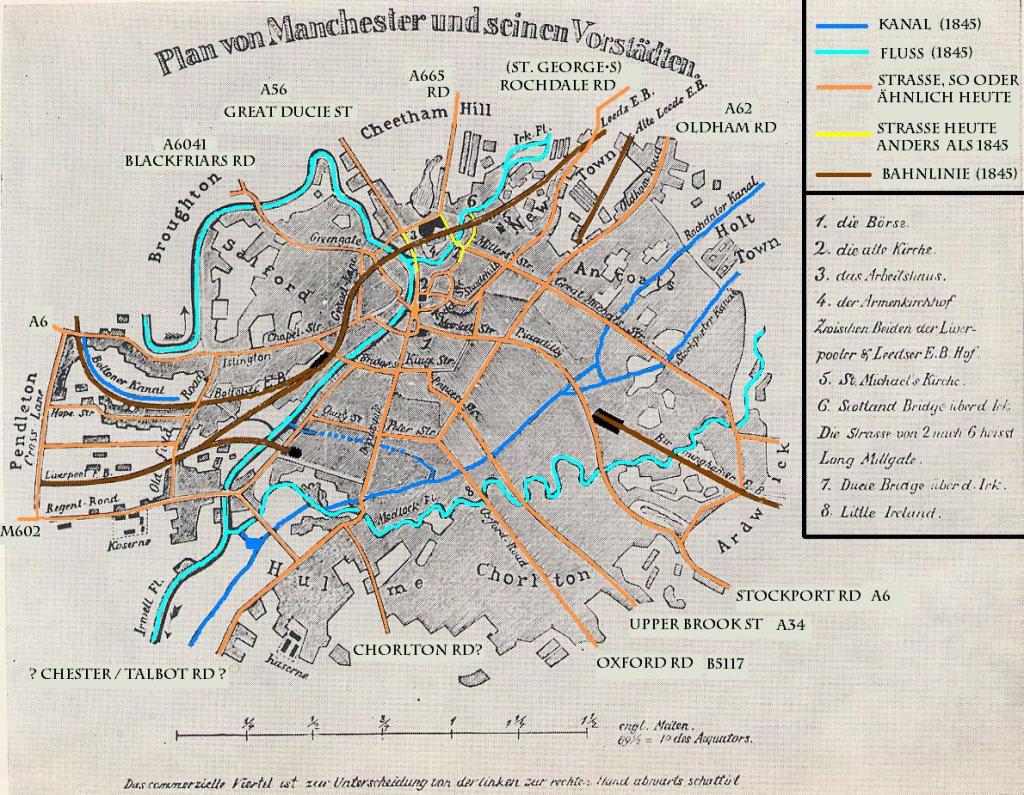
Map of Manchester, 1845
Engels, “Die Lage der arbeitenden Klasse in England”, 1845, End Insert.
The improvements in health care, in town services, and in charitable activities, introduced in Manchester up to our period, were as follows:
1752 Royal Infirmary
1762 Lunatic Hospital and Asylum
1765 Police Commissioners Act, cleansing, lighting, fire brigade
1774 Lock Hospital (venereal diseases of women)
1779 Public Baths in the Royal Infirmary
1790 Lying-in Hospital (midwife services at the moment of birth were free)
1791 Workhouse
1791 Act of Parliament for watching, cleaning, and lighting the town
1791 Stranger’s Friend Society
1792 Dispensary
1796 Board of Health
1797 House of Recovery (special hospital for fever victims)
1799 Soup Charity
1817 Manchester Gas Company constructed; profits from the charges to the users,
to be used in infrastructure projects.
1820-1826
New reservoirs, increasing supply from 120,000 gallons per day (only 15 % of required supply per house) to 900,000 gallons per day.
1824 First horse-drawn omnibus: from Market-street to Pendleton
1824 The Samaritan Society for the assistance of destitute families
1829 Gas lighting of the central part of Manchester
1838 Night Asylum for the Destitute Poor
1843 Road Sweeping Machine, to remove large quantities of compacted dust and refuse from the side streets.
1844 Manchester Police Act, for newly constructed houses: prohibition of back-to-back houses, requirement of individual privies
1846 Public Baths and Wash-Houses
1850 Longdendale Reservoirs initiated
Webb, Sidney and Beatrice
English Local Government: Statutory Authorities for Special Purposes,
Ch. 4, The Improvement Commissioners, 1922. (link in Wikipedia, “Improvements Commissioners”)
The reason for presenting this information here, is to show what was the accumulated progress made in the services of the town population. But even in 1851, there was still a lot to be done, in hygiene and drainage.
Improvement Commissioners were semi-governmental organizations in towns in England, formed to carry out works of paving, street lighting, cleaning the streets, nightwatchmen, Police, firemen. Each Commission was authorized by a separate Act of Parliament, with powers to levy rates. 160 such bodies in England came into being from 1725 to 1799. For Manchester there were Acts in 1765 and 1791.
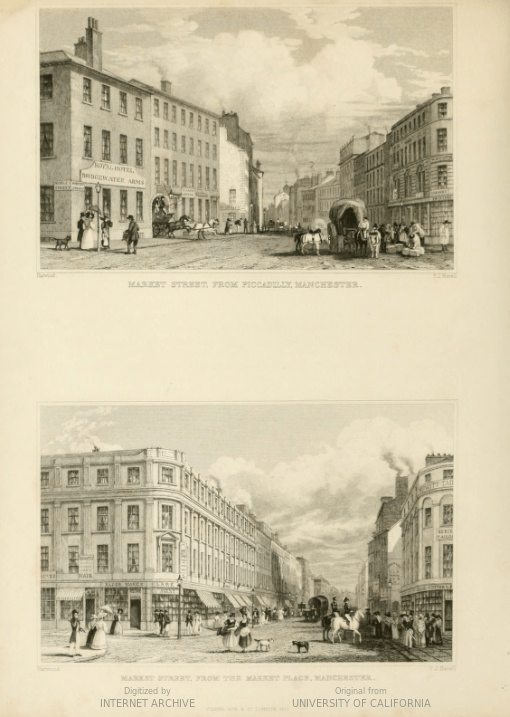
Austin, S.; Lancashire Illustrated, 1832, Market Street after reconstruction, from each end, plate facing p. 29
Of the adult working population of Manchester, only 28 % (males) and 32 % (females) were cotton mill workers.
The workers were generally seen as divided in two segments, the serious persons who saved their money, and those who spent all their money on drink, and thus (although they had good wages) they did not eat well and were behind with their rent payments.
The expression “Hungry Forties” was not used in writing in the 19Th century. The phrase came from the title of a book published in 1904. From 1838 to 1842, there was a catastrophic depression in the North of England (people died). In the other years of the decade, the economy was normal.
The wages in the cotton industry were good, the adult male workers received 20 shillings or more; additionally, the other members of the family (who were usually engaged in the same mill), earned another 10 shillings. This was enough for good quantities of food (5 pounds of meat and 2 pounds of bacon per family) and weekly expenses.
The wages in the other occupations with continuous employment were sufficient, as the incomes were given by the market.
About 45 % of the working-class families in Manchester were in conditions to invest in the Government Savings Banks. The average balance was twenty-five Pounds.
The consumption of meat in the Manchester Conurbation was close to 100 pounds per person per year (2 pounds per person per week), “meat on the bone”, i. e. only 60 % was edible. Additionally, the people ate ham + bacon, pigmeat, poultry, fish.
There were 550 butcher’s shops in the Manchester Conurbation in 1840 (see external files, with names and addresses).
The cotton mill workers were a little shorter than the national average, and the face and body did not have any excess flesh. This was because they did not make any forceful movements which would have developed muscles.
Of the cotton mill workers, in 1849, the men wore blue striped shirts, trousers and slippers, and the women generally had coarse pinafores and loose jackets tying round the throat. The outdoor dress of the men was reported as comfortable and respectable: velveteen jackets and shooting coats, with waistcoats and trousers of dark fustian cloth. The people were uniformly well shod, and their general appearance was one of unostentatious comfort.
There were about 750 schools in Manchester, with about 70,000 pupils. But about 20,000 children did not attend any school, apparently their parents did not have any interest in sending them to school.
There were lectures every Sunday to adults in the “Hall of Science”, which had space for 3,000 persons. According to Engels, the workers were knowledgeable about political and social questions.
The Mechanics’ Institutes had a total of 3,000 members in Manchester. In the years from 1837 to 1844, the Institutes presented 5 exhibitions (total attendance of 300,000 persons) about advances in science and technology.
The housing of the working-class in Manchester was not of a uniform quality, but could be divided into 3 classes: Third class (best): “far superior accommodation and comparatively comfortable dwellings, well drained, and provided with privies; frequently gardens, and in most of them ovens or boilers.”
Half of the houses were built by “building clubs” of the better-paid workers, who used individual artisans to construct them, with a mortgage from a bank, and then rented them out to lower-paid workers.
Starting from the bad condition of drainage and paving reported by Dr. Kay in 1831, the town administration was successful in considerably improving these areas up to 1840.
Up to 1842, the smaller streets were full of an accumulation of dust and rubbish, which was a danger to health, and made it impossible to transit the streets, except on foot.
In 1843, a Street-Sweeping Machine with rotating brushes, and drawn by a horse, was introduced. This cleaned the streets down to their base level, and was four times faster.
According to the Local Report to the Poor Law Commissioners in 1842, made by the Physician to the Ardwick and Ancoats Dispensary, there were some very ugly and insanitary districts in Manchester, with an indigent population. However this classification could only be applied to a small number of districts (Ancoats, Angel Meadow, etc.)
The Suburbs (Hulme, Chorlton-upon-Medlock, and Ardwick) had better houses, better sanitation and a better class of inhabitant, than the Township.
The really horrible areas (à la Engels) were not more than 10 % of the area of Manchester Proper (reports from doctors and visitors). The suburbs included in the Chorlton Registration District had decent housing and infrastructure.
An investigation was carried out by the Manchester Statistical Society in 1844, of the area of Ancoats, which was generally taken to be that of the largest proportion of working class and those of the poorest description. Even so, 40 % of the dwellings were “comfortable”, the Ancoats Lyceum had 310 members with 1,700 books, and of 8,000 children under 12, the half went to Sunday Schools (these were real schools, held on Sundays, not only religious instruction).
50 % of the deaths in the Northern Industrial Towns were of children below 5 years old. This obviously means that the other 50 % of deaths were “spread over” the age cohorts of above 5 years. For persons of 5 to 44 years old, the probability of dying in the following 12 months was some figure between 0.5 % and 1.5 %
The figures of infant mortality in England as an average were much lower than in other countries during the 19thcentury. The figures for Manchester and Liverpool, i. e. the worst cases in England, were about 210 / 1000 in 1840, and decreased to about 175 / 1000 in 1900. This means that the average in Germany was equal to Manchester and Liverpool from 1825 to 1845, and then was higher throughout the rest of the nineteenth century.
These small children did not die principally due to the general problems of hygiene in the town. Their deaths were due to the lack of care by the mothers, who left the children with “minders” of eight to ten years old; they did not give the small children nutritious and hygienic food; they gave them narcotic solutions and medicines suggested by druggists, which caused large numbers of cases of “convulsions”.
The birth rate in Manchester Conurbation in 1841 to 1851 was from 3.9 % to 4.2 %, and the death rate was from 2.5 % to 3.6 %. (Higher in Manchester Proper, lower in Chorlton).
The major causes of death in the Township in 1837-38 and 1838-39 (i. e. the first results from the new Register of Births, Deaths and Marriages) were: smallpox, measles, convulsions, pneumonia, consumption, teething. “Convulsions” were caused by use of “Godfrey’s Cordial” or by medicines irregularly prescribed by druggists.
“Consumption” was pulmonary tuberculosis. Unfortunately, we do not have the data to divide the numbers between “age less than five years”, “age five years or more”.
Manchester had the following medical services for the poor (all the medical institutions were without charge to the poor patient; the original cost of the buildings was covered by large donations; the running costs of medicines etc. was covered by monthly donations, the doctors gave their services free):
Royal Infirmary and Dispensary, Royal Lunatic Asylum, the House of Recovery (separate hosptal installation for fever patients), the Salford and Pendleton Royal Dispensary, the Chorlton-upon-Medlock Royal Dispensary, the Ardwick and Ancoats Dispensary, the Eye Institution, the Lying-In Hospital (midwife at the moment of delivery of the baby), the Lock Hospital (venereal infections of women).
There were also institutions and funds for social needs (equally funded by donations):
Soup Kitchen, the Boroughreeve’s Charity, the Night Asylum for the Homeless Poor, the District Provident Society, the Asylum for Female Penitents, the Ladies’ Jubilee School, the School for the Deaf and Dumb, the Blind Asylum.
There were 32 libraries in Manchester in 1852, also 156 Public Institutions, and 9 Parks and Places of Amusement (including a Zoo).
Many of the working class were interested in going to concerts, and in singing in choirs.
Large numbers of working-class men and women were active in demonstrations, distribution of propaganda, bazaars to collect donations, and organizing petitions to the Government, for:
The aim of this project, with reference to Manchester in 1841 – 1851, is to find the “unknown unknowns – the ones we don´t know we don´t know” (Secretary of Defense Donald Rumsfeld, 2002). A related requirement is to quantify some aspects, that until now have not been objectively quantified. The resulting document helps us to have a equilibrated description of Manchester in these years.
Examples of the first phrase, are that:
the town had a zoo,
parts of the working class liked to go to concerts and to sing in choirs,
all the municipal health services for the poor were without charge,
half of the infant mortality was due to the mothers not being able to care for their children;
there were 32 libraries in Manchester in 1852;
the local group of the Mechanics’ Institutes gave 5 exhibitions of scientific and technological progress in ten years;
from 1843 there was a Street-Sweeping Machine, which removed the thick deposits of compressed dust and refuse in the side streets.
Examples of the second target, are that: –
the cotton workers were very well paid at 30 – 33 shillings per family per week, when meat cost six pennies the pound;
the meat consumed was equivalent to 2 pounds per average person per week (although not equally eaten by the different economic segments);
infant mortality in Manchester and Liverpool (the worst cases in England) were less than the average of other countries (i. e. average of urban and rural in each case);
the really horrible districts as regards housing, sanitation and inhabitants were not more than 10 % of the urban area;
the working-class persons (leaving aside the indigents and the Irish) were decently dressed.
Please note that, in conformity with the “instructions” below, sources written after the year 1900 are not used in the searches for this project.
The solution to the first interrogative is to “read everything about Manchester in this period”, although this may appear unscientific; but if we are wanting to find things that we do not know about, this is the only way. That is, read the totality of: “Reports to the Morning Chronicle” (Angus Reach), “Annals of Manchester” (Axon), “Handbook of Manchester”, (Benjamin Love), “The Moral and Physical Conditions of the Working Classes employed in the Cotton Manufacture in Manchester” (Dr. J. P. Kay), “Manchester in 1844: Its Present Condition and Future Prospects” (Léon Faucher), “Manchester, Its Political, Social and Commercial History” (James Wheeler).
Further, the official reports to the Poor Law Commissioners, the Factory Inquiry Commission, “Rate of Wages, David Chadwick. On the Social and Educational Statistics of Manchester and Salford, 1861, David Chadwick,
Consult the indices of the reports of the Manchester Statistical Society for 1841-1851, and read the articles on financial and social investigations
It is important to demonstrate whether the living conditions in Manchester in the first half of the nineteenth century were: bad; bad in some parameters and good in other parameters; or good. Or possibly the facts changed through the years.
Why is it important to have clarity in this question? Because we would be in a better position to answer the same question, with reference to the whole of Great Britain. It would be difficult to conceive of Manchester as being a horrible place, while the rest of Great Britain would be an advanced society. Equally, it would be difficult to conceive of Manchester as being a good society, while the rest of Great Britain would be poor, underfed, uneducated, and overworked. Or, as we have it in 1 Corinthians 14: ”And if Christ is not risen, then is our preaching vain, and your faith is also vain.”
If we have a definition as to what the living conditions were really like, then we can investigate questions of the next lower level:
did the industrial system cause poverty in the towns?
did the industrial system cause bad housing and sanitary conditions?
did the industrial system cause extreme infant mortality?
did the industrial system cause unnaturally low wages for the workers?
did the industrial system cause unhappiness in the workers?
did the industrial system cause frictions between classes of society?
Please note that these questions actually have two dimensions. For example, the first question divides into: a) was there poverty in the towns, worse than “before”? b) was this increased poverty due to the introduction of the industrial system?
With respect to the standards of living, there is little agreement between academic authors on food consumption, economic growth, wage growth, life expectancy / death rate. We can see this, inspecting the textual information in:
Wikipedia -> Industrial Revolution -> Social Effects -> Standards of Living
As to heights, there are four different calculations by three different academics, using official registers of heights of soldiers.
If the data and the descriptions in this paper, “Manchester, 1841 – 1851”, are accepted, then we can check other calculations which may exist: “Manchester, 1831 – 1841”, “Manchester, 1821 – 1831”, “Manchester, 1811 – 1821”, Manchester, 1801 – 1811”. OR, “Liverpool, 1841 – 1851”, “Leeds, 1841 – 1851”, “Birmingham, 1841 – 1851”, “Bradford, 1841 – 1851”.
Milk in London was supplied by 8,500 cows in 1794, and by 19,000 in 1860. These cows were kept in small milking units in Islington, Hackney, and Edgware Road in 1794, to which was added the district of Kensington by 1829. The mill was sold at 4 to 5 pence the quart.
From before 1800, milk in Manchester was brought from special milk farms, at 3 to 10 miles distance. The transport was sometimes by horse and cart on main roads, but generally by canal. From 1840, the major part of the milk came from Cheshire by railway. The price at mid-century was 6 to 8 pence per gallon. The factory workers took about 1 ½ pints per capita per week.
In England in 1750, there were 15,000 milk cows, producing 600 gallons each yearly; with a population of 6 millions, the consumption was 0.03 pint per person per day, or 12 calories per person per day. In 1800, the figures were 100,000 cows, population of 9 millions, 0.15 pint per person per day, 60 calories per person per day. In 1850, the figures were 150,000 cows, population of 18 millions, 0.11 pint per person per day, 45 calories per person per day.
Cheese and Butter
There was a certain increase in the quantities commercialised during the first half of the 19thcentury. The amounts eaten per person did not change much, cheese about 1 lb. per family a week (100 calories/ family member/ day), butter about 1/2 lb. (100 calories/ family member/ day).
Manchester bought a considerable amount of cheese and butter from farms in Cheshire. From 1800 the butter came in large quantities from Ireland, although this was of lesser quality and less fresh.
Vegetables
Vegetables and fruits began to be of importance, at least in London and Lancashire, starting around 1750. The vegetables were generally turnips, carrots, onions, peas, and beans, and the common fruits sold were apples, pears, and cherries:
“The real recompence of labour, the real quantity of the necessaries and conveniences of life ….. has, during the course of the present century increased perhaps in a still greater proportion than in money price. Not only has grain become somewhat cheaper, but among many other things, from which the industrious poor derive an agreeable and wholesome variety of food, have become a great deal cheaper. Potatoes, for example, do not at present, through the greater part of the kingdom, cost half the price which they used to do thirty or forty years ago. The same thing may be said of turnips, carrots, cabbages; things which were formerly never raised but by the spade, but which are now commonly raised by the plough.”
(Adam Smith, economist, The Wealth of Nations, 1776, Book 1, Chapter 8, On the Wages of Labour)
“As to the produce of a garden, every middle-aged person of observation may perceive, within his own memory, both in town and country, how vastly the consumption of vegetables has increased. Green-stalls in cities now support multitudes in a comfortable state, while gardener get fortunes. Every decent labourer, also has his garden, which is half his support, as well as his delight; and common farmers provide plenty of beans, peas, and greens, for their hinds to eat with their bacon; and those few that do not are despised for their sordid parsimony, and looked upon as regardless of the welfare of their dependents. Potatoes have prevailed in this little district, by means of premiums, within these twenty years only, and are much esteemed now by the poor, who would scarce have ventured to taste them in the last reign.”
(Rev. Gilbert White, The Natural History of Selborne, first published 1789, Letter XXXIII, p. 233).
Very large areas in Fulham, Chelsea and Barnes, and to the north of the built-up area of London, were used for vegetables and fruits. At the end of the nineteenth century, there were 5000 acres of market vegetables, 800 acres for fruit, 1700 for potatoes, and 1200 for vegetables for cattle.
(General View of the former and present State of Market Gardens, and of the Quantity of Land now occupied for that Purpose within Twelve Miles of London, Daniel Lysons, 1796).
(Actually, in the first half of the nineteenth century, a huge arc, about 10 miles wide starting from the built-up area, and extending from a point north of the housing to reach the Thames at the height of Barnes and Chiswick, was fully dedicated to market gardens, milk farms, and brick-making sites)
Asparagus was sent by rail to Manchester from the 1840’s. Many different types of fruit were sent to other parts of the country by rail from Covent Garden. Starting from 1850, strawberries from Kent were sent out in refrigerated carriages to Yorkshire!
Fish
In London in 1860, very large quantities of fish and shellfish were sold.
Sugar
We have good figures for total consumption in the country, as all the quantities were imported (principally from the West Indies), so that we can make a calculation from the import duties. In 1750, the level of consumption was about 12 lb. per person per annum (50 calories/ family member/ day), in 1800 about 30 lb. (120 calories), and from 1820 to 1850 close to 20 lb. (80 calories). But note that a large disproportionate amount of sugar was used by the better classes, so that for the working classes we should use a multiplier of 60 % on the above figures
But since the main use was for the women of the working class to take the sugar with their tea, we may say that the women had perhaps 200 calories per day! According to the Rev. David Davies, his poor families used ¼ to ½ lb. per week.
Beer
According to Mr. George Porter, making a calculation based on the payments of the Malt Tax, the use of beer in 1849 was about 15 pints per family per week; since generally only the man drank the beer (although in the industrial districts, the wives also drank), this would be 150 to 200 calories for the man, averaged per day. (Porter, George Richardson, On the self-imposed Taxation of the Working Classes in the United Kingdom, Read before the Statistical Section of the British Association, August 1850).
The amounts had been about the same in 1801-1829.
Calories
The above figures translate to the following amounts of calories per average family member per day. The persons referenced are families of a man, a wife, and three children; the man has a constant employment, for wages. 2nd half 1st half 1st half 18th Century 19th Century 19th Century Agricultural Industrial
The quality and diversity of the food improves – at least for the industrial worker’s family – by 1850. Nearly everyone now eats wheaten bread. The industrial workers eat much more meat. There is more fruit, vegetables, fish and shellfish, poultry and eggs.
See:
Clayton, Paul; Rowbotham, JudithHow the Mid-Victorians Worked, Ate and Died International Journal of Environmental Research and Public Health, ISSN 1660-4601,2009, 6, pp. 1235-1253 http://www.ncbi.nlm.nih.gov/pmc/articles/PMC2672390/
Clayton, Paul; Rowbotham, JudithAn Unsuitable and Degraded Diet? Part One: Public Health Lessons from the Mid-Victorian Working Class Diet Journal of the Royal Society of Medicine, 2008, Jun 1, 101 (6), pp. 282-289 https://www.ncbi.nlm.nih.gov/pmc/articles/PMC2408622
Scola, Roger Feeding the Victorian City: The Food Supply of Manchester, 1770-1870 Manchester University Press, Manchester, 1992
To see if the food ingested gave sufficient calories for the physical work of a man, we have to convert the figures of “daily calories per average family member” to “daily calories per average father of the family”.
For this calculation, we make use of the daily calorie requirements at different ages, as published by the U. S. Food and Drug Administration:
Man 26-30 years 3,000 cals. Woman 26-30 years 2,000 cals. Child 8 years 1,800 cals. Child 6 years 1,600 cals. Child 4 years 1,400 cals.
Total 9,800 cals.
So that instead of 20 % of the total calorie requirements, the man needs 30 % of the total. This means that we should multiply the average input of calories by a factor of 1.50.
2nd half 1st half 1st half 18th Century 19th Century 19th Century Agricultural Industrial
Total calories man 3,510 3,450 4,000
Market Halls
In the first half of the nineteenth century, many large and medium towns in England built, at great expense, market halls, where the sellers of meat, fruit, and vegetables could have their stalls.
The predecessor was Sheffield in 1787. The building had space for: 53 butchers’ shops and 41 butchers’ stalls, 54 outside shops for shoemakers, breeches makers, clockmakers, staymakers, hucksters, hardwaremen, one bookbinder, one cabinet maker. In the semicircle were stalls occupied by 17 shoemakers, 8 breeches makers, 5 fishmongers and 5 fruiterers.
(Mitchell, Ian; Tradition and Innovation in English Retailing, 1700 to 1850, Ashgate Publishing, Farnham, 2016, p. 33)
The first really large market hall was St. John’s Market in Liverpool, built in 1820-1822:
St. John’s Market, Liverpool, built 1820-1822, street view and interior view (Austin, Harwood, Pyne, Lancashire Illustrated, 1832, plates facing p. 25)
(Anon., The Gentleman’s Magazine, vol. 132, 1822, before p. 113)
“This stupendous building, designed by Mr. John Foster, junior, and erected by the corporation of Liverpool, at an expense of £ 35,000, was begun in August, 1820, and finished in February, 1822. …The length of the building, is 183 yards; its breadth, 45 yards, forming a covered space of 8,235 square yards, or nearly two statute acres [equal to two football pitches, laid end to end]. …. The whole floor is substantially flagged, and every person resorting to the market may walk, dry-footed, in every part of the building, alike protected from the cold and rain of the tempest, or the oppressive heat and glare of a summer sun. … The walls are lined by 62 shops and 6 offices, close to the lower tier of windows, between which and the upper ones the sloping roofs of the shops are placed. The shops, the dimensions of which are 6 yards by 4, and which are provided with fire-places, are let to dealers in various kinds of provision, namely, butchers, pork-dealers, fruiterers, fishmongers, poulterers, cheesemongers, bread-bakers, &c., and are numbered. …. The great body of the market is occupied by four ranges of stalls, tables, &c., running in a line with the pillars from end to end, including 160 stalls, three yards each, for purposes the same as the shops; 34 green-standings, three yards each, 18 fruit-standings, three yards each, 44 stone compartments, three yards each, for potatoes; 36 fish-standings, one and a half yards each; 201 table-compartments, one yard each, for eggs, poultry, and vegetables; and 122 forms or benches, one yard each, for similar articles. There are 144 gas-lights, by which the place is brilliantly illuminated every night; …..”
(Kaye, 1823, pp. 179-182)
Manchester, in the first half of the 19th century, did not have a central market hall, but ten markets, one for each type of food. “On every day in the week, except Sunday, provisions are to be purchased. Tuesday, Thursday, and Saturday, are the principal flesh-market days. The last exhibits an abundance of provisions of every description, which never fails to surprise strangers, not only as to its collection, but as to its probable sale. The quantity of butcher’s meat sold every Saturday is almost beyond belief; and as for quality, it is universally allowed to be equal, at least, to that exposed for sale in any market in the united kingdom [sic].”
(Joseph Aston, A Picture of Manchester, 3rd Edition 1826, pp. 236-240)
The Market Hall in Birmingham, built in 1835, was 365 feet long and 108 feet wide, with 600 market stalls:
Other Market Halls built during our period were: Rochdale 1823, enlarged 1844, 24 shops and 180 stalls; Ashton 1828 (*); Stalybridge 1831, expanded 1843; Bury 1839, 32,000 sq. ft; Oldham 1856; Bolton 1853, 600 stalls and shops (*); Burnley 1829; Salford 1825; Blackburn 1848; Birkenhead 1845 (12 butchers’ shops, 26 butchers’ stalls, 20 vegetable stands, 8 fish shops, 6 game shops, 8 provisions shops, 8 pedlars’ shops, 7 pedlars’ stands, 8 flower stands, 76 farmers’ tables, 7 rabbit and tripe stands, and 48 vaults).
(Schmiechen, 2016, pp. 190-191)
Grainger Market Hall in Newcastle, built in 1835, was the largest in Britain, with more than two acres, 337 x 241 ft, 243 shops and stalls (*).
(William Collard and M. Ross, Architectural and Picturesque Views of Newcastle-upon-Tyne, 1841, pp. 88-91, with plan and six plates)
The wages in Newcastle were high: common labourers had on average 18 shillings per week, the skilled labourers from 25 to 40 shillings (Cargill, 1838, p. 361).
(*) Still in use – refurbished – as indoor food markets or as shopping centres.
From the size of the buildings it is very clear, that the users were not just servants sent by the better class families; they were the totality of the working people of the town. This means that the working class in these towns had a diet of considerable quantities of meat, fish, cheese, vegetables, fruit, potatoes and eggs.
It would be nice to be have an idea of the increase in the numbers of shops in our period, so as to have another input as to the volume of food and other articles bought. But this information does not exist. What we can do, as a matter of illustration, is to give the number and type of shops in representative provincial towns, for example in 1828-29.
“The enclosure of the fens has tended most materially to the increase of the commercial importance of Boston, by causing immense quantities of grain to be brought into its market; and the subsequent shipment of this grain to London and other places gives employment to an increased quantity of shipping. Of late years, too, there has been a growing trade to the Baltic; a very considerable trade also is carried on with the interior of the kingdom, by means of the Witham and the various navigable canals with which it communicates; and manufactures have gained some footing in the town, consisting of sackings, canvas, sail cloth and lace; besides which, there are iron and brass foundries on a large scale”.
(Pigot, 1829, pp. 509-513)
Carlisle, population 15,500:
Academies & Schools 40; Bakers & Flour Dealers 15; Blacksmiths 20; Booksellers, Stationers and Binders 5; Boot and Shoe Makers 38; Butchers 35; Cabinet Makers & Joiners 20; Clog and Patten Makers 10; Grocers & Tea Merchants 40; Linen & Woollen Drapers 20; Milliners & Dress Makers 20; Painters and Glaziers 10; Shopkeepers and Dealers in Sundries 140; Straw Hat Makers 10; Tailors 35; Taverns & Public Houses 150; Tea and Coffee Dealers 10; Watch & Clock Makers 7.
The commercial activities are:
“The manufactures brought to perfection in Carlisle are of an important character; they embrace the weaving of checks and ginghams, and other cotton fabrics, calico printing, and the manufacture of cotton twist, much of which is exported. Hats are also made here of a superior quality; there are also extensive dye-works, and three iron foundries upon a large scale, but the cotton trade is by far of the greatest consequence to the manufacturing interest here.”
(Pigot, 1829, pp. 67-73)
We see that there are a large number of different shops, which obviously means that the inhabitants are financially able to buy these articles. The commercial activities show that there is a large amount of employment in the towns, which does not have a connection with factories.