The above calculations show us what happened to the standard wage levels for the head of the family, from 1770 to 1860.
They are not useful to demonstrate what happened to the living costs per family member, because they do not take into account income from other family members, and the wages are calculated per earner and not per food consumer.
The necessary changes are:
- for the agricultural labourers’ families, add the summer wage difference, the harvest month bonus, extra pay for task work, income from boys’ work, women’s income from spinning, women’s income from working in the fields, and present the total amount per family per week;
- for the agricultural labourers’ families, add the women’s income from spinning up to 1810, and present the total amount per family per week.
The “model” for the agricultural families is as follows:
- of the number of adult male workers in the basis data per year, 80 % are men of 20 years or more;
- we suppose that exactly these men are heads of family, and thus this figure gives the number of families;
- the extra income for the man is made up of: 4 months summer wage, 10 % more than the winter wage, one month harvest wage at double rate, task work at different percentages during our period;
- for each family, there are proportionally 10 % young men of 16 to 19, who earn a full wage;
- 30 % of families have a son from 12 to 16 years, who earns 30 % of the father’s basic wage;
- starting from 1770, and decreasing to zero in 1820, 80 % of the wives earn 3 shillings a week from spinning;
- starting from 1840, 30 % of the wives work in the fields at 40 % of the man’s basic wage;
- the income of little girls from spinning is negligible;
- the income of little boys working in the fields is negligible.
The corrections to the income of the agricultural family give the following figures:
| Average wage | Average wage | Weekly wage | Bushel wheat | |
| Shillings week | without spinning | Shillings | Shillings | |
| Family | Man | |||
| 1770 | 13.5 | 11.1 | 6.5 | 5.3 |
| 1775 | 13.7 | 11.3 | 6.6 | 6.2 |
| 1780 | 14.0 | 11.9 | 7.0 | 3.8 |
| 1785 | 13.3 | 11.9 | 7.0 | 5.1 |
| 1790 | 13.8 | 12.6 | 7.4 | 6.7 |
| 1795 | 16.2 | 15.2 | 8.9 | 9.1 |
| 1800 | 16.7 | 15.9 | 9.3 | 13.8 |
| 1805 | 17.3 | 17.0 | 10.6 | 10.9 |
| 1810 | 18.4 | 18.2 | 11.3 | 12.9 |
| 1815 | 19.5 | 19.4 | 12.1 | 8.0 |
| 1820 | 18.9 | 18.8 | 11.7 | 8.2 |
| 1825 | 17.5 | 17.5 | 10.9 | 8.3 |
| 1830 | 16.7 | 16.7 | 10.4 | 8.0 |
| 1835 | 16.4 | 16.4 | 10.2 | 4.6 |
| 1840 | 17.4 | 17.4 | 11.0 | 8.3 |
| 1845 | 15.1 | 15.1 | 9.5 | 6.3 |
| 1850 | 15.2 | 15.2 | 9.5 | 5.0 |
| 1855 | 17.3 | 17.3 | 10.9 | 9.3 |
| 1860 | 17.5 | 17.5 | 11.0 | 6.8 |

Wages, expenses, and real wages for agricultural families, with spinning in the eighteenth century:
| Wages index | Expenses index | Real Wages | |
| Agr Lab | Agr Lab | Agr Lab | |
| 1770 | 100.0 | 100.0 | 100.0 |
| 1775 | 101.3 | 105.5 | 96.0 |
| 1780 | 104.1 | 85.8 | 121.4 |
| 1785 | 98.9 | 97.4 | 101.6 |
| 1790 | 102.5 | 112.2 | 91.3 |
| 1795 | 120.0 | 139.1 | 86.3 |
| 1800 | 123.6 | 175.2 | 70.5 |
| 1805 | 128.4 | 161.6 | 79.5 |
| 1810 | 136.0 | 179.5 | 75.8 |
| 1815 | 144.8 | 150.6 | 96.1 |
| 1820 | 180.0 | 148.6 | 121.1 |
| 1825 | 129.8 | 147.1 | 88.2 |
| 1830 | 123.8 | 129.8 | 95.4 |
| 1835 | 121.5 | 108.3 | 112.1 |
| 1840 | 128.6 | 153.9 | 83.6 |
| 1845 | 111.9 | 129.2 | 86.6 |
| 1850 | 112.3 | 111.0 | 101.2 |
| 1855 | 127.9 | 162.4 | 78.8 |
| 1860 | 129.4 | 139.3 | 92.9 |
a
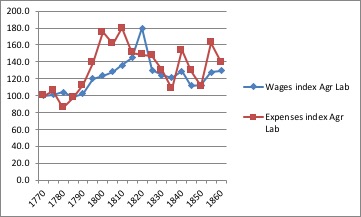
Thus we see that the agricultural families had a slightly lower real wage in 1860 than in 1770. If we cancel the effect of including the women’s spinning in 1770, the increase in real wage would be about 15 %.
| COMPARISON 1770 TO 1860 AGRICULTURAL WORKERS TOTAL FAMILY, WITHOUT SPINNING 1770 = 100 WAGES 158 EXPENSES 139 REAL WAGES 114 |
| COMPARISON 1770 TO 1860 AGRICULTURAL WORKERS TOTAL FAMILY, WITH SPINNING 1770 = 100 WAGES 130 EXPENSES 139 REAL WAGES 94 |
Total agricultural and non-agricultural
The average nominal earnings of the families, agricultural and non-agricultural, with the above changes, are:
| Shillings week | Shillings week | Shillings week | |
| Agr Lab | Non Agr | All Occupations | |
| 1770 | 13.5 | 10.1 | 11.5 |
| 1775 | 13.7 | 10.4 | 11.7 |
| 1780 | 14.0 | 11.0 | 12.3 |
| 1785 | 13.3 | 11.5 | 12.3 |
| 1790 | 13.8 | 12.5 | 13.1 |
| 1795 | 16.2 | 15.1 | 15.5 |
| 1800 | 16.7 | 15.4 | 15.8 |
| 1805 | 17.3 | 16.0 | 16.5 |
| 1810 | 18.4 | 16.6 | 17.2 |
| 1815 | 19.5 | 16.5 | 17.4 |
| 1820 | 18.9 | 15.5 | 16.5 |
| 1825 | 17.5 | 15.7 | 16.2 |
| 1830 | 16.7 | 15.7 | 16.0 |
| 1835 | 16.4 | 16.0 | 16.1 |
| 1840 | 17.4 | 16.0 | 16.4 |
| 1845 | 15.1 | 16.3 | 16.0 |
| 1850 | 15.2 | 16.7 | 16.3 |
| 1855 | 17.3 | 18.4 | 18.1 |
| 1860 | 17.5 | 19.7 | 19.2 |
| 1770-1815 | 144.8 | 163.3 | 151.3 |
| 1815-1860 | 89.4 | 119.3 | 110.3 |
| 1770-1860 | 129.4 | 195.1 | 167.0 |

Pounds per Year
The above calculation with the new assumptions, gives the following comparison against the Feinstein data:
POUNDS PER YEAR, PRESENT STUDY,
REDUCED BY 10 % FOR LOST WORKING DAYS
| Average wage | Average wage | |
| Pounds pa | Pounds p a | |
| Present study | Feinstein 1866 42 | |
| 1770 | 26.9 | 18.0 |
| 1775 | 27.4 | 18.2 |
| 1780 | 28.7 | 19.4 |
| 1785 | 28.0 | 19.5 |
| 1790 | 30.7 | 21.1 |
| 1795 | 36.2 | 25.7 |
| 1800 | 37.0 | 31.4 |
| 1805 | 38.6 | 35.0 |
| 1810 | 40.3 | 37.3 |
| 1815 | 40.7 | 36.0 |
| 1820 | 38.6 | 33.0 |
| 1825 | 38.0 | 31.1 |
| 1830 | 37.4 | 30.1 |
| 1835 | 37.7 | 30.1 |
| 1840 | 38.3 | 32.6 |
| 1845 | 37.4 | 32.4 |
| 1850 | 38.2 | 32.4 |
| 1855 | 42.5 | 37.7 |
| 1860 | 45.0 | 38.2 |
| 1866 | 42.0 | |
| 1770-1815 | 1.52 | 2.00 |
| 1815-1860 | 1.11 | 1.06 |
| 1770-1860 | 1.68 | 2.13 |
a
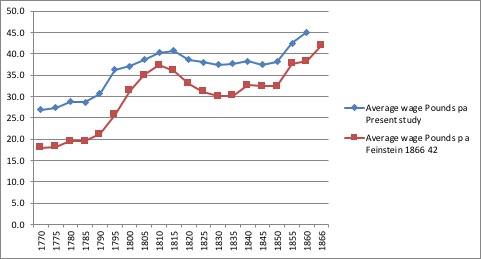
As was to be expected, the average wage over all occupations in the earlier years shows a considerable increase against the Feinstein data. This is due to the income from the wives’ spinning activities, and the income from the husbands’ task-work.
The numbers also show that the standard of living shortly before the Industrial Revolution was not low, as was supposed by Feinstein.
| Wages index | Expenses index | Real Wages | |
| All occup | All occup | All occup | |
| 1770 | 100.0 | 100.0 | 100.0 |
| 1775 | 101.8 | 107.7 | 94.6 |
| 1780 | 106.9 | 96.2 | 111.1 |
| 1785 | 106.7 | 103.4 | 103.2 |
| 1790 | 114.2 | 113.4 | 100.8 |
| 1795 | 134.9 | 135.7 | 99.3 |
| 1800 | 137.8 | 183.9 | 75.0 |
| 1805 | 143.8 | 170.8 | 84.2 |
| 1810 | 150.0 | 191.5 | 78.3 |
| 1815 | 151.7 | 167.1 | 90.8 |
| 1820 | 143.8 | 161.2 | 89.3 |
| 1825 | 141.5 | 157.5 | 89.8 |
| 1830 | 139.3 | 136.2 | 102.3 |
| 1835 | 140.4 | 118.8 | 118.2 |
| 1840 | 142.5 | 154.5 | 92.3 |
| 1845 | 139.4 | 134.4 | 103.7 |
| 1850 | 142.1 | 121.5 | 117.0 |
| 1855 | 158.1 | 161.4 | 97.9 |
| 1860 | 167.7 | 147.9 | 113.4 |
a

| COMPARISON 1770 TO 1860 AGRICULTURAL PLUS NON-AGRICULTURAL WITH CORRECTIONS 1770 = 100 WAGES 168 EXPENSES 148 REAL WAGES 113 |
Again, the averaging of the agricultural and non-agricultural figures does not give us any new insights.
