The comparisons between the wages indices and the expenses indices give the following results. (In all cases, in the five-yearly data, the figures for 1840 and for 1855 are not representative of the general trend, as exactly these years had abnormal inflation; the recommendation is to mentally draw a straight line from 1835 to 1845, and another from 1850 to 1860.)
Wages and Expenses Agricultural Laborers
| Wages index | Expenses index | Real Wages | |
| Agr Lab | Agr Lab | Agr Lab | |
| 1770 | 100.0 | 100.0 | 100.0 |
| 1775 | 101.5 | 105.5 | 96.2 |
| 1780 | 107.7 | 85.8 | 125.6 |
| 1785 | 107.7 | 97.4 | 110.6 |
| 1790 | 113.8 | 112.2 | 101.4 |
| 1795 | 136.9 | 139.1 | 98.4 |
| 1800 | 143.1 | 175.2 | 81.7 |
| 1805 | 163.1 | 161.6 | 100.9 |
| 1810 | 173.8 | 179.5 | 96.9 |
| 1815 | 186.2 | 150.6 | 123.6 |
| 1820 | 180.0 | 148.6 | 121.1 |
| 1825 | 167.7 | 147.1 | 114.0 |
| 1830 | 160.0 | 129.8 | 123.2 |
| 1835 | 156.9 | 108.3 | 144.9 |
| 1840 | 169.2 | 153.9 | 110.0 |
| 1845 | 146.2 | 129.2 | 113.1 |
| 1850 | 146.2 | 111.0 | 131.7 |
| 1855 | 167.7 | 162.4 | 103.3 |
| 1860 | 169.2 | 139.3 | 121.5 |
a
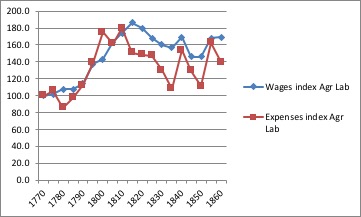
| COMPARISON 1770 TO 1860 AGRICULTURAL LABOURERS WEEKLY WAGES 1770 = 100 WAGES 169 EXPENSES 139 REAL WAGES 121 |
For the whole period from 1815 onwards, the real wages are about 20 to 25 % higher than in 1770.
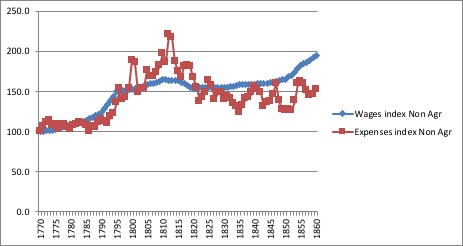
Wages and Expenses Non-Agricultural Occupations
| Wages index | Expenses index | Real Wages | |
| Non Agr | Non Agr | Non Agr | |
| 1770 | 100.0 | 100.0 | 100.0 |
| 1775 | 103.0 | 109.1 | 95.9 |
| 1780 | 108.9 | 102.7 | 106.5 |
| 1785 | 113.9 | 107.0 | 108.1 |
| 1790 | 123.3 | 114.1 | 111.4 |
| 1795 | 149.5 | 133.9 | 114.4 |
| 1800 | 152.5 | 188.2 | 81.9 |
| 1805 | 158.4 | 175.1 | 89.8 |
| 1810 | 164.4 | 196.9 | 84.9 |
| 1815 | 163.4 | 174.8 | 95.1 |
| 1820 | 153.5 | 166.4 | 92.3 |
| 1825 | 155.4 | 162.0 | 94.7 |
| 1830 | 155.4 | 138.8 | 110.0 |
| 1835 | 158.4 | 123.0 | 125.8 |
| 1840 | 158.4 | 154.7 | 99.5 |
| 1845 | 161.4 | 136.2 | 115.5 |
| 1850 | 165.3 | 124.7 | 129.3 |
| 1855 | 182.3 | 161.0 | 109.3 |
| 1860 | 195.0 | 150.3 | 124.7 |
a
| COMPARISON 1770 TO 1860 NON-AGRICULTURAL WORKERS 1770 = 100 WAGES 195 EXPENSES 152 REAL WAGES 128 |
The real wages for non-agricultural workers are in negative territory for the period 1800 to 1830, as they did not compensate for the high prices caused by the bad harvests up to 1815, and the financial recession in 1815-1822.
The Industrial Revolution for a number of industries/occupations only impacted the technology and the business model starting in 1820, and thus there was not a great movement in the average wages in the country.
Possibly the most interesting method for showing the movements in the incomes and expenses of the workers, is to compare the average weekly wage with the cost of 15 quartern loaves (approx. corresponds to one bushel of wheat). The cost of one bushel of wheat – or a little less – was taken to be enough to cover the normal expenses of a family.
| Average wage | Quartern Loaf | |
| Shillings week | Pence | |
| Present study | ||
| 1770 | 10.1 | 6.0 |
| 1775 | 10.4 | 8.0 |
| 1780 | 11.0 | 6.0 |
| 1785 | 11.5 | 6.5 |
| 1790 | 12.5 | 8.0 |
| 1795 | 15.1 | 10.3 |
| 1800 | 15.4 | 18.3 |
| 1805 | 16.0 | 14.0 |
| 1810 | 16.6 | 17.0 |
| 1815 | 16.5 | 10.0 |
| 1820 | 15.5 | 10.0 |
| 1825 | 15.7 | 10.5 |
| 1830 | 15.7 | 10.5 |
| 1835 | 16.0 | 7.0 |
| 1840 | 16.0 | 10.0 |
| 1845 | 16.3 | 7.5 |
| 1850 | 16.7 | 6.5 |
| 1855 | 18.4 | 10.3 |
| 1860 | 19.7 | 8.0 |
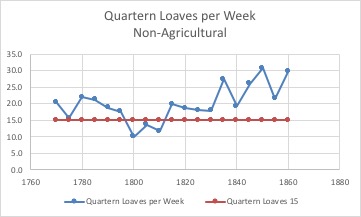
We see that the average incomes of the families at the beginning of our period show a surplus of about 30 % above the normal expenses, then are below the required amount in the years 1800-1810 due the high prices of corn, revert to 30 % surplus for 1815-1830, and increase considerably up to 1860. In 1860 the families, after paying for their necessary expenses, have an equal amount free for any other sort of goods or services; they will not be using this extra money for paying for a second quantity of bread! For this reason they are a lot richer than before 1830.
But we must note that these figures are averages of averages. They are averages of a number of occupations, and inside each occupation, they are averages of a range of job descriptions and personal circumstances. The fact that the country average is around the 17 line in a given year, does not mean that everyone is eating enough. It probably means that as an estimate 25 % of the population is between 10 and 15, and 5 % of the population is below 10, which means that they are really suffering.
