The first task is to decide the weights of the different cost elements in the family budgets. Below we have the figures for some families noted in previous sections.
| Spinners 1806 | Wool Weaver 1828 | Two Spinners 1833 | Two Spinners 1833 | Operative 1839 | |
| % | % | % | |||
| Bread, meal, flour, oatcake | 22.3 | 25.0 | 17.0 | 20.1 | 22.0 |
| Meat, bacon | 22.3 | 7.0 | 14.5 | 15.1 | 11.7 |
| Potatoes, vegetables | 3.7 | 8.8 | 2.7 | 2.8 | 7.4 |
| Milk | 1.9 | 5.0 | 5.3 | 5.1 | |
| Coffee, tea | 3.7 | 2.2 | 2.7 | 2.8 | 7.3 |
| Sugar | 7.4 | 6.5 | 5.8 | 6.2 | 5.1 |
| Butter, cheese | 11.1 | 16.8 | 10.2 | 10.6 | 3.2 |
| Coals, candles | 7.8 | 9.2 | 4.2 | 3.5 | 2.9 |
| Rent, taxes | 12.9 | 12.6 | 11.7 | 12.3 | 11.7 |
| Clothing | 2.2 | 8.0 | 8.8 | ||
| Beer, ale, cider, tobacco | 2.8 | 10.0 | 10.2 | ||
| Personal expenses | 4.2 | 8.5 | 7.3 | ||
| Other | 8.8 | 11.1 | 7.5 |
We see that there was a great deal of difference in percentages between the income levels and between the occupations. The industrial workers spent about 25 % of their income on bread/ meal/ flour/ oatcakes; the agricultural labourers about 50 %. We cannot calculate only one average of the cost structures of the family budgets for all the workers in the country, and use this as a basis for estimating the movements in the cost of living.
The percentages used in the following calculations are as follows:
| Non-Agricultural | |
| % | |
| Bread, meal, flour, oatcake | 25 |
| Meat, bacon | 17 |
| Potatoes | 5 |
| Cheese | 4 |
| Butter | 7 |
| Sugar | 4 |
| Tea | 5 |
| Milk | 4 |
| Beer | 5 |
| Rent | 12 |
| Fuel | 4 |
| Clothing | 8 |
Types of food, and their cost
As the largest part of the expenses of the labourers and their families was for cereals and breads, and the prices were very different between wheat on the one hand and barley, rye and oats on the other hand, it is important to define the percentages used for each one. The figures would also have to reflect the change from the inferior cereals to wheat in some regions of England during the eighteenth century.
For the period 1760 to 1780, it appears that the proportions should be:
Wheat 63 %, rye 15 %, barley 12 %, oats 10 %.
In order to take measures to reduce the suffering due to the scarcity of wheat in 1800, the House of Lords requested an investigation into the consumption of wheat, which gave information which leads to percentages which could be used for 1780 to 1799:
Wheat 60 %, rye 10 %, barley 15 %, oats 15 %.
But taking into account the information above, that “where, within a few years, that diet had been partially changed for wheaten bread, recourse had almost universally been had to their former food”, and also from the note below, that there was a large change to barley in the years after 1800, in order to economize the cost of food in the family budget, the percentages for England should be changed to:
Wheat 40 %, rye 10 %, barley 30 %, oats 20 %.
The change in food choices is commented by E. J. T. Collins:
“That choice of cereal was price and income elastic, and that pre-industrial patterns endured until at least the early nineteenth century is verified by the government inquiries of 1796 and 1800, which show not only a marked decline in per capita cereal consumption, but also a widespread substitution of barley, and to lesser extents, of oats, pulse, and rye, for wheat, and of browner for whiter flours.
Positive aversion to the use of wheat substitutes was more apparent in 1796 than in 1800, but was in both years confined to a few southern and eastern counties, in particular, London and Middlesex, Berkshire, Buckinghamshire, Essex, Hampshire, Hertfordshire, Kent, Oxfordshire, Surrey, Sussex, and Wiltshire. Here it was probably true, as at Wootton Bassett, that the “lower orders” preferred “half a loaf of fine Wheaten Bread, to a pound of mixed with any substitute.” The only important concession was a switch from first- to second- and third-quality flours.
Elsewhere in Britain, and even in parts of the above-mentioned counties, substitution was the general rule. In 1796 one-third of the population of Calne (Wiltshire) ate barley bread alone, and another third a two-to-one mixture of wheat and barley. In 1800, partly because cereal prices were higher and partly because the backbone of resistance was already broken by the earlier crisis, coarser grains were more extensively resorted to than in 1796. Of the almost 500 towns and villages replying to the government circular, most claimed a reduction in wheat consumption of between 30 and 50 per cent. The greater part of the “labouring population” of southern Britain then subsisted, largely if not completely, on barley, while in the north wheat lost most of the ground it had gained there since the mid-eighteenth century. Large quantities of rye were imported to help bridge the gap. In Barkway (Hertfordshire) a “wholesome nutricious [sic] Bread made of Half Wheat and Half Rye” was employed by the “poor People, many Farmers and the little Tradesmen””
(Dietary Change and Cereal Consumption in Britain in the Nineteenth Century, 1975, pp. 104-105)
For the period 1816 to 1860, the same proportions as for 1780 to 1800 should be used, as the price of wheat returned to normal levels.
Wheat 60 %, rye 10 %, barley 15 %, oats 15 %.
The use of these parameters impacts strongly on the ratio of earnings to expenses in the period 1800 to 1815. If we use the numbers above, we have a situation in which the farm worker population can buy enough to eat, but if we continue with wheat at 60 %, there is a large negative gap. The labourers could buy enough to eat, but at a cost of reducing their “food standard of living”, eating barley bread instead of wheaten bread, and (the poorest segment) eating large quantities of potatoes.
Basis data for indices are defined in each case as:
| Wheat: quartern wheat loaf, Retail Prices, Bread (City of London) Barley, Rye, Oats: prices ex-farm Meat: Greenwich Hospital, volume discount prices Potatoes: index movement in line with wheat Cheese: Greenwich Hospital, volume discount prices Butter: Greenwich Hospital, volume discount prices Sugar: retail prices, with 15 sh. tax from 1784, and 25 sh. tax from 1803. Tea: retail prices, incl. duty Milk: index movement in line with butter Beer: Greenwich Hospital, barrel price, adding 25 % for years before 1830,for “Beer Tax” Candles and Soap: Greenwich Hospital, volume discount prices Rent: in line with industrial wages Fuel: Coal, pit-mouth prices Clothing: reducing to Index = 40 in 1860 |
Sources:
| Greenwich Hospital, Contract Prices Board of Trade, Report on Wholesale and Retail Prices, 1903. Journal of the Royal Statistical Society, Vol. 1, 1839, p. 56-57. “British History Chronologically Arranged”, John Wade, 1839 “Gentlemen’s Quarterly” each year Grey Coat Hospital “Coal and the Industrial Revolution”, Gregory Clark |
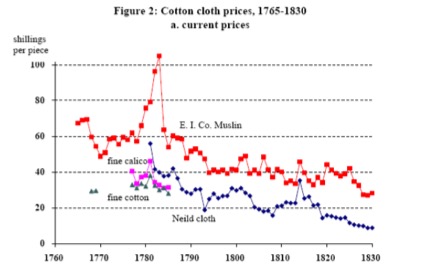
Reductions in prices of cotton, wool, and linen clothing articles, in function of the decreases in costs of thread and cloth.
| Cotton calico cloth 72 7/8 went down from 1L. 8s. 0d. per yard in 1814, to 15s. 9d. in 1820, 16s. 0d. in 1825, 8s. 3d. in 1830, 9s. 9d. in 1835, 7s. 3d. in 1840, and 6s. 9d. in 1845 (Porter, 1851, p. 184). The cost of labour for woollen broadcloth of initial weight 80 lb. was 8L. 18s. 2d. in 1796, 6L. 3s. 5d. in 1805, 5L. 15s. 5d. in 1820, and 4L. 7s. 3d. in 1828 (Lipton, 1921, pp. 258-260; quoting House of Lords, Hand-loom Weavers, 1840, p. 439). Spun yarn of flax is reported at 11s. 5d. per bundle in 1834, 10s. 9 ½ d. in 1840, 7s. 9d. in 1845, and 6s. 7d. in 1849 (Porter, 1851, p. 228). Canvas material from linen (No. 37) decreased from 30s. 0d. in 1813 to 23s. 0d. in 1820, 18s. 0d. in 1826, 17s 0d. in 1830, and 18s. 0d. in 1833 (Porter, 1851, pp. 227-228). Cotton prints, bought by Bethlehem Hospital, decreased from 1s. 1 ½ d. per yard in 1818 to 0s. 6 ¼ d. in 1835 (Porter, 1851, p. 590). Shoes, bought by Greenwich Hospital, went down from 5s. 8d. in 1800 to 3s. 3d. in 1837 (Porter, 1851, p. 591). Officers’ coats bought by Chelsea Hospital, decreased from 3L. 8s. 7d. in 1815 to 2L. 2s. 7d. in 1834 , but 2L. 7s. 4d. in 1835 (Porter, 1851, p. 591). |
(Harley, 2010, p. 8)
“There is no doubt as to their comparative situation now and during the war. Their woollen clothing is now one-third cheaper than it was during the war; cotton clothing is less than one-half the price it was. In their food, certainly, 1s. will go farther than 18d. would during the war; house-rent is 25 per cent at least lower.”
(Select Committee on Commerce, Manufacture and Shipping, 1833; evidence of Mr. James Thomson, Calico Printer, Lancaster, p. 237)
“Clothing also became extremely cheap, which enabled the working classes not only to clothe themselves more decently and comfortably, but to wear articles of a more durable description than formerly. Calicoes are supposed to have fallen two-thirds in price since the peace of 1815; linens, one-half; stout shoes, one third; the coarse felt hats, for which the labouring man usd to pay 3s. 6d. fell to 2s. or have been superseded by silk hats.”
(Wade, p. 1035, referring to 1830-1837)
“The benefit of cheapness reaches them [the working man or woman] in the quality of their purchases, and as the tendency has for many years been towards lessened prices, we now see – such, at least, is the case in London – that the working classes are better clad than formerly, keeping in this respect their relative position with the more easy classes, whose dress – especially among ladies – is generally not only better in quality, but actually more costly, than when the articles used were of much higher price than now. When engaged on an inquiry similar to the present, fifteen years ago, I was informed by a person who gave constant employment to 1,200 people, men and women, in making up articles of clothing used by the working classes, that, taking one article with another, the materials used then cost not more than one-half they had cost at the close of the war in 1815, and we know that since 1834, there has been a further and very great abatement in the cost of most, if not all, such materials. Strong cotton cloths, the wholesale price of which in 1810 was 10d. a yard, sold in 1820 for 9d., had fallen in 1834 to 4d., and now may be bought at from 2d. to 2 ½ d. a yard. Printed calico, which sold in 1810 at 2s. 2d., in 1820 at 1s. 4d., in 1833, the Excise duty having been removed, at 6d. to 8d., may now be bought at from 3s. to 8s. per piece of 28 ½ yards, or from 1 ½ d. to 3 ½ a yard. The increased use of cotton in this country, so far beyond the increase in our export of cotton goods, proves that the people, and especially the working people, who are the great consumers of cotton goods among us, have fully profited by their progressive cheapening.”
(Porter, 1850, p. 213)
“It is impossible to estimate the advantage to the bulk of the people, from the wonderful cheapness of cotton goods. The wife of a labouring man may buy at a retail shop a neat and good print as low as fourpence per yard, so that, allowing seven yards for the dress, the whole material shall only cost two shillings and four pence. Common plain calico may be bought for 2 ½ d. per yard. Elegant cotton prints, for ladies’ dresses, sell at from 10d. to 1s. 4d. per yard, and printed muslins at from 1s. to 4s., the higher priced having beautiful patterns, in brilliant and permanent colours. Thus the humblest classes have now the means as of great neatness, and even gaiety of dress, as the middle and upper classes of the last age. A country-wake in the nineteenth century may display as much finery as a drawing-room of the eighteenth; and the peasant’s cottage may, at this day, with good management, have as handsome furniture for beds, windows, and tables, as the house of a substantial tradesman, sixty years since.”
(Baines, 1836, p. 358)
There may well be doubts that the yearly movements in wholesale or large-discount prices for food, may not be reflecting correctly the movements in the prices actually paid by the labourers or workers. In the following we compare the 1770 (approx.) and 1860 (approx.) prices reported in family budgets, with the large-discount prices used in these calculations. We see that in the three cases the 1770-1860 increases in consumer prices are a little less than those in the large-discount prices.
Beef/Mutton
| Young | 1770 | 3 to 5 | |||||
| Greenwich Hospital | London | 1770 | 3.1 | ||||
| Davies | 1787 | 4 ½ to 5 | |||||
| Greenwich Hospital | London | 1787 | 4.0 | ||||
| Man Stat Soc | 1790 | 3 ¼ | |||||
| Eden | 1796 | 5 to 6 | |||||
| Greenwich Hospital | London | 1796 | 6.0 | ||||
| Man Stat Soc | 1796 | 6 | |||||
| Porter | London | 1840-50 | |||||
| Porter | Birmingham | 1840-50 | |||||
| Manchester | 1859 | 6 ½ | |||||
| Greenwich Hospital | London | 1860 | 6.1 | ||||
| Purdy | Norfolk etc | 1861 | 7 ½ | ||||
| FACTOR | 1770-1860 | 1.75 x | 1770-1860 | 2.0 x |
Cheese (inferior)
| Young | 1770 | 3 ½ to 5 | |||||
| Greenwich Hospital | London | 1770 | 3.5 | ||||
| Davies | 1787 | 4 ½ to 5 | |||||
| Greenwich Hospital | London | 1787 | 4 | ||||
| Man Stat Soc | 1790 | 4 | |||||
| Eden | 1796 | 6 | |||||
| Greenwich Hospital | London | 1796 | 5.5 | ||||
| Porter | London | 1840-50 | 6 | ||||
| Porter | Birmingham | 1840-50 | 6 | ||||
| Manchester | 1859 | – | |||||
| Greenwich Hospital | London | 1860 | 8 | ||||
| Purdy | Norfolk etc | 1861 | 8 | ||||
| FACTOR | 1770-1860 | 2.0 x | 1770-1860 | 2.3 x |
Butter (fresh)
| Young | 1770 | 9 to 10 ½ | |||||
| Greenwich Hospital | London | 1770 | 6 | ||||
| Davies | 1787 | 10 to 12 | |||||
| Man Stat Soc | 1790 | – | |||||
| Eden | 1796 | 10 to 12 | |||||
| Greenwich Hospital | London | 1796 | 9 | ||||
| Man Stat Soc | – | ||||||
| Porter | London | 1840-50 | 10 | ||||
| Porter | Birmingham | 1840-50 | 11 to 12 | ||||
| Manchester | 1859 | 13 | |||||
| Greenwich Hospital | London | 12 | |||||
| Purdy | Norfolk etc | 1861 | 13 | ||||
| FACTOR | 1770-1860 | 1.3 x | 1770-1860 | 2.0 x |
The 1860 values (1770 = 100) for the individual components are:
| Cereals | 143 |
| Meat | 197 |
| Potatoes | 133 |
| Cheese | 229 |
| Butter | 203 |
| Sugar | 130 |
| Tea | 82 |
| Milk | 127 |
| Beer | 110 |
| Rent | 178 |
| Fuel | 166 |
| Clothing | 40 |
Average inflation 1770-1860, agricultural = 139.3, non-agricultural = 150.3.
These compare with the index of 187 for industrial wages.
Curiously, the prices of meat, cheese and butter increase more than the wages, although agricultural wages were the major component of their costs.
Clothing reduces significantly, because there was an impressive improvement in productivity.
