We now present the average earnings in shillings in each non-agricultural occupation, following the tables and graphs in previous sections.
The earnings per occupation are then weighted by numbers of employees, to give an average for the country in each year.
| Cotton | Labourer | Boot | Seamst | Miners | Builders | Tailors | Woollens | |
| shoe | Coal | |||||||
| 1770 | 8.0 | 7.0 | 10.0 | 6.0 | 7.0 | 13.0 | 21.0 | 12.0 |
| 1775 | 9.6 | 7.0 | 10.0 | 6.0 | 7.0 | 13.0 | 21.0 | 13.0 |
| 1780 | 11.3 | 7.3 | 10.0 | 6.0 | 7.0 | 14.0 | 21.0 | 14.0 |
| 1785 | 13.8 | 7.6 | 10.0 | 7.0 | 7.0 | 14.0 | 21.0 | 16.0 |
| 1790 | 18.3 | 8.1 | 12.0 | 7.0 | 7.0 | 14.0 | 21.0 | 18.0 |
| 1795 | 29.4 | 9.2 | 12.0 | 8.0 | 7.5 | 17.0 | 25.0 | 15.0 |
| 1800 | 24.4 | 10.9 | 12.0 | 8.0 | 8.0 | 18.0 | 25.0 | 13.0 |
| 1805 | 22.0 | 12.1 | 12.0 | 10.0 | 10.0 | 20.0 | 27.0 | 15.6 |
| 1810 | 16.7 | 13.9 | 12.0 | 10.0 | 10.0 | 25.0 | 33.0 | 17.6 |
| 1815 | 16.2 | 14.1 | 13.0 | 10.0 | 11.5 | 25.0 | 30.0 | 18.8 |
| 1820 | 11.6 | 12.4 | 13.0 | 10.0 | 12.5 | 25.0 | 25.0 | 16.0 |
| 1825 | 12.4 | 12.4 | 13.0 | 10.0 | 12.5 | 24.0 | 25.0 | 16.2 |
| 1830 | 10.8 | 12.2 | 13.0 | 9.0 | 12.0 | 27.0 | 20.0 | 16.2 |
| 1835 | 12.6 | 12.0 | 13.0 | 9.0 | 11.0 | 27.0 | 20.0 | 16.4 |
| 1840 | 15.5 | 12.2 | 13.0 | 8.0 | 11.5 | 27.0 | 15.0 | 15.2 |
| 1845 | 20.4 | 12.4 | 12.5 | 8.0 | 11.5 | 27.0 | 15.0 | 16.7 |
| 1850 | 19.7 | 12.6 | 13.5 | 7.0 | 12.5 | 28.0 | 15.0 | 16.1 |
| 1855 | 25.7 | 13.1 | 14.5 | 7.0 | 17.5 | 30.4 | 15.0 | 18.4 |
| 1860 | 32.9 | 13.7 | 16.0 | 7.0 | 18.4 | 32.8 | 15.0 | 20.4 |
| 1770-1815 | 2.02 | 2.01 | 1.30 | 1.67 | 1.64 | 1.92 | 1.43 | 1.56 |
| 1815-1860 | 2.04 | 0.97 | 1.23 | 0.70 | 1.60 | 1.31 | 0.50 | 1.09 |
| 1770-1850 | 4.14 | 1.95 | 1.60 | 1.17 | 2.62 | 2.53 | 0.71 | 1.70 |
| Silk | Worsted | Iron | Cutlery | Hosiery | Lace | Rail | Average | ||
| Manuf | |||||||||
| 1770 | 8.0 | 10.0 | 20.0 | 20.0 | 10.0 | 6.0 | 10.1 | ||
| 1775 | 9.0 | 10.0 | 20.0 | 20.0 | 10.0 | 6.0 | 10.4 | ||
| 1780 | 9.0 | 10.5 | 20.0 | 20.0 | 10.0 | 7.0 | 11.0 | ||
| 1785 | 10.0 | 11.0 | 20.0 | 20.0 | 10.0 | 7.0 | 11.5 | ||
| 1790 | 11.0 | 11.0 | 20.0 | 20.0 | 10.0 | 7.0 | 12.5 | ||
| 1795 | 11.0 | 10.5 | 20.0 | 20.0 | 13.0 | 8.0 | 15.1 | ||
| 1800 | 15.0 | 10.5 | 25.0 | 25.0 | 13.0 | 8.0 | 15.4 | ||
| 1805 | 15.0 | 16.0 | 25.0 | 25.0 | 13.0 | 8.0 | 16.0 | ||
| 1810 | 15.0 | 21.0 | 25.0 | 30.0 | 13.0 | 8.0 | 16.0 | ||
| 1815 | 15.0 | 25.5 | 25.0 | 30.0 | 7.0 | 8.0 | 16.5 | ||
| 1820 | 15.0 | 21.0 | 30.0 | 30.0 | 7.0 | 8.0 | 15.5 | ||
| 1825 | 15.0 | 21.0 | 30.0 | 30.0 | 7.0 | 8.0 | 15.7 | ||
| 1830 | 12.0 | 20.0 | 30.0 | 35.0 | 7.0 | 8.0 | 24.0 | 15.7 | |
| 1835 | 12.0 | 15.8 | 30.0 | 30.0 | 7.0 | 8.0 | 24.0 | 16.0 | |
| 1840 | 11.0 | 16.0 | 30.0 | 30.0 | 7.0 | 8.0 | 22.5 | 16.0 | |
| 1845 | 11.0 | 13.5 | 31.0 | 31.0 | 7.0 | 8.0 | 22.5 | 16.3 | |
| 1850 | 10.0 | 12.0 | 33.0 | 33.0 | 10.0 | 9.0 | 24.5 | 16.7 | |
| 1855 | 11.0 | 12.5 | 34.0 | 34.0 | 12.0 | 9.5 | 24.5 | 18.4 | |
| 1860 | 11.0 | 12.5 | 36.0 | 33.0 | 14.0 | 10.0 | 23.0 | 19.2 | |
| 1770- 1815 | 1.88 | 2.55 | 1.25 | 1.50 | 0.70 | 1.33 | 1.63 | ||
| 1815- 1860 | 0.73 | 0.49 | 1.44 | 1.10 | 2.00 | 1.25 | 1.16 | ||
| 1770- 1850 | 1.38 | 1.25 | 1.80 | 1.65 | 1.40 | 1.67 | 1.90 | ||
Numbers employed in each occupation (thousands, estimated):
| Cotton | Labourer | Boot shoe | Seamstr | Miners Coal | Builders | Tailors | Woollens | |
| 1770 | 150 | 140 | 90 | 45 | 40 | 118 | 50 | 100 |
| 1775 | 150 | 145 | 93 | 45 | 42 | 122 | 51 | 100 |
| 1780 | 150 | 150 | 96 | 50 | 45 | 127 | 53 | 100 |
| 1785 | 150 | 157 | 100 | 50 | 50 | 132 | 55 | 80 |
| 1790 | 168 | 165 | 105 | 50 | 53 | 140 | 58 | 60 |
| 1795 | 200 | 172 | 110 | 55 | 56 | 146 | 60 | 50 |
| 1800 | 247 | 180 | 115 | 58 | 61 | 153 | 63 | 52 |
| 1805 | 274 | 193 | 125 | 60 | 73 | 164 | 67 | 66 |
| 1810 | 300 | 206 | 132 | 65 | 85 | 180 | 72 | 70 |
| 1815 | 334 | 223 | 147 | 75 | 84 | 200 | 78 | 72 |
| 1820 | 366 | 240 | 153 | 80 | 89 | 220 | 85 | 76 |
| 1825 | 413 | 259 | 165 | 80 | 95 | 240 | 91 | 81 |
| 1830 | 425 | 278 | 177 | 95 | 102 | 260 | 98 | 86 |
| 1835 | 408 | 306 | 197 | 100 | 114 | 300 | 107 | 91 |
| 1840 | 385 | 380 | 210 | 150 | 127 | 350 | 117 | 96 |
| 1845 | 333 | 360 | 240 | 250 | 150 | 400 | 124 | 106 |
| 1850 | 374 | 340 | 275 | 340 | 183 | 440 | 132 | 116 |
| 1855 | 398 | 320 | 300 | 350 | 210 | 440 | 134 | 126 |
| 1860 | 437 | 309 | 330 | 360 | 240 | 450 | 136 | 137 |
| Silk | Worsted | Iron | Cutlery | Hosiery | Lace | Railways | Total | ||
| Manuf | |||||||||
| 1770 | 46 | 20 | 30 | 10 | 30 | 90 | – | 959 | |
| 1775 | 46 | 20 | 30 | 11 | 30 | 100 | – | 985 | |
| 1780 | 48 | 20 | 30 | 12 | 30 | 110 | – | 1,021 | |
| 1785 | 48 | 20 | 35 | 12 | 40 | 120 | – | 1,048 | |
| 1790 | 50 | 20 | 50 | 13 | 40 | 130 | – | 1,102 | |
| 1795 | 50 | 20 | 55 | 13 | 45 | 140 | – | 1,172 | |
| 1800 | 52 | 20 | 60 | 14 | 50 | 150 | – | 1,275 | |
| 1805 | 52 | 20 | 65 | 15 | 55 | 150 | – | 1,379 | |
| 1810 | 55 | 20 | 70 | 16 | 60 | 150 | – | 1,481 | |
| 1815 | 55 | 22 | 75 | 18 | 60 | 150 | – | 1,593 | |
| 1820 | 60 | 24 | 80 | 22 | 62 | 140 | – | 1,697 | |
| 1825 | 60 | 26 | 85 | 28 | 64 | 120 | – | 1,807 | |
| 1830 | 65 | 28 | 90 | 33 | 64 | 110 | 10 | 1,921 | |
| 1835 | 70 | 30 | 95 | 38 | 70 | 110 | 20 | 2,056 | |
| 1840 | 80 | 40 | 100 | 41 | 80 | 90 | 30 | 2,276 | |
| 1845 | 90 | 50 | 120 | 41 | 100 | 90 | 40 | 2,494 | |
| 1850 | 111 | 75 | 150 | 51 | 130 | 80 | 55 | 2,852 | |
| 1855 | 105 | 100 | 180 | 51 | 140 | 80 | 80 | 3,014 | |
| 1860 | 101 | 125 | 190 | 51 | 150 | 75 | 100 | 3,191 | |
These numbers are taken from the individual sources per industry. The figures for 1840, 1850, 1860, have been revised against the Census data. In the less documented cases, the numbers from 1840 are projected back to the earlier years.
Combining the average earnings of agricultural labourers (other chapter) and non-agriculture workers, using the number employed as the weighting, we have:
| Shillings week | Shillings week | Shillings week | |
| Agr Lab | Non Agr | All Occupations | |
| 1770 | 6.5 | 9.6 | 8.3 |
| 1775 | 6.6 | 10.0 | 8.5 |
| 1780 | 7.0 | 10.5 | 9.0 |
| 1785 | 7.0 | 11.1 | 9.4 |
| 1790 | 7.4 | 12.2 | 10.2 |
| 1795 | 8.9 | 14.7 | 12.4 |
| 1800 | 9.3 | 14.8 | 12.7 |
| 1805 | 10.6 | 15.1 | 13.5 |
| 1810 | 11.3 | 15.8 | 14.3 |
| 1815 | 12.1 | 15.7 | 14.5 |
| 1820 | 11.7 | 14.7 | 13.7 |
| 1825 | 10.9 | 14.7 | 13.5 |
| 1830 | 10.4 | 14.7 | 13.3 |
| 1835 | 10.2 | 14.9 | 13.4 |
| 1840 | 11.0 | 14.8 | 13.7 |
| 1845 | 9.5 | 15.1 | 13.5 |
| 1850 | 9.5 | 15.5 | 13.9 |
| 1855 | 10.9 | 16.9 | 15.4 |
| 1860 | 11.0 | 18.0 | 16.3 |
| 1770-1815 | 1.86 | 1.64 | 1.76 |
| 1815-1860 | 0.91 | 1.14 | 1.12 |
| 1770-1860 | 1.69 | 1.87 | 1.97 |
It is counter-intuitive, but arithmetically correct, that the increase 1770-1860 in the average of “agricultural” and “non-agricultural” is greater than the increases in the constituent parts. The explanation is that in 1770, 65 % of the workers in our sample were agricultural, and in 1860, only 35 %. Thus the curve of the average “gravitates” towards the “non-agricultural” curve.

As a final input for the movements of wages, we convert to pounds per year for the sum of agricultural and non-agricultural, and reduce by 10 % to take probable lost working days into account. This is then compared with the data of Feinstein from his work of 1998.
POUNDS PER YEAR, PRESENT STUDY,
REDUCED BY 10 % FOR LOST WORKING DAYS
| Average wage | Average wage | |
| Pounds pa | Pounds p a | |
| Present study | Feinstein 1866 42 | |
| 1770 | 19.3 | 18.0 |
| 1775 | 19.9 | 18.2 |
| 1780 | 21.1 | 19.4 |
| 1785 | 22.0 | 19.5 |
| 1790 | 24.0 | 21.1 |
| 1795 | 29.0 | 25.7 |
| 1800 | 29.8 | 31.4 |
| 1805 | 31.7 | 35.0 |
| 1810 | 33.3 | 37.3 |
| 1815 | 33.9 | 36.0 |
| 1820 | 32.1 | 33.0 |
| 1825 | 31.5 | 31.1 |
| 1830 | 31.1 | 30.1 |
| 1835 | 31.3 | 30.1 |
| 1840 | 32.0 | 32.6 |
| 1845 | 31.7 | 32.4 |
| 1850 | 32.6 | 32.4 |
| 1855 | 36.0 | 37.7 |
| 1860 | 38.1 | 38.2 |
| 1866 | 42.0 | |
| 1770-1815 | 1.76 | 2.00 |
| 1815-1860 | 1.12 | 1.06 |
| 1770-1860 | 1.97 | 2.13 |
a
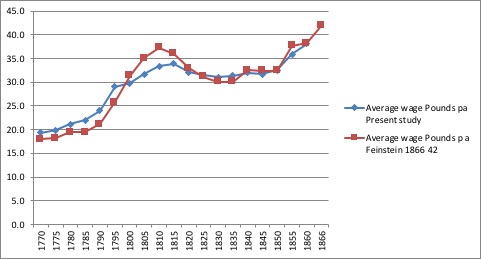
The figures correspond fairly closely to the Feinstein values, and to those of some of his sources, which means that we are both reporting the same real economic conditions of 1770-1860:

(Feinstein, 1998, Wage-earnings in Great Britain during the Industrial Revolution, p. 199)
The only difference which has importance for our conclusions is that for the years 1770-1795. This study is more optimistic about the earnings, and has a value of 8.3 shillings for 1770 (6.5 for agricultural, 9.6 for non-agricultural), while Feinstein has 7.6 shillings average. Arthur Young has 9.5 shillings for manufacturing in the North, 8.5 for manufacturing in West/East/South, and 7.0 for agricultural labourers in West/East/South. This study is closer to Arthur Young. This may well be due to a different selection of “typical occupations”.
But more importantly for our general conclusions, the movements for Feinstein’s figures for 1770 to 1795 are not consistent with the real happenings of the day. He has an increase from 7.6 to 11.0 shillings, which is + 45 %; this did not happen in any of the industries, and was much above the food inflation. Thus his figure of increase in nominal earnings from 1770 to 1860 may well be too high.
The increase of 45 % from 1795 to 1810 according to Feinstein is also not very probable, as not one of the constituent industries showed this movement. The figure of 1855, which gives a difference against 1850 of 16 % is exaggerated, but the datum for 1860, of 18 % against 1850, may well be true.
Before we comment the figures which result from this calculation, we should revise the level of probability of the base numbers. It is important to note that as the data come from different sources for each occupation, and in general are copied from one series of yearly (or 5-yearly) data from one source, it is very unlikely that there would be any systematic error; from the theory of statistics we have that the probable error in the weighted total should be considerably less than the errors in the individual lines.
The figures for “agricultural labourers” and for “cotton” – which together make 30 % of the weighting – are as exact as they can be made. The “agricultural labourers” data come from a large number of sources, including Arthur Young, parliamentary commissions, “The Farmers Magazine”, and Mr. Purdy, director of the statistical department of the Poor Law Administration, and are totally consistent with another. The series for “cotton” comes from Mr. George Wood in his book on the History of Wages in the Cotton Industry, where he presents an average calculation per year, based on the total content of his book. The main cause of doubt in the table above would be in the calculations for boot and shoe makers and the tailors, where we do not have good data for the division into “professional” and “price-competing” workers, and their respective average incomes.
The average trend of nominal non-agricultural wages from 1800 to 1850 was to remain constant. This is easily explained, as the living costs did not increase, and thus the workers did not have much arguments when they wanted to negotiate an increase with the owners. In individual industries, there were other factors which had an effect on the wages, for example, “combinations”, unions, and “houses of call” of the workmen, introduction of machines with high capacity and ease of use, transfer of work to women and children, and division of labour and greater specialization.
Additional to the figures evaluated above, there are two special cases. Firstly, in the cotton industry, there were general increases (net of increase in food costs) of 50 % or more, when the men and women changed to factory work, that is from 1780 to 1810. Secondly, in the period 1840 to 1860, there came into being a number of new well-paid occupations, especially for skilled mechanics and administrators, which are not included in the table above (only “railways”).
The increase in earnings for 1855 and 1860 is not what it seems. There was also a considerable increase of the living costs during the decade of the 1850’s.
As an additional check to the figures, we should revise the situation calculated for the whole country at 1860 (number of persons, and total of weekly income, for each occupation), against some contemporary source from 1860. What we actually have is a detailed report written in 1867, with number of persons and income levels for 1867. This is a book written by Leone Levi, Wages and Earnings of the Working Classes; with some facts illustrative of their economic condition, drawn from authentic and official sources.
Mr. Levi was a jurist and statistician, with a doctorate in Political Science from the University of Tübingen, and he researched and wrote the book at the request of M. T. Bass, who was a liberal Member of Parliament, and owner of Bass Breweries. He says that he collected the data from a number of publicly available sources, but in many cases by direct request to the employers and the employed. The book has about 120 pages of detailed information, classified by occupation.
See the pages reproduced two pages below, with the totals over the country; two pages are exhibited showing the totals of weekly incomes per occupation, and the book also has two more pages showing the number of persons per occupation. The numbers given by Mr. Levi include Ireland, so that an adjustment – based on the detailed text – was made in the table calculated by this author, to show only England + Wales + Scotland.
The following two tables are: a) the wages in each industry/occupation, corresponding to this investigation for the date of 1860, b) Mr. Levi’s data for 1867, reduced by the quantities referring to Ireland.
| Occupation | Number of Persons 1860 | Av. Income (sh./week) 1860 | Total Income (million sh./week) | Per cent of 16 occups. |
| Agricultural labourer (*) | 1,026,000 | 11 | 11.3 | 23.5 % |
| Cotton, calico, manufacture, printing | 437,000 | 11 | 4.8 | 6.5 % |
| Labourer | 309,000 | 14 | 4.3 | 5.8 % |
| Boot and shoe maker | 330,000 | 16 | 4.9 | 6.9 % |
| Milliner, dressmaker, seamstress | 360,000 | 7 | 2.5 | 3.1 % |
| Coal miner | 240,000 | 18 | 4.3 | 5.8 % |
| Carpenter, joiner, mason, bricklayer | 450,000 | 33 | 14.8 | 20.1 % |
| Tailor | 136,000 | 15 | 2.0 | 2.7 % |
| Woollen cloth manufacture | 137,000 | 20 | 2.7 | 3.6 % |
| Silk manufacture | 101,000 | 11 | 1.1 | 1.5 % |
| Worsted manufacture | 125,000 | 12 | 1.6 | 2.2 % |
| Iron manufacture, moulder, founder | 190,000 | 36 | 6.8 | 9.2 % |
| Cutlery | 51,000 | 33 | 1.7 | 2.3 % |
| Hose (stocking) manufacturer | 150,000 | 14 | 2.1 | 2.8 % |
| Lace manufacture | 75,000 | 10 | 0.7 | 0.9 % |
| Railways | 100,000 | 23 | 2.3 | 3.1 % |
| Total | 4,217,000 | 16.3 | 67.9 | 100.0 % |
Occupation | Number of Persons 1867 | Av. Income (sh./week) 1867 | Total Income (million sh./week) | Per cent of 16 occups. |
| Agricultural labourers (*) | 1,060,000 | 12 | 12.7 | 21.6 % |
| Cotton | 558,000 | 12 | 6.7 | 8.3 % |
| Builders | 480,000 | 27 | 13.0 | 16.1 % |
| Tailoresses and Dressmakers | 451,000 | 9 | 4.1 | 5.1 % |
| Boot and Shoe Makers | 352,000 | 17 | 6.0 | 7.4 % |
| Coal Mining | 288,000 | 17 | 4.9 | 6.1 % |
| Woollen Manufacture | 249,000 | 14 | 3.5 | 4.3 % |
| Hosiery and Lace | 230,000 | 11 | 2.5 | 3.1 % |
| Hardware | 216,000 | 21 | 4.5 | 5.6 % |
| Railways | 200,000 | 23 | 4.6 | 5.7 % |
| Iron | 149,000 | 25 | 3.7 | 4.6 % |
| Silk Manufacture | 122,000 | 8 | 1.0 | 1.2 % |
| Machines and Tools | 121,000 | 21 | 2.5 | 3.1 % |
| Tailors | 120,000 | 19 | 2.3 | 2.8 % |
| Mining other | 100,000 | 18 | 1.8 | 2.2 % |
| Linen | 78,000 | 12 | 2.3 | 2.8 % |
| Total | 4,774,000 | 15.9 | 76.1 | 100.0 % |
(*) only adult male labourers, working outdoors; does not include farmers and cottagers, with their wives and children; does not include indoor farm servants
We note that the numbers of persons are a little higher in this study than according to Mr. Levi. This is because he includes all the people working even in small auxiliary tasks, and thus including men, women, and young persons; the present investigation refers to adults working in the principal tasks. Mr. Levi’s table includes “hardware”, “machines and tools”, and “mining” (other than coal), which had become more important from by 1867.
The average wage over these 16 occupations differs by only 16.3 shillings per week (42.3 pounds per year) against 15.9 shillings (41.3 pounds). This small difference is actually the net position of four general concepts:
- Increase in wage levels from 1860 to 1867 of about 10 %;
- Replacement by new industries with higher general wage levels, than those cancelled;
- Mr. Levi does not include data for general labourers, which would decrease the average;
- Mr. Levi’s average figures include the auxiliary work by women and young persons.
(Levi, 1867, pp. 16-17)
In general, the data in this study are very close to the numbers collected by Mr. Levi.
A revision of these figures of wages per industry, against some tables in books or reports which give a number of wages at a given date, gives a general agreement
| Sources: Arthur Young, “Travels in …” Frederick Eden, “State of the Poor” Richard Philips, “Book of Trades” Jelinger Symonds, “Arts and Artisans at Home and Abroad” Statistical Committee of the Town Council, Leeds, “Report on the Condition of the Town of Leeds and of its Inhabitants, October 1839” David Chadwick, “On the Rate of Wages in Manchester and Salford, and the Manufacturing Districts of Lancashire, 1839-59” |
There is also a list of wages at about 1850 for some 200 actividades from “Labour and the Poor in England and Wales 1849-1851, Letters to the Morning Chronicle …”, Appendices 1 and 2.
