But the weekly wages of the labourer do not show the totality of his yearly income. Firstly, there are increased payments in the harvest month, which were generally twice the normal weekly rate; however, the wife and children had to work as well, without own payment. The hours were very long, particularly in summer; “in the evening, you had to keep working until you could see a star”. All the men in the farm or village had the possibility to earn this money, because the farmers at that moment never had enough hands. The farmer brought the food and beer/cider out to the fields, without charge.
The second element was the “summer wage”, which was generally one shilling more than the winter wage, and was paid during four months.
Then there were the task payments for special jobs, such as cutting hedges, excavating ditches, and especially thrashing wheat. These “tasks” usually had an equivalent, calculated to a daily rate, of about 130 % to 160 % of the basic wage. On at least the larger farms, the task activities made up more than the half of the days worked.
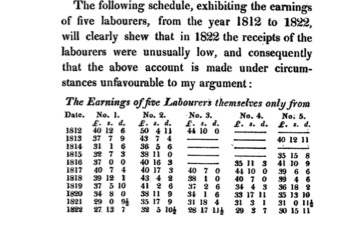
As to the effect of the task payments on the total real earnings of the man (not including the wife and children), we can take the data from the Rev. C. D. Brereton, Rector of Little Massingham, Norfolk, who wrote two well-researched books in 1824: A Practical Enquiry into the Number, Means of Employment, and Wages of AgriculturalLabourers, andObservations on the Administration of the Poor Laws in Agricultural Districts.
It is to be noticed that the weekly winter wage was about 8 shillings, so that – even including the increase for summer wages, and the harvest month – the yearly income should be around 24 Pounds.
In the first place we have a list of 5 day labourers, with their total earnings (only the men, not the wife and children) in the years 1812 to 1822. We see that the earnings are of the order of 35 Pounds, and thus the improvement in earnings due to the task-work was about + 52 %.
(Observations on the Administration of the Poor Laws …., p. 90)
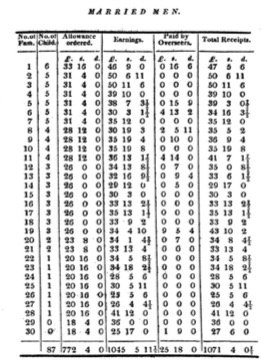
The next table shows the earnings of all the married labourers in the parish. The real wages paid by the farmer are 1045 Pounds, the differences paid in some cases by the parish Overseers are 26 Pounds, and the total incomes of the labourers are 1071 Pounds. Since there are 30 families, the average incomes are 26 Pounds.
(Observations on the Administration of the Poor Laws …., p. 87)
There are also resident in the parish, 19 single young men, sons of the married men above, with own earnings (no parish payments required) of 380 Pounds, that is, an average of 20 Pounds each.
Further, 6 families of “aged and infirm” with incomes – including parish payments – of 125 Pounds in total.
The next table shows us the earnings for each week, divided into those from “day work” and those from “piece work”. (According to the Rev. Brereton in another section, seven-eighths of the work in the parish is done under the régime of “piece work”.)
(Practical Enquiry into the Number of Labourers ……, p. 107)
We also have from the rector, an analysis of the total payments to all the labourers in each month of the year:
(ibid, p. 104)
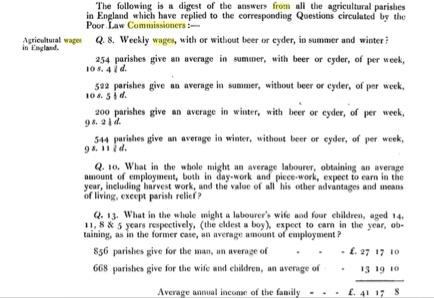
The income of the agricultural families was considerably increased by the earnings of the wife and children. We have a general Report for England from His Majesty’s Commissioners for Inquiring into the Administration and Practical Operation of the Poor Laws, known as the Rural Queries from 1834 (vols. xxx-xxxiv).
We note that the extra earnings from family are + 61 %.
Another study shows us the effect of the employment of children on the total income of the family.
Families
Condition
Average Number of Children
Average Annual Income per Family L s d
Average Weekly Income per Family s d
36
Single men
–
25 1 4
9 10
64
No children at home
–
30 12 10
11 9
166
All children under 10
2.9
32 13 2
12 7
120
One child above 10
3.7
35 9 0
13 7
92
Two children above 10
4.9
40 10 1
15 7
44
Three children above 10
5.8
45 11 9
17 6
15
Four children above 10
7.0
50 18 6
19 7
1
Five children above 10
–
42 13 0
16 5
1
Six children above 10
–
52 0 0
20 0
539
Total
35 10 0
Average weekly wages 9s. 10d.; 1 bushel = 6s 6d.; Extra income from family = + 39 %
(Kay, James Phillips, Earnings of Agricultural Labourers in Norfolk and Suffolk; Journal of the Statistical Society of London, Vol. 1, 1838, pp. 179-183)
We have a report from Mr. Purdy with numbers from a detailed investigation of 66 families (295 individuals) in Kent and Sussex in 1837. The yearly income from normal payments was 18 pounds per family (corresponds to 7 shillings per week), but additionally there is 26 pounds per family (10 shillings per week) from task work and other jobs. According to Mr. Purdy, the figure of 44 pounds per year for the earnings of an average family, would be valid up to 1860 (Purdy, 1860, p. 354).
“Within the last thirty years not more than 30 or 40 acres of wheat were grown in this parish, and now there are between 300 and 400 acres. The growth of this corn favourably affects the condition of the peasantry, by supplying a large quantity of gleaning as well as work. The thirty families belonging to this parish have the gleaning of three or four hundred acres of wheat, and many of the families collect from 8 to 12 and even 16 bushels. The earnings of the women and children by this means have often amounted to more than the earnings of the labourer himself in harvest, when his wages are the highest. Since the commencement of the present century, the increased production of wheat has been enormous.”
(Brereton, 1824, A Practical Inquiry…., p. 79)
“I have examined the earnings of labourers in several districts, and they accord in a considerable degree with what might be expected form their number, and the sum expended in wages. I have also drawn out tables of their earnings for a series of years, during the present century, in which it appears that the annual earnings of labourers, exclusive of the earnings of their families, exceed on average £ 40 per annum. This is especially the case when they are constantly employed by the same masters, as they would generally be, if master and servant were not set at variance by the present inquisitorial and official interference.”
(Brereton, 1824, A Practical Enquiry…., p. 111)
It would appear, then, that the living conditions of the agricultural labourers from 1800 to 1830 were not affected by the Industrial Revolution, and that their incomes were agreed with their employers. The main change was: (positive) the considerable reduction in the price of cotton clothing.
Monetary system Pounds (£ or L.), shillings (s.), pennies or pence (d.) 1 Pound = 20 shillings, 1 shilling = 12 pence Wage of farm labourer = 9 to 12 shillings per week Wage of male worker in textile factory = 20 to 30 shillings per week Dry weight measures 1 bushel wheat = 60 lb., 1 quarter = 480 lb. Price of 4 pound loaf of wheaten bread = 6 to 8 pence Energy supplied by 4 pound loaf = 4,500 calories Price of butcher’s meat = 4 to 6 pence per pound
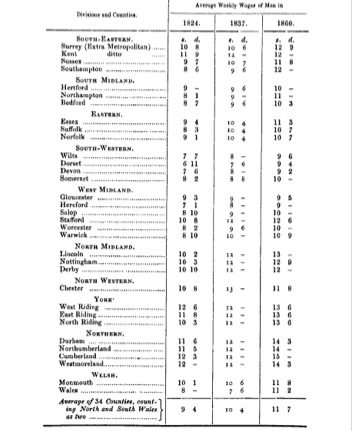
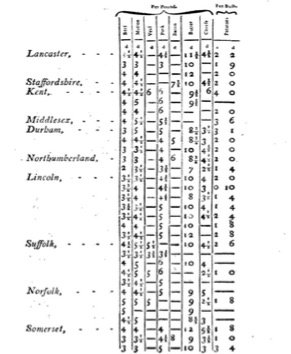
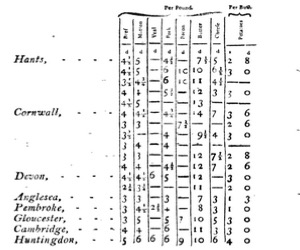
We have a number of reports on the winter weekly wages for farm labourers in each of the counties in England:
1824 Abstract of the Report of the Select Committee on Labourers’ Wages
1832 Report from His Majesty’s Commissioners for Inquiring into the Administration and Practical Operation of the Poor Laws, Rural Queries, session 1834, vols. xxx-xxxiv [the data are from 1832]
Resumed in: Yamamoto, Chiaki, Men’s Unemployment and Job Opportunities for Women: an Analysis of the 1834 Poor Law Report; Economic History Society Conference, 2010, Durham; http://www.ehs.org.uk/dotAsset/72944590-f0b9-4d44-8a62-02e1b681e142.pdf; Figure 7, Agricultural labourers’ wages in England (1832), based on the Poor Law Report (s. / week), p. 37
1833 Select Committee on Agriculture: House of Commons, With the Minutes of Evidence Taken Before Them and an Appendix and Index: Ordered to be Printed 28 Aug. 1833 [answers by individual farmers and land agents, referring to their county]
1837 Purdy, Frederick (Principal of the Statistical Section, Poor Law Board, London); On the Earnings of Agricultural Labourers in England and Wales, 1860, Journal of the Statistical Society, Vol. 24, No. 3 (Sep. 1861), http://www.jstor.org/stable/2338485
1850 Agricultural Gazette, The Value of Agricultural Labour, April 27, 1850, pp. 266-267
1850 Caird, Sir James, English Agriculture in 1850-51, Longman, Green, Brown, and Longmans, London, 1852
1860 Purdy, Frederick (Principal of the Statistical Section, Poor Law Board, London), On the Earnings of Agricultural Labourers in England and Wales, 1860; Journal of the Statistical Society, Vol. 24, No. 3 (Sep. 1861) http://www.jstor.org/stable/2338485
1860 Agricultural Gazette, The Value of Agricultural Labour, April 28, 1860, p. 392
1860 Board of Trade, Returns of Wages. pp. 420-423
Following we have a comparison of the different years:
Abstract Wages
Poor Law Report
Select Comm.
Purdy
Agric Gazette
Caird
Purdy
Agric Gazette
Board Trade
1824
1832
1833
1837
1850
1850
1860
1860
1860
Bedford
8.6
9.5
9.5
8.0
9.0
10.0
10.5
Berkshire
8.8
9.6
9.0
7.5
9.0
12.0
Buckingham
8.2
9.8
8.5
8.5
11.0
Cambridge
9.0
10.0
9.0
10.0
10.0
Cheshire
10.7
8.9
9.5
13.0
8.0
11.5
11.0
11.5
Cornwall
8.2
8.4
9.0
9.0
11.0
11.0
Cumberland
12.2
9.3
11.0
12.0
10.5
13.0
15.0
15.0
13.5
Derby
10.8
10.8
12.0
12.0
10.0
12.0
11.0
12.0
Devon
7.8
8.5
8.0
11.0
9.0
11.5
10.0
Dorset
7.0
8.0
7.5
7.0
7.5
9.5
8.0
9.5
Durham
12.5
11.0
12.0
11.0
14.0
13.0
14.0
Essex
9.3
10.2
9.0
10.5
10.0
8.0
11.0
10.0
11.0
Gloucester
9.2
8.8
9.0
8.5
7.0
9.5
10.0
9.5
Hampshire
8.5
10.1
10.0
9.5
8.0
9.0
12.0
10.0
13.0
Hereford
7.0
8.2
9.0
8.0
8.0
9.0
10.0
9.5
Hertford
9.0
10.9
9.5
9.0
9.0
10.0
10.0
10.0
Huntingdon
7.5
12.1
8.0
8.5
11.0
Kent
11.4
12.3
14.0
12.0
9.5
12.0
11.5
12.0
Lancashire
12.2
10.7
13.5
13.5
13.5
15.0
14.0
Leicester
10.0
9.9
10.0
9.0
11.5
13.0
Lincoln
10.2
12.0
12.0
9.0
10.0
13.0
12.0
13.5
Middlesex
11.2
12.1
Monmouth
10.0
10.0
10.5
9.0
11.5
12.0
12.0
Norfolk
9.0
9.7
11.0
10.5
8.0
8.5
10.5
9.0
10.5
Northampton
8.0
9.7
8.0
9.0
8.5
9.0
11.0
12.0
11.5
Northumberland
11.4
10.4
12.0
12.0
11.0
14.0
15.0
14.0
Nottingham
10.2
11.4
13.0
12.0
10.0
10.0
12.5
11.0
12.5
Oxford
8.2
9.2
7.5
9.0
11.0
Rutland
10.8
9.0
11.0
11.5
Shropshire
9.0
8.6
9.0
9.0
10.0
10.0
10.0
Somerset
9.0
7.8
8.5
8.5
7.0
10.0
10.0
10.0
Stafford
10.5
12.5
10.0
12.0
9.5
12.5
10.0
12.5
Suffolk
8.2
9.3
10.5
7.5
8.5
10.5
9.0
11.5
Surrey
10.5
11.6
10.0
10.5
12.0
9.5
13.0
13.0
Sussex
9.5
11.3
9.5
10.5
9.0
10.5
11.5
11.5
11.5
Warwick
8.8
10.4
10.0
8.0
8.5
10.5
11.0
10.5
Westmoreland
10.3
12.0
11.0
14.0
14.0
Wiltshire
7.5
8.7
8.0
8.0
6.5
7.0
9.5
8.5
9.5
Worcester
10.3
9.5
9.0
9.5
8.0
10.0
10.0
10.0
York E Rid
11.7
12.4
12.5
12.0
10.0
12.0
13.5
14.0
York N Rid
10.2
9.7
12.0
10.0
11.0
13.5
14.0
13.5
York W Rid
12.4
10.6
12.0
12.0
10.0
14.0
13.5
14.0
15.0
Average
9.6
10.1
10.4
10.2
9.1
9.6
11.5
11.2
11.7
We notice that Dorset and Wiltshire have much lower wages than the other counties. But in Dorset it was the norm for the farmer to absorb the cost of the cottage rent, and deliver the firewood free. In Wiltshire many labourers had allotments, where they could cultivate potatoes and sometimes wheat.
“What is the state of farming in Dorsetshire?” “In the agricultural districts I think it is very bad; it is bad everywhere. In Dorsetshire there has been less distress than in almost any county in England, from our poor-rates not being so heavy; and I think the system of Dorsetshire, allowing the men their cottages, and giving their potato ground in a field, where we plough and manure it, according to the size of their families, and they get their fuel from the down, the furze (they have an allowance of wheat as well), though we pay them but 7s. a week, I consider it equal to 11s. to them.”
“You include in that a cottage with a piece of garden?” “Yes.”
“Do you mean to say that they pay nothing for their cottages?” “No.”
“They have wood from the copses?” “No, we have no copse in some of the parishes; furze is the principal with us.”
“You think that keeps your poor in a better state than in the neighbouring counties?” “Yes.”
(Select Committee on the State of Agriculture, 1837, Mr. James Taylor, Dorsetshire. Farmer, p. 171)
“That was before the allotment system began?” “It was before it was so general.”
“The allotment system has been carried to a greater extent in Wiltshire than any other county?” “I believe it has.”
“What is the extent in point of quantity of land?” “My rule is never to go beyond a quarter of an acre, if the family be ever so large; that will be sufficient to maintain the largest family in vegetables.”
“Do you include potatoes in vegetables?” “They grow potatoes principally; if they had more it would spoil the character of the man, and make a sort of gardener of him.”
“What quantity of corn do you suppose each of those labourers used to consume before the allotment system was introduced?” “The calculation used to be about a quarter in the twelvemonth.”
“What quantity do they consume now?” “According to my calculation, the consumption is reduced one-third.»
“That, you think, applies pretty much to the agricultural population?” “Yes; I think it has had a considerable effect upon the price of wheat.”
“Is it the case with respect to the labourers in agriculture, where the allotment system does not prevail, on account of potatoes being grown in farmers’ fields?” “It is the case in every county, more or less, but more strongly where the allotment system is introduced.”
“What quantity of potatoes do you conceive a labourer can grow in a quarter of an acre?” “Twenty sacks; that is 60 bushels.”
“Are 60 bushels of potatoes any thing equal to the support of the family of an agricultural labourer?” “Quite sufficient; they tell me they always have plenty if they can grow 20 sacks; that will keep them, and they fatten their pigs with the small potatoes.”
“You do not suppose them to live entirely on potatoes?” “No, certainly not.”
“Do you think the potatoes grown in farmers’ fields have dimished the consumption of wheat?” “No doubt of it; they are so commonly grown by farmers, they are very cheap.”
“Then they have no cause of complaint, if the price of wheat has been diminished by the growth of the potatoes by themselves?” “We know it applies in that way, but then the comforts of the poor are increased.”
“Has the farmer any cause of complaint, if his land produces him as great a profit in potatoes as wheat?” “It is not in general the farmers who grow the potatoes, but other persons who have taken land to grow them.”
“Do not you think that the introduction of Irish bacon among the labourers has tended to decrease the quantity of wheat eaten?” “Yes; the quantities of Irish bacon brought through Wiltshire to the London market and other markets are beyond any thing that can be conceived.”
(Select Commission on the State of Agriculture, 1837, Mr. Robert Hughes, Steward to landowners, Wiltshire, p. 163)
We also have a number of sources for one county or for one farm, but each giving a complete series over 15 or more years:
1815-1840, Essex
G. E. Mingay, Land, Labour and Agriculture, 1700-1920, Appendix 4.1, p. 90, Indices of Agricultural Labourers’ Wages, the Cost of Living and Real Wages, in Essex, 1790-1840
1814-1823, Huntingdon
Report of the Select Committee on Labourers Wages, 1824, Minutes of Evidence, pp. 21-22
1815-1840, Lincolnshire
Richardson, T. L., The Agricultural Labourers’ Standard of Living in Lincolnshire, 1790-1840:Social Protest and Public Order; Fig. 1, p. 4, Agricultural Labourers’ Wages at Stamford and the Cost of Living, 1790-1840
1815-1843, Norfolk
Richard Noverre Bacon, The Report on the Agriculture of Norfolk for which the Prize was awarded by the Royal Agricultural Society of England, 1844, p. 144, The Average Price of Wheat per Coomb received, and Labourers’ Weekly Wages, paid from 1804 to 1844, on a Light-land Farm
House of Commons, Report from the Select Committee to whom the several Petitions complaining of the Distressed State of the Agriculture of the United Kingdom were referred, 1821, p. 53
Brereton, Rev. C. D. (Rector of Little Massingham, Norfolk), Observations on the Administration of the Poor Laws in Agricultural Districts, J. Hatchard and Son, Norwich, 1824, p. 101
1815-1830, Middlesex (Houndslow)
Select Committee of the House of Lords, appointed to consider of the Poor Laws, 1830-1, Minutes of Evidence, Ordered to be Printed, 7th December 1830, p. 109
1815-1823, Cumberland
John Rooke, An Inquiry into the Principles of National Wealth, Balfour and Company, London, 1842, Table I, Part II, p. 432.
1821-1843, Surrey (Limpsfield)
House of Lords, Royal Commission on the Employment of Children, Young Persons, and Women in Agriculture, 1867-9, (quoted in Bowley, 1900, p. 33)
1821-1839, Sussex
Arthur Lyon Bowley, Wages in the United Kingdom in the Nineteenth Century, Cambridge University Press, Cambridge, 1900; Section V: Agricultural Wages in Sussex, Wages contrasted with Earnings, p. 40
These are resumed as follows:
1815
1816
1817
1818
1819
1820
1821
1822
Essex
10.4
9.4
10.0
10.4
10.4
10.4
9.5
8.8
Huntingdon
11.5
11.5
11.5
12.0
11.8
11.5
10.5
7.5
Lincoln
12.0
12.0
12.0
12.0
12.0
12.0
12.0
10.0
Norfolk
10.0
10.0
12.5
10.5
10.5
10.0
9.0
8.0
Northampton
12.0
11.0
12.0
12.0
12.0
12.0
10.0
10.0
Sussex
13.0
13.0
13.0
13.0
13.0
13.0
Somerset
Kent
13.5
13.5
13.5
13.5
13.5
13.5
11.0
11.0
Norfolk
10.0
12.0
12.0
12.0
10.5
10.0
8.0
9.0
Middlesex
15.0
15.0
15.0
15.0
12.0
12.0
10.5
10.0
Cumberland
13.5
12.0
11.8
11.5
11.0
10.5
10.0
9.5
Surrey
14.0
14.0
13.5
12.0
11.0
Sussex
9.0
8.0
Average
12.1
11.9
12.3
12.4
11.9
11.7
10.1
9.3
1823
1824
1825
1826
1827
1828
1829
1830
Essex
8.4
8.4
9.3
9.3
9.3
9.3
9.3
9.3
Huntingdon
8.5
Lincoln
10.0
10.0
12.0
12.0
12.0
12.0
12.0
12.0
Norfolk
9.0
9.0
9.0
10.0
10.0
10.0
10.0
10.0
Northampton
9.0
10.0
11.0
11.0
11.0
11.0
11.0
Sussex
Somerset
Kent
9.5
9.5
13.5
Norfolk
Middlesex
12.0
12.0
12.0
12.0
12.0
12.0
12.0
12.0
Cumberland
9.0
Surrey
10.0
11.0
12.0
12.0
12.0
12.0
12.0
11.0
Sussex
9.0
9.5
9.5
9.5
10.0
10.0
10.0
11.0
Average
9.4
9.9
11.0
10.8
10.9
10.9
10.9
10.9
1831
1832
1833
1834
1835
1836
1837
1838
Essex
9.3
9.3
9.3
9.5
9.5
9.5
9.5
9.5
Huntingdon
Lincoln
12.0
12.0
12.0
10.0
10.0
10.0
10.0
12.0
Norfolk
10.5
10.5
10.0
9.0
9.0
9.0
10.0
11.0
Northampton
Sussex
Somerset
Kent
Norfolk
Middlesex
Cumberland
Surrey
12.0
12.0
12.0
12.0
11.0
11.0
12.0
12.0
Sussex
12.0
11.0
10.0
10.0
10.0
10.0
10.0
10.0
Average
1839
1840
1841
1842
1843
Essex
10.0
10.0
Huntingdon
Lincoln
12.0
12.0
Norfolk
10.5
10.5
10.5
10.0
9.0
Northampton
Sussex
Somerset
Kent
Norfolk
Middlesex
Cumberland
Surrey
13.0
13.0
13.0
13.0
13.0
Sussex
10.0
There are more figures of the same magnitude in: Wilson Fox, A., Journal of the Royal Statistical Society, Vol. 66, No. 2 (Jun., 1903), pp. 273-359
1825-1860 Warwickshire
1825-1860 Hertfordshire
1836-1860 Suffolk
1850-1860 Essex
1825-1860 Wiltshire
1825-1860 Herefordshire
1850-1860 Devon
There is further a list of average wages for England for 1850-1860 in:
Wilson Fox, op. cit., Appendix II, pp. 331-332
1850
1851
1852
1853
1854
1855
1856
1857
1858
1859
1860
9.3
9.2
9.2
9.9
10.7
10.9
11.0
11.0
10.8
10.7
11.0
We have another contemporary source of data, particularly giving movements in wages and living conditions, by counties. In 1833, Parliament decided to investigate and debate the possibility of changing the Corn Laws; these were laws that prohibited the import of corn, unless the domestic price was higher than a certain limit, and thus kept up the price of wheat in England, to the advantage of the landowning classes. To that end, Parliament named a Committee, which summoned a number of land agents, surveyors, tenant farmers, and landowners, from different counties to answer a large number of questions (in total, more than twelve thousand). The main point of the questions was the price of corn and its influence on the financial health of the farming community. But they also asked about the labourers, for example: their income in 1833, their income 10 or 20 years ago, if their living conditions were better or worse, how well did they eat, and if they had a cottage. We may suppose that the answers of the experts were honest, since they were responding in front of a Committee of Parliament, with other experts present (the questions appear to be put with much knowledge of the matter).
The questions were answered with the following content by the great majority of the respondents:
the labourers are divided into two classes, those that have guaranteed employment all the year round, and a smaller number who are not employed in the winter, when there is less work on the farms, as these are “bad workers” or “bad characters”;
15 or 20 years earlier, there was work for all the labourers, all the year round;
the quantity of work available has decreased because the prices earned by the farmer are not enough, and because the Poor Law payments are now too generous (a man with wife and three children can gain as much as a man with employment);
the harvest payments are much higher than the normal weekly wages, and there is also a possibility to earn a higher amount in a given week through “task-work”;
the nominal wages have decreased against the situation of 15 or 20 years before;
the men and families are better off in their daily life, than 15 or 20 years ago (in the case of those with continuous employment), in spite of the decrease in nominal wages;
the cost of clothing (*), and of food has gone down;
more men and women now wear cotton (*);
the men usually eat meat more than once a week, and the other family members eat cheese or bacon, additional to bread or porridge;
many have a cottage, for which they pay a rent to the sub-tenant of the landowner, and a number have land for growing vegetables;
as to the men without employment in the winter, the farmers try to find them small maintenance jobs around the fields, and the parish authorities try to give them work remaking roads, before they are put on the Poor Law payments, or required in the workhouse.
(*) this shows a positive effect of the Industrial Revolution, since the efficiency of the machines made it possible to have much more cotton in the market, and at a lower price.
The basic weekly wages in 1833, and on the previous date of comparison, according to the Report, were:
Region
County
Basic Wage
Basic Wage
Previous date
1833
North-East
N. Riding
21s.
12s. to 13s.
North-West
W. Riding
12s.
Lancashire
12s. to 15s.
Cheshire
9s. to 10s.
Cumberland
14s.
10s. to 12s.
Leicestershire
13s. to 15s.
10s.
Staffordshire
13s.
10s.
Derbyshire
6s.
12s.
Nottinghamshire
18s.
13s.
South-East
Essex
9s.
9s.
Norfolk
11s.
11s.
Hampshire
9s.
Kent
18s. to 21s.
12s. to 15s.
Kent
9s.
13s. to 15s.
Kent
13s. to 15s.
13s. to 15s.
Sussex
12s. to 18s.
9s. to 10s.
Hampshire
9s. to 12s.
Surrey
8s.
12s.
Wiltshire
9s.
8s.
Surrey
8s. to 9s.
7s.
South-West
Worcester
9s. to 10s.
Worcester
10s.
9s.
Somerset
9s.
8s.
Herefordshire
9s.
Somerset
9s.
Northamptonshire
7s. to 9s.
Cornwall
8s. to 10s.
The wages in the column of 1833 are in general lower than those in the previous column; agricultural labourers wages were higher during the French Wars, and up to 1820, as they had an informal compensation for the high wheat prices.
For the period 1824-1860, we have a report of 45 pages by Charles Purdy in 1861 to the Royal Statistical Society, on the Earnings of Agricultural Labourers in England and Wales. Mr. Purdy was Principal of the Statistical Section of the Poor Law Board in London, and thus had access to a large quantity of data about the condition of the poor; he was also later President of the Royal Statistical Society.
The main message of his report was of an increase of the wages of the labourers, and the sufficiency of their incomes to cover their expenses.
(Purdy, 1861, p. 342)
The increase in nominal weekly wages was 10.7 % from 1824 to 1837, 12.1 % from 1837 to 1860, and thus 24.1 % from 1824 to 1860. This was during a period of decrease in the costs of food.
The figures in the column for 1837 are similar to those shown three pages before, taken from the Commission on Agriculture of 1833. The wages in the column of 1860 are similar to those of the Returns of Wages, published by the Secretary of the Board of Trade, pp. 420-423.
From the above pages of data sources, which are consistent with one another, we can draw up a list of probable winter weekly wages (shillings), averaged over all the counties of England, by years from 1815 to 1860:
1815
12.1
1841
11.0
1816
11.9
1842
10.5
1817
12.3
1843
10.0
1818
12.4
1844
9.5
1819
11.9
1845
9.5
1820
11.7
1846
10.0
1821
10.1
1847
10.0
1822
9.3
1848
10.0
1823
9.6
1849
9.5
1824
9.6
1850
9.5
1825
10.9
1851
9.2
1826
10.8
1852
9.2
1827
10.9
1853
9.9
1828
10.9
1854
10.7
1829
10.9
1855
10.9
1830
10.4
1856
11.0
1831
10.3
1857
11.0
1832
10.2
1858
10.8
1833
10.2
1859
10.7
1834
10.2
1860
11.0
1835
10.2
1836
10.2
1837
10.2
1838
11.0
1839
11.0
1840
11.0
The low figures for 1822, 1823, 1824, are not as bad as they seem; in 1822 England had the best wheat harvest since 1779, and the price went down to 4 shillings the bushel.
The above figures per year are simple averages of the numbers per county. A calculation of the average, weighted by agricultural population per county, does not change the figures. One might think that the proportion of the agricultural population per county, as a percentage of the total for England, would have changed during the period, due to different migration movements, but in fact this is not the case:
Persons employed
Agricultural
in agriculture
labourers
Census 1801
Census 1851
Bedford
19,000
1.2%
18,000
1.8%
Berkshire
38,000
2.4%
26,000
2.5%
Buckinghamshire
25,000
1.6%
20,000
1.9%
Cambridge
28,000
1.8%
26,000
2.5%
Cheshire
39,000
2.5%
22,000
2.1%
Cornwall
43,000
2.8%
22,000
2.1%
Cumberland
21,000
1.3%
11,000
1.1%
Derby
32,000
2.1%
12,000
1.2%
Devon
96,000
6.2%
45,000
4.4%
Dorset
28,000
1.8%
20,000
1.9%
Durham
18,000
1.2%
10,000
1.0%
Essex
65,000
4.2%
41,000
4.0%
Gloucester
49,000
3.1%
28,000
2.7%
Hampshire
51,000
3.3%
36,000
3.5%
Hereford
31,000
2.0%
14,000
1.4%
Hertford
21,000
1.3%
24,000
2.3%
Huntingdon
10,000
0.6%
9,000
0.9%
Kent
54,000
3.5%
46,000
4.5%
Lancaster
52,000
3.3%
36,000
3.5%
Leicester
24,000
1.5%
17,000
1.7%
Lincoln
61,000
3.9%
50,000
4.9%
Middlesex
13,000
0.8%
9,000
0.9%
Monmouth
13,000
0.8%
8,000
0.8%
Norfolk
62,000
4.0%
51,000
5.0%
Northampton
29,000
1.9%
26,000
2.5%
Northumberland
23,000
1.5%
14,000
1.4%
Nottingham
24,000
1.5%
20,000
1.9%
Oxford
33,000
2.1%
22,000
2.1%
Rutland
4,000
0.3%
3,000
0.3%
Shropshire
45,000
2.9%
26,000
2.5%
Somerset
61,000
3.9%
39,000
3.8%
Stafford
43,000
2.8%
24,000
2.3%
Suffolk
56,000
3.6%
46,000
4.5%
Surrey
35,000
2.2%
20,000
1.9%
Sussex
39,000
2.5%
37,000
3.6%
Warwick
35,000
2.2%
23,000
2.2%
Westmoreland
12,000
0.8%
4,000
0.4%
Wiltshire
54,000
3.5%
33,000
3.2%
Worcester
39,000
2.5%
16,000
1.6%
York E Rid
32,000
2.1%
19,000
1.8%
York N Rid
44,000
2.8%
19,000
1.8%
York W Rid
56,000
3.6%
36,000
3.5%
1,557,000
100.0%
1,028,000
100.0%
North
297,000
19.1%
171,000
16.6%
Midlands
377,000
24.2%
270,000
26.3%
South West
459,000
29.5%
251,000
24.4%
South East
424,000
27.2%
336,000
32.7%
1,557,000
100.0%
1,028,000
100.0%
Census 1801, p. 451, persons employed in agriculture
Census 1851, Statistics of Counties, p 171 et seq., Farm Labourers
These wage figures are very close to those in: Gregory Clark, Farm Wages andLiving Standards in the Industrial Revolution: England, 1670-1850, Appendix 1, Winter Farm Wages by Year, 1670-1851, pp. 28-29 (converted from pence per day to shillings per week):
With respect to the geographical distribution of the wage levels, the wages were considerably higher in the North, and lower in the South West.
1824
1832
1833
1837
1850
1850
1860
1860
1860
North
11.7
10.4
12.0
12.2
10.7
12.6
13.4
13.9
13.8
Midlands
9.3
10.7
10.4
11.0
8.7
9.1
11.9
11.0
12.1
South West
8.4
8.5
8.6
8.5
8.4
7.1
9.6
10.1
10.0
South East
9.4
10.6
10.8
10.5
8.9
8.9
11.2
10.1
11.3
England
9.5
10.1
10.2
10.3
9.0
9.5
11.3
11.0
11.6
There was not much differentiation in the increase of wages in this period; in the Midlands in 1860 they were 131 % of 1824, and in the other regions around 118 % of 1824.
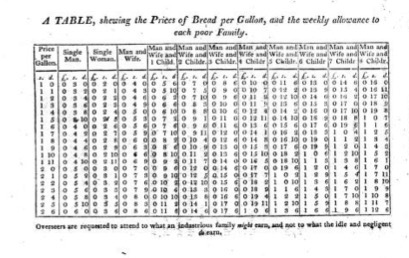
In 1795, the magistrates of Speenhamland, Berkshire, decided on a new method of financially helping the poor in their district. The procedure agreed was to use money received as parish rates, to make up the amount earned by the man in his work (or zero, if he had no work) to a monetary amount defined in terms of the cost of a gallon loaf (2x a quarter loaf). This idea was followed by many other local authorities in England in the following years, but caused an increase in the number of unemployed in the rural areas, since a man with 4 children but without work, could receive as much as a man with work, and thus might well take the decision not to work.
When the Gallon Loaf of Second Flour, Weighing 8lb. 11ozs. shall cost 1s. Then every poor and industrious man shall have for his own support 3s. weekly, either produced by his own or his family’s labour, or an allowance from the poor rates, and for the support of his wife and every other of his family, 1s. 6d.
When the Gallon Loaf shall cost 1s. 4d. Then every poor and industrious man shall have 4s. weekly for his own, and 1s. and 10d. for the support of every other of his family.
And so in proportion, as the price of bread rise or falls (that is to say) 3d. to the man, and 1d. to every other of the family, on every 1d. which the loaf rise above 1s.
The re-expression in quartern loaves per week, as is used in this study, is that the man had a right to 6 quartern loaves per week (supposing the quartern loaf at 8 pence), and the wife and children on average 3 loaves each; for a family with 3 children this would be in total 18 loaves per week.
Following, we have a calculation page (not exactly the same formulae) used in a parish in Berkshire.
(Board of Agriculture / William Mavor; General View of the Agriculture of Berkshire, 1809, p. 418)
The effect was that a man who could not earn enough to pay the expenses for his family, or was unemployed, received a “topping-up” from the parish rates. This system obviously could be abused by dishonest workers.
However, this method was not used much from 1795 to 1815, because there was more work than workers, due to the number of men who had been taken from their agricultural occupations, to serve in the Army or in the Navy. It did cause a number of problems from 1815 onwards.
All of the reports that we have, mention that the majority of the farmworkers’ cottages were in a very bad state, as they were small, badly constructed, and let in the rain and the wind. Below we have a typical cottage of this type.
Rural housing in Middlesex c. 1800. Engraving by J. T. Smith
(John Woodforde, The Truth about Cottages, Tauris, London, 2007, p. 20)
From about 1780 onwards, the landowners began to interest themselves in improving the cottages of the labourers on their estates. (It appears that the aristocratic owners, whose families had owned the land for centuries, and had kept a certain relationship with the workers, were those who made the improvements; the persons who had recently purchased the land as a financial investment, did not bother to make the changes)
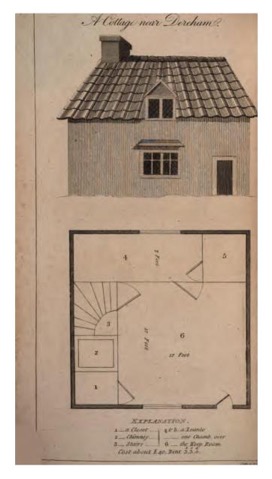
The medium size of well-built labourers’ cottages were as the following drawing (15 feet square to 17 feet square):
(Board of Agriculture / Arthur Young, General View of the Agriculture of the County of Norfolk, 1804, plate facing p. 25)
The best cottages illustrated in the reports, were those built by a clergyman in Devon, who had bought the land some years earlier.
(Board of Agriculture / Charles Vancouver, General View of the Agriculture of the County of Devon, 1808; plate facing p. 96, View of the Bridestowe Cottages)
To show the large-scale effects over time of some of the points we have explained, we have here a calculation of the total earnings of a typical family, which includes:
weekly winter wages of the man;
earnings of the man from summer wages, harvest wages, and task-work;
income of the wife and children from spinning wool, starting from 4 shillings a week for 60 % of the families in 1770-1790, and reducing to zero in 1820;
income of a boy over 10 years old, in 40 % of the families, at 30 % of his father’s wages.
The figures do not include:
problems caused by enclosures;
savings in food costs from gleaning;
savings in food costs of 100 % in the harvest month, as the farmer brought the food out to the fields;
income, or savings in food costs, from having a pig;
savings in food costs, from allotments of potatoes;
(for some Northern regions) lesser cost for cereals, as they ate oats or barley.
Average wage
Average wage
Weekly wage
Bushel wheat
Shillings week
without spinning
Shillings
Shillings
Family
Man
1770
13.5
11.1
6.5
5.3
1775
13.7
11.3
6.6
6.2
1780
14.3
11.9
7.0
3.8
1785
13.5
11.9
7.0
5.1
1790
14.2
12.6
7.4
6.7
1795
16.2
15.2
8.9
9.1
1800
16.7
15.9
9.3
13.8
1805
17.6
17.0
10.6
10.9
1810
18.6
18.2
11.3
12.9
1815
19.6
19.4
12.1
8.0
1820
18.8
18.8
11.7
8.2
1825
17.5
17.5
10.9
8.3
1830
16.7
16.7
10.4
8.0
1835
16.4
16.4
10.2
4.6
1840
17.4
17.4
11.0
8.3
1845
15.1
15.1
9.5
6.3
1850
15.2
15.2
9.5
5.0
1855
17.3
17.3
10.9
9.3
1860
17.5
17.5
11.0
6.8
The figure of 13.5 shillings total family income in 1770, is to be compared with the calculation by Arthur Young for 1771, of 14.5 shillings for a man, wife, boy of 15 years, boy of 10 years, and a small child (average of manufacturers and labourers). A sample of four families gave that the average expense (45 lb. bread, 90 oz. cheese, little meat) was 13.0 shillings.
(Young, The Farmer’s Letters to the People of England, 1771, pp. 198-202)
The income figures are compared against the cost of a bushel of wheat, which was taken to be the required amount for a large family. This is not a completely useful parameter, as:
about 30 % of the population of England changed from eating oats, barley, or rye, to wheat in this period, which increased the food costs of those families by approx. 50 %;
on the other hand, the consumption of potatoes started around 1770, and at the end of the period, probably 25 % of the volume of carbohydrates eaten was of potatoes, which a unit price close to 30 % of that of wheat.
We see that the total earnings of the family remained the same from 1770 to 1790 (before the price and income inflation in 1796) although the man’s weekly wages increased, as did the price of wheat. The arithmetical effect of the loss of the wife’s earnings from spinning was to reduce the total income of the family in shillings, but simultaneously to increase the average income per person in agricultural families (the divisor – the number of persons earning – goes down).
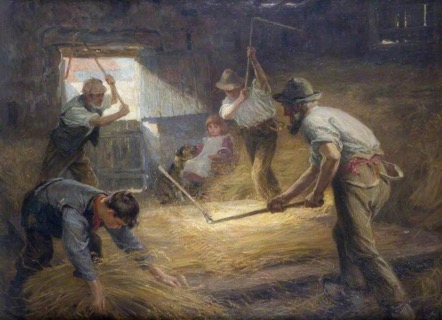
The worst job on the farms at the end of the eighteenth century and the beginning of the nineteenth century, was threshing the corn with a flail. The flail was an instrument of two wooden rods joined together at a hinge. The worker hit the corn stalks on the ground of the barn, so as to separate the individual seeds from the stalk. The job was very tiring, it was done continuously for eight hours (with a pause for lunch), it made the clothes dirty, and there was a lot of dust in the air. (It was also dangerous, as an inexperienced man could hit himself on the back, with the backward movement of the outer rod!). But the work was financially important to the workers, as it made up more then 25 % of the work time outside the hay months and harvest month, and was paid better (+ 50 % to + 75 %) than the daily field-work.
The Threshing Machine (or “Thrashing Machine”) was invented in Scotland by Andrew Meikle in 1784, and was introduced in the Southeast of Scotland and in Northumberland from 1790 to 1800. From 1800 to 1815 it was introduced into all the wheat areas of England; although more in the North, as it was financially more efficient on large farms. It was welcomed by the farmers, as it reduced the labour costs and made life easier for the men. At first it was supposed that the men would suffer financially, but in fact they did not lose their income, but rather were transferred to non-field jobs. The farmers were also interested in the machine, because there was a scarcity of men in the countryside in 1792 to 1815, as about 400,000 had been recruited into the armed forces, and they did not have enough workers; if there had not been this scarcity, it would have been more difficult to find work for the men who had been displaced from the flail work.
“Experience has however fully proved, that the apprehensions then entertained were without foundation; because at no period has [sic] the working classes been more regularly employed, and better paid, than since the thrashing-machine was generally introduced.”
(The Farmer’s Magazine, Vol. 11, 1810, p. 53)
“VIII. In this country where hands are scarce, it is particularly useful, there being full employment in the fields for those who used to thresh; and as that laborious work generally fell to those who were advanced in years, and consequently less fit for active life, humanity may rejoice that they are, by this machine, freed from it, for their earnings were only in proportion to their labour.” [i.e. if they did not have the bodily strength to work all the day, they were not paid for the whole day]
(Young, Annals of Agriculture, Vol. 15, 1791, Letter of Mr. Wilkie, Yorkshire, p. 489)
“The Threshing-machine is unquestionably one of the most valuable implements that has been either invented or introduced into Scotland, or any other country, in the present age. The saving of manual labour, and that of a very severe kind, by means of this invention, is perhaps beyond calculation, while the grain is separated from the straw, in a more perfect and expeditious manner, than what has hitherto been accomplished by any other instrument hitherto adopted.”
(Board of Agriculture / Sir John Sinclair, General Report of the Agricultural State, and Political Circumstances of Scotland, Edinburgh, 1814, p. 226)
“It is observed that the ten pounds per year that appears to be saved by the mill towards paying of the principal, as a farmer, he does not mean it for that purpose, nor to deprive the labourer so much of his employ, but is happy in finding himself so situated, as to get his corn ten per cent. cleaner thrashed, and with so much dispatch, and in so little time, that he can take his labourers to any business the farm may require, such as pruning fences, close or open draining; and so much cash that is saved by thrashing, laid out yearly in the employ of labourers, for those uses on the farm, will pay him fifty per cent. Better, and improve the farm more than keeping one man ten months in the year batting (a provincial phrase for thrashing) in the barn, or even to half the time, and thrashing with the flail. There is not one labourer in twenty, but who would rather do any labour on the farm, than thrash; and if he thrashes it clean, it is well; but if foul, and you find fault, the answer is, “get somebody else”, and he mostly quits your employ.”
(Board of Agriculture / Sherwood, Neely & Jones, General View of the Agriculture of Lancashire, 1815, pp. 169-170)
“The advance in the price of threshing, between the two years in question, may be attributed to the same causes as the advance of other labour connected with the farm, with the general objection labourers now have to that employment, whose capacities are adapted to any other method of obtaining a livelihood; and many will go miles for employment, sooner than thresh corn.”
(Arthur Young / Board of Agriculture, General View of the Agriculture of the County of Norfolk, 1804, letter from the Parish of Marsham, pp. 517-518)
The inventor, Mr. Mikle (or Miekle) wrote to Arthur Young in 1789 to give him some information (and he was also interested in selling his invention!)
“As to the queries you have pointed out to me, I shall answer them in their order.
What is the expense, if erected, to go by wind, by water, by horses?- Answer; the expense, to go by two horses, is 60 l. sterling. To go by water or wind depends on the situation, and will come about 30 l. more than by horses.
How many quarters of corn, wheat, and barley &c. does it thrash in one day?- Answer: it will thrash about thirty-seven quarters of barley or oats in ten hours; grain of the same quality takes one man to thrash seven bushels in the same time. Wheat and other grains in proportion to their quality and length of straw.
What hands are necessary to attend it?- Answer: four hands are employed, viz. one feeding in the corn to the machine, one handing the sheaf of corn to the feeder, one throwing the sheaf to the door, and one driving the horses.
Does it thrash clover?- Answer: clover has never been tried in this country, nor do I think the clover of this country fit to make trial off.
Does the corn, in the straw, pass through any operation to prepare it for the mill?- Answer: none.
How long will it work in common without repairs?- Answer: that depends greatly on the care that is taken of the machine, as she may go many years without any.
Can common workmen repair it?- Answer: they can.
Have you a patent for it?- We have.”
(Arthur Young, Annals of Agriculture, Vol. 11, 1789, “Account of a New Thrashing Machine.”,by Mr. George Mikle, of Alloa, North Britain; pp. 62-64)
The process of the threshing machine was that the sheaves of corn were fed “head first” into a funnel, the heads of corn were broken by iron rods fixed to a revolving drum, the individual grains were deposited in a box, and the stalks fell to the ground. The drum could, using gearing, be moved at a high speed and with much force, as the motive power could be given by a windmilll, by a watermill, or by horses walking around in a circle and attached to the machine by a beam of perhaps 6 yards in length.
The machines usually required two men, one woman, and two boys, plus two to four horses. They could thresh quantities of wheat at about 5 times the speed of men with flails.
(Arthur Young, Annals of Agriculture, Vol. 11, 1789, “Account of a New Thrashing Machine”, by Mr. George Mikle, of Alloa, North Britain; pp. 62-64)
The process of the threshing machine was that the sheaves of corn were fed “head first” into a funnel, the heads of corn were broken by iron rods fixed to a revolving drum, the individual grains were deposited in a box, and the stalks fell to the ground. The drum could, using gearing, be moved at a high speed and with much force, as the motive power could be given by a windmilll, by a watermill, or by horses walking around in a circle and attached to the machine by a beam of perhaps 6 yards in length.
The machines usually required two men, one woman, and two boys, plus two to four horses. They could thresh quantities of wheat at about 5 times the speed of men with flails.
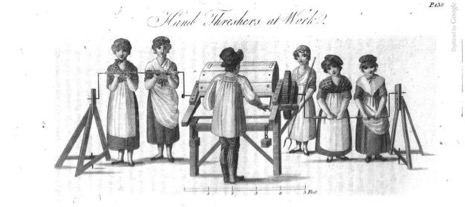
There were also small, hand-powered, threshing machines, which only cost 8 pounds:
Hand Threshers at Work, Berkshire, 1809
(Board of Agriculture / William Mavor, General View of the Agriculture of the County of Berkshire, 1809, plate facing p. 138)
The machine is probably being used for smaller crops, not wheat; it appears that there is no saving in labour.
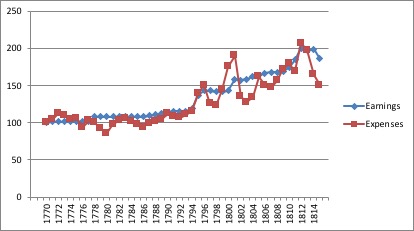
From the data as to weekly wages, and as to costs of living, we can now construct the real wages in each year (a figure in the 4th or 8th column which is above 100.0, means that the year was better than 1770):
Earnings
Expenses
Real Wage
Earnings
Expenses
Real Wage
1770
100.0
100.0
100.0
1800
143.1
175.2
81.7
1771
101.5
103.7
97.9
1801
158.5
189.8
83.5
1772
101.5
112.3
90.4
1802
156.9
134.8
116.4
1773
101.5
110.3
92.0
1803
158.5
127.3
124.5
1774
101.5
104.3
97.3
1804
161.5
134.3
120.2
1775
101.5
105.5
96.2
1805
163.1
161.6
100.9
1776
101.5
93.6
108.5
1806
166.2
150.4
110.4
1777
101.5
102.6
98.9
1807
167.7
147.3
113.9
1778
107.7
99.9
107.8
1808
167.7
156.5
107.1
1779
107.7
91.6
117.5
1809
169.2
172.2
98.3
1780
107.7
85.8
125.6
1810
173.8
179.5
96.9
1781
107.7
98.1
109.8
1811
184.6
169.2
109.1
1782
107.7
102.4
105.2
1812
200.0
206.9
96.7
1783
107.7
105.5
102.1
1813
196.9
197.2
99.8
1784
107.7
101.4
106.2
1814
198.5
164.7
120.5
1785
107.7
97.4
110.6
1815
186.2
150.6
123.6
1786
107.7
94.2
114.4
1787
109.2
99.0
110.4
1788
110.8
101.1
109.5
1789
112.3
104.3
107.6
1790
113.8
112.2
101.4
1791
115.4
108.2
106.7
1792
115.4
106.4
108.5
1793
115.4
111.0
103.9
1794
118.5
115.7
102.3
1795
136.9
139.1
98.4
1796
143.1
150.3
95.2
1797
143.1
125.3
114.2
1798
141.5
122.9
115.2
1799
141.5
144.2
98.1
The graphical expression is as follows:
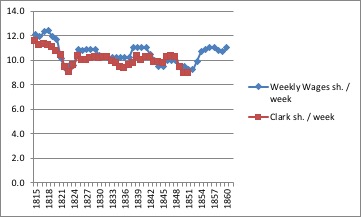
We note that the index of real wage for 1787-1792, which is the range of years commented by the Rev. Davies and his correspondents, is from 105 to 110. This means that the “mental image” that we have of the standard of living in those years, was only exceeded in the following years: 1796-1797, 1802-1804, and 1814-1816. The worst years were 1801-1801, which were 20-25 % below 1787-1792.
Real Wage
Real Wage
Index Quinq
Clark Quinq
1770-1774
100.0
100.0
1775-1779
110.7
105.8
1780-1784
114.9
111.5
1785-1789
115.6
112.4
1790-1794
109.4
108.1
1795-1799
109.1
106.0
1800-1804
110.2
102.7
1805-1809
111.1
104.1
1810-1814
109.5
105.2
1790-1794
To
1810-1814
100.0
97.3
The Clark figures for 1795 to 1809 are a little lower than in this study, as he does not take into account the change to cheaper cereals (barley, rye, oats) in this time-span.
In defining the sources for the cost figures for each position, it is important to note that these farm workers are still partly in a non-monetary economy, and in many cases do not buy their necessities in shops (cheese, butter, sugar, tea, candles, soap). However, since we do not have detailed yearly cost figures for the purchases made by the labourers, in the following we use the “commercial market” or “large purchaser” figures, and assume that the movements in the costs to the labourers reflect these available data.
Cereal, bread:
The cost basis for farm labourers is that of grain flour, and not of loaves purchased in shops, as practically all the labourers bought flour and baked the loaves in the oven in their cottage.
As discussed in another chapter, the percentages for each period, reflecting the real decisions by the population about consumption of cereals, in function of the movements in prices, should be about:
This gives the following index numbers per quinquennium, (1770-1774 = 100), with a comparison against Gregory Clark, who uses 50 % wheat for the whole period.
Cereals
Cereals
index
Clark
1770-1774
100
100
1775-1779
86
89
1780-1784
89
96
1785-1789
88
95
1790-1794
101
108
1795-1799
131
132
1800-1804
147
172
1805-1809
146
172
1810-1814
173
204
1790-1794
to
1810-1814
171
189
Meat, bacon:
The agricultural labourers did not eat “butcher’s meat”, that is, fresh beef, pork, or mutton. They either bought salt pork or bacon each week in a butcher’s shop, or they fattened a pig during the year, killed it in December, and salted the pork to keep it in the house during the next year. The assumptions here are: a) 50 % purchased meat, 50 % fattened pig; b) the cost for feeding the pig was 1/3 barley, 1/3 peas, 1/3 beans.
Cheese:
Ex-farm prices
Butter:
Ex-farm prices
Sugar:
Wholesale market prices (the cost presented includes import duty paid).
Tea:
Wholesale market prices (the cost presented includes import duty paid).
Milk:
Sometimes bought in village shops; a certain part of the milk consumed – apart from the breast milk for the baby – was taken from an owned cow, or bought from neighbours with a cow.
Beer:
The beer shown in the family budgets that we have from the beginning of this period, is home-brewed, and the cost is the malt. (We know that the men did drink a certain amount of beer weekly, because we have data as to the numbers of alehouses in the villages, but these figures were not “publicised”!). There was also consumption of beer or cider in the field-work, given free by the farmer, particularly at harvest-time.
The custom of brewing in-house, however, fell into disuse from 1780-1800 onward. Thus for consistency here, and with the period 1815-1860, the cost is taken from the barrel of beer purchased by Greenwich Hospital (plus 25 % sales tax up to 1830).
Candle, soap:
Large consumer Greenwich Hospital.
Cottage rent:
The rent was paid to the landowner (not to the farmer), and the yearly movements in cost were in parallel to the movements in wages. It is logical that the rent was proportional to the wages, as the payment of the rent was made directly out of the money that the labourer had received for the harvest month.
“The rent of cottages is, of course, much varied by their size, situation, and the conveniences attached to them. Where there is land sufficient for the keep of a cow, it is generally 7, 8, or 9 L. per annum; when a garden only is annexed, they usually let for 4 or L. 5 per annum. The rents have, however, been greatly increased within the last ten years; a natural consequence of the general increase which has taken place in the price of labour, throughout the country.”
(Board of Agriculture / Sir Henry Holland, General View of the Agriculture of Cheshire, 1808, p. 86)
“These rents are increasing in proportion to the increase of labour; few good cottages, with a garden, letting now under four pounds, and where a cow can be kept, they are worth from five to eight pounds per annum.”
(Board of Agriculture / John Boys, General View of the Agriculture of the County of Kent, 1805, p. 33)
Fuel:
The fuel – for heating the cottage, cooking the food – could be coals, wood (bought in faggots, collected from the nearby wood or hedges), or peat or turf. The assumption here is 50 % coal, 50 % wood. The price of fuel varied greatly between counties, according to the geographical position relative to the coal mines. (For the use and cost in each country, see the sections “Fuel” in each “General View of the Agriculture …”). The yearly cost was between 10 and 40 shillings per family.
The movements used in the coal price reflect the pithead price in the Northeast coalfields (Gregory Clark and David Jacks, Coal and the Industrial Revolution 1700-1869, http://gpih.ucdavis.edu/files/Clark_Jacks.pdf, Table 1, p. 37), which should be applicable for the inflation in prices at the other mines. It is not correct to take prices in London (e.g. Greenwich Hospital), since these varied a lot, due to the abusive profits by the owners in the Northeast, the costs of the sea voyage from Newcastle to London, and the duty on arriving in London.
The cost of wood etc. is taken to be in proportion to the wages in the country, it was the cost of labour for cutting the faggots, or the time lost (one week) by the labourer in collecting the wood or peat himself.
For the details of cost, collection and usage, consult: Zylberberg, David; Plants and Fossils: Household Fuel Consumption in Hampshire and the West Riding ofYorkshire, 1750-1830, 2014.
Clothing:
It is difficult to calculate the movements in cost of the clothing of the farm workers and their families. In general, they did not buy the clothes ready-made from the shops; rather they bought them second-hand, “handed them down” from one child to a younger child, or made them at home (especially in the North). Thus the best way to estimate a figure (obviously a decrease; that is what the Industrial Revolution was about!), is to make an average of the movements in linen, woollens, and cotton, and also wages of sempstresses.
We know that the cost of clothing was already decreasing, from 1700 to 1775, that is, before the introduction of cotton manufacture:
“The real recompence of labour, the real quantity of the necessaries and conveniences of life ….. has, during the course of the present century increased perhaps in a still greater proportion than in money price. …. The great improvements in the coarser manufactures of both linen and woolen cloth furnish the labourers with cheaper and better cloathing; …”
(Adam Smith, The Wealth of Nations, 1776, Book 1, Chapter 8, On the Wages of Labour)
The data that we have for prices in these materials are:
Cotton yarn, 100 yards to the pound: 38 shillings in 1786 to 6 s. 9d. in 1807 and (with gap in the data) 3 s. 2 d. in 1829 ((Porter, 1836, Production, p. 212, quoting an article in the Encyclopaedia Britannica);
Selling price of one piece of calico cloth: 25 shillings in 1814 to 8 shillings in 1825(Baines, 1835, p. 356);
Cotton cloth Nield: from 40 shillings per piece in 1780 to 12 shillings in 1825 (C. Knick Harley, Prices and Profits in Cotton Textiles during the Industrial Revolution, 2010, http://www.economics.ox.ac.uk/materials/papers/4363/harley81.pdf, Figure 2, p. 8);
Superfine broadcloth wool: cost of labour from 8 L. 18 s. in 1781 to 4 L 7 s. in 1828 (House of Lords, Hand-loom Weavers, 1840, p. 439);
The approximated value is to 80 % at 1815.
Lying-in, sickness:
This was the cost of medical care in general, nurse for the birth of a baby, official costs for birth, marriage, and burial; also lost daily wages if the worker was sick.
It is calculated with the index equal to the movements in wages.
Sources:
Prices Greenwich Hospital (McCullogh), 1770-1825;
Annals of Agriculture, 1785-1792;
Wheat Prices Windsor, 1595-1789 (Annals of Agriculture, Vol. XIV, 1790);
Gentleman’s Magazine, 1770-1784;
Journal Royal Statistical Society, Vol. 1, 1838;
Victualling Office, 1770-1792 (Annals of Agriculture, Vol. XXVI, 1796);
British History, John Wade, 1843;
Thoughts and Details on the High and Low Prices of the Last Thirty Years, Thomas Tooke, 1823, Appendix to Part IV, No. 1;
State of the Tea Trade, Montgomery Martin, 1832;
The Farmer’s Magazine, Vol. 8, 1838;
Sugar and Slavery, Richard B. Sheridan, 1974;
Coal and the Industrial Revolution 1700-1869, Gregory Clark and David Jacks.
The resulting cost of living indices are:
Expenses
1770
100.0
1800
175.2
1771
103.7
1801
189.8
1772
112.3
1802
134.8
1773
110.3
1803
127.3
1774
104.3
1804
134.3
1775
105.5
1805
161.6
1776
93.6
1806
150.4
1777
102.6
1807
147.3
1778
99.9
1808
156.5
1779
91.6
1809
172.2
1780
85.8
1810
179.5
1781
98.1
1811
169.2
1782
102.4
1812
206.9
1783
105.5
1813
197.2
1784
101.4
1814
164.7
1785
97.4
1815
150.6
1786
94.2
1787
99.0
1788
101.1
1789
104.3
1790
112.2
1791
108.2
1792
106.4
1793
111.0
1794
115.7
1795
139.1
1796
150.3
1797
125.3
1798
122.9
1799
144.2
The total figure for the whole period is slightly lower in this study than in in Clark. This is however a compensation between, especially, higher meat increases, lower sugar and tea increases, and a figure of 80 in this study against 122 according to Clark for clothing. This Clark figure is not explainable, as the textiles decreased in cost in this period, and we know that by the end of the period, the farm labourers and their wives had changed in general to cotton.
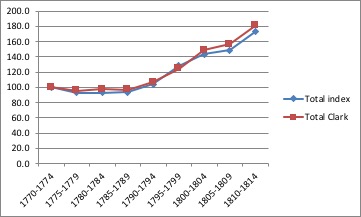
The following table shows the average values in each five-year period, according to the two calculations, on the basis 1770-1774 = 100.0 in both columns.
Total
Total
Index
Clark
1770-1774
100.0
100.0
1775-1779
93.0
95.3
1780-1784
93.0
97.6
1785-1789
93.5
96.9
1790-1794
104.3
106.6
1795-1799
128.5
124.3
1800-1804
143.5
148.4
1805-1809
148.5
156.4
1810-1814
172.9
180.7
1790-1794
to
1810-1814
165.8
169.5
The periods from 1760-1764 to 1790-1794, are practically equal, and for the French Wars / bad harvests period from 1795-1799 to 1810-1815, this calculation gives somewhat lower figures, due in the first place to the reduced proportion of wheat in the food consumption. However, the net movement from 1790-1794 to 1810-1814 is practically the same in the two calculations.
Graphical representation of the two calculations of living costs (1770-1774 =100), by quinquennia:
In some counties, the financial conditions between the farmer and the labourer, or between the landowner and the labourer, were different from the norm in England. In Northumberland many of the better segment of labourers or servants received nearly all their income in kind.
“Through the greatest part of this county, and especially upon the large farms, there are very few servants kept in the house; seldom more than two men and two maids; but the ploughman, carters, barnmen, shepherds, &c. have each a house and garden, or yard, to themselves, and are generally married. The conditions of servitude for one year are:
L. s. d.
2 Cows kept, or money en lieu, at 3l. each
6 0 0
3 Bushels of wheat, … at 5s. per bushel
0 15 0
33 Ditto of oats, ……. at 1s. 8d. ditto
2 15 0
12 Ditto of barley, …. at 2s. 6d. ditto
1 10 0
12 Ditto of rye, …….. at 3s. 4d. ditto
2 0 0
10 Ditto of pease, ….. at 3s. 6d. ditto
1 15 0
24 lb. of cast wood, … at 6d. per lb.
0 12 0
One Bushel of potatoes planted, a pig tethered,
keeping hens, &c.
2 4 0
Carriage of coals, six cart-loads
1 0 0
In all
18 11 0
They are bound to find a woman labourer to work for the following wages; for harvesting 6d. per day; for hoeing turnips, hay-making, scaling, weeding corn, &c. used to be 4d. per day, but was last year raised to 6d. per day.
In addition to the above conditions, the shepherd generally has as many sheep kept as are worth four or five pounds per year; but, if has any under-shepherd to keep to assit him, the number is increased accordingly. In the hilly districts, their sheep sometimes amount to hundreds, besides six or eight neat cattle.
An overseer, or head servant, has, in addition to the above, as much money as to make his place worth from 20l. to 30l. a year.
Thrashing is mostly done by the piede; a twenty-fifth part of the corn thrashed being the general custom, if the straw be taken away unfolded; but if the thrasher folds the straw, ha has a twenty-first part, and finds a woman to dress the corn, and to work at all other work, for the same wages as the others; he has straw for his cow in Winter, but pays for her Summer’s grass.
The yearly wages of house-servants are, for men, from 8l. to 12l.; for women, 3l. to 5l.
The wages of day-labourers, without victuals, or any allowance of beer, are,
s. d. s. d.
For Men, in Summer 1 2 to 1 4 (+)
Winter 1 0 to 1 2
Harvest 1 6 to 1 9
Women, ditto 1 0 to 1 3
For other work 0 6 to 0 8”
(+) (footnote in the original text) “In 1796, the wages got up to 2s. and in harvest to 2s. 6d. for men; and for women, to 1s. 9d.”
(Board of Agriculture / J. Bailey and G. Culley, General View of Agriculture of the County of Northumberland, 1797, Rural Economy, pp. 145-147)
In Dorset some costs were absorbed by the farmer or by the parish:
“Medical assistance is dispensed of course when needed, and Mr. Goodenough says it sometimes costs 30l. per annum at Frampton. In some places, surgeons are engaged to attend the poor at a fixed salary.”
(Board of Agriculture / William Stevenson, General View of Agriculture in the County of Dorset, 1812, p. 429)
“Mr. Park of St. Giles, believes the state of the poor is much altered for the better within the last twenty years, and principally by the introduction of potatoes, which were scarcely known thirty years hence. At the former period, the labourers had very little beside bread and cheese and water, but at present they have the important additions of potatoes, pork, and bacon. Almost everyone keeps a pig, which is fed on potatoes, and sometimes finished with a small quantity of pease and barley.
The custom of allowing the labourers to grow potatoes on the fallows otherwise intended for turnips, appears to be a distinguishing merit in the upland farmers of this county; and in the villages that are purely agricultural, the greater part of the poor have a house, a garden, a potatoe-ground in the field, and medical aid, all free of expense, and wheat at a cheap rate. The price of labour and the poor-rates are so intermixed and altered by these circumstances, that it is almost impossible to ascertain what belongs to each separately.
The portion of the fallows allowed to labourers is regulated by the number in the family, and it is sometimes as much as one-third of an acre. The produce is from 50 to 100 bushels or more, and the labourer is expected to find a sufficiency of manure for the land he occupies, and by means of keeping a pig, it is said, this may be effected.
Many of the poor keep two or three fowls; and they have generally ovens and plenty of fuel, to enable them to make use of the economical method of baking their own bread.
In these respects their situation is much superior to that of the poor of Bedfordshire, &c. amongst whom home-baked bread is little used, as such as have families cannot purchase the corn, and are much in the habit of stealing their firing, or begging it, together with their house-rent and clothing, of the parish officers. Many are become indebted to the village shop-keepers in the late seasons of scarcity, and so much are their morals depraved by this circumstance, that it is said they frequently make it their study to increase their debts rather than to lessen them.” (Ibid., pp. 454-455)
The system in Lincoln of cottages and land being given at a low rent, has been described above.
From the above examples we see that the sole figure of weekly winter wages does not necessarily indicate correctly the standard of living of the the labourer and his family.
Rich counties, poor counties
Arthur Young gives us a table of the prices of food in different counties in 1795, which show a considerable variation. He also shows a table for cottage rent and fuel.
(Young, Annals of Agriculture, Vol. XXIV, 1795, Recapitulation of the Editor, p. 336-338)
We have a number of descriptions of the good life in the richer counties:
“The sober and industrious labourer in Kent, unless he has a large family, cannot with propriety be called a poor man; because, by his industry, he can always procure a comfortable maintenance, equal, if not superior, to the little farmer (usually called peasants) of some foreign countries; or perhaps to some small tenants of this.
Those who are doubtful of the truth of this observation need only step into the cottages of this class, at their hour of dinner at twelve, when they may see the superior comforts of the husbandry labourers of this agricultural community. Very few of the sober and industrious but what have a pork-tub [small wooden barrel, which contained the salt pork pieces] to go to for dinner; and many of them, by their own earnings, with that of their wives and families, including what they get in harvest, hop-picking, &c, have an income of from forty to sixty pounds per annum.”
(Board of Agriculture / John Boys, General View of the Agriculture of the County of Kent, 1805, p. 206)
“The labourers near London provide for themselves, and every branch of their family, the very best wheaten bread, and the richest new milk cheese, ….”
(Board of Agriculture / John Middleton, General View of the Agriculture of the County of Middlesex, 1805, p. 594)
“The quantity of pork eaten by the labourers of this county is very great, and in the quantity of animal food of all sorts, which is consumed in Middlesex, is amazing. Even, regard being had to the population, I apprehend it is much more considerable than the average proportion per head of all England.
Suppose a family which consists of six persons, viz. a man, his wife, a female servant, and three children, to be a fair average sample of the better regulated families in the country part of this county, such a family consumes of animal foodabout 4 lb. per day; which amounts to thirty stone and a half (of 8 lb. each) for each inhabitant per ann. In a section on supply and consumption [pp. 643-644], I have endeavoured to shew, that on an average of the inhabitants of all ages in this county, including the luxurious and wateful cities of London and Westminster, each person consumes near 39 stone of animal food.
The quantity of wheat used, where bread is entirely made of it, as it is in the south of England, and including the other applications of fine flour, in pies, puddings, &c. and the waste is, about eight bushels for every inhabitant. A family of five persons, eating much animal food, consumes seven quartern loaves per week, and as much flour for other purposes, as would make another quartern loaf, which together is equivalent to eight quartern loaves per week. This is a small fraction more than six bushels per annum to each inhabitant.”
(Board of Agriculture / John Middleton, General View of the Agriculture of the County of Middlesex, 1805, pp. 510-511)
“Respecting cottages, the master manufacturers, have supplied habitations to what workmen they wanted; and every kind of food is in abundance at an average price; the district is well peopled, but has large quantities of animal food to spare; the county is certainly healthy, as any part of the kingdom; but the greatest mortality is in towns, as the above table will show, in which the number of deaths approach the births, much nearer than in the country parishes, though Loughborough upon a gravelly, sound, dry soil, seems an exception.
The modes of living are good, and rather inclined to be luxurious. Wheaten bread, with beef, mutton, cheese, and butter of the best, are the principal diet of all who can raise it, as well as vegetables and beverage in perfection; and the want of which is only known by those in poverty and distress, and whose feelings prevent their applying for relief.”
(Board of Agriculture / William Pitt, General View of the Agriculture of the County of Leicestershire, 1809, pp. 337-338)
However there are bad news on occasion from some counties:
“I am afraid the state and condition of the poor, every where, are bordering on misery and famine.”
(Vol. XXVI, 1796 (1), Letter XX, Yorkshire, p. 6)
“The state and condition of the poor is truly pitiable, and has been greatly increased by the scarcity and dearth of potatoes in the last spring, as they were not able to procure seed to till their gardens.”
……..
“Though the wages of agricultural labour are increased at least one-fourth within the last ten years, they are still inadequate to support a family, without driving a man, on every emergency, to the parish for assistance.”
(Board of Agriculture / William Mavor, General View of the Agriculture of the County of Berkshire, 1809; p. 414)
“It must, however, be admitted, that with a large family, no fair and reasonable wages will enable a labourer to acquire even the bread necessary to support life;”
(Board of Agriculture / William Mavor, General View of the Agriculture of the County of Berkshire, 1809; p. 476)
“The labouring part of the community in this county, live upon bread made of grey pease and barley, in the proportion of two parts barley to one of pease; and though coarse, is a most hardy food and wholesome; Though, I own that wheaten bread is more used than formerly.”
(Young, Annals of Agriculture, Vol. XXIV, 1795 (1), Letter XV, Northumberland, p. 107)
“The poor of this county are, I believe, in as good a situation as others of the same class elsewhere, yet when we come to consider it, and calculate particulars, it must be pronounced rather pitiable. If a labouring family consists of a man, his wife, and four children, they will consume in bread per day, if they can get it, 1s.
S. D.
Which is, per week 7 0
Rent per week 1s. 6d., milk suppose 6d. 2 0
Cheese or butchers’ meat 2 lb. per day 1s.
Per week 7 0
Per week necessaries 16 0
but the gains of a labourer and his wife will seldom exceed upon the average of 15s. per week, whence it appears that the above allowance must be curtailed, and privations sustained; potatoes from the garden must be substituted in part for bread, and the cheese and meat allowance lessened, for which a pig should be substituted, fed on the premises from the garden and from gleanings; hence will appear the necessity of furnishing labourers’ cottages with sufficient gardens and a hog-stye, if the family is to be kept from starvation.
……..
The gains of a manufacturers’ family are more, and may be put at a guinea a week; but even then, if we make the above allowance for necessaries as stated, there remains only 5s. per week for fuel, candles, soap, and cloathing, for the whole family, which are equally necessaries; to say nothing of tea, sugar, butter, and beer, which if not necessary to existence, at least necessary to comfort; the labourers’ family is placed more on a level with the latter, by an allowance of beer from the farmer, as well as coals drawn, and sometimes other privileges.”
(Board of Agriculture / William Pitt, General View of the Agriculture of the County of Leicestershire, 1809; pp. 327)