| Monetary system Pounds (£ or L.), shillings (s.), pennies or pence (d.) 1 Pound = 20 shillings, 1 shilling = 12 pence Wage of farm labourer = 9 to 12 shillings per week Wage of male worker in textile factory = 20 to 30 shillings per week Dry weight measures 1 bushel wheat = 60 lb., 1 quarter = 480 lb. Price of 4 pound loaf of wheaten bread = 6 to 8 pence Energy supplied by 4 pound loaf = 4,500 calories Price of butcher’s meat = 4 to 6 pence per pound |
We have a number of reports on the winter weekly wages for farm labourers in each of the counties in England:
1824 Abstract of the Report of the Select Committee on Labourers’ Wages
1832 Report from His Majesty’s Commissioners for Inquiring into the Administration and Practical Operation of the Poor Laws, Rural Queries, session 1834, vols. xxx-xxxiv [the data are from 1832]
Resumed in: Yamamoto, Chiaki, Men’s Unemployment and Job Opportunities for Women: an Analysis of the 1834 Poor Law Report; Economic History Society Conference, 2010, Durham; http://www.ehs.org.uk/dotAsset/72944590-f0b9-4d44-8a62-02e1b681e142.pdf; Figure 7, Agricultural labourers’ wages in England (1832), based on the Poor Law Report (s. / week), p. 37
1833 Select Committee on Agriculture: House of Commons, With the Minutes of Evidence Taken Before Them and an Appendix and Index: Ordered to be Printed 28 Aug. 1833 [answers by individual farmers and land agents, referring to their county]
1837 Purdy, Frederick (Principal of the Statistical Section, Poor Law Board, London); On the Earnings of Agricultural Labourers in England and Wales, 1860, Journal of the Statistical Society, Vol. 24, No. 3 (Sep. 1861), http://www.jstor.org/stable/2338485
1850 Agricultural Gazette, The Value of Agricultural Labour, April 27, 1850, pp. 266-267
1850 Caird, Sir James, English Agriculture in 1850-51, Longman, Green, Brown, and Longmans, London, 1852
1860 Purdy, Frederick (Principal of the Statistical Section, Poor Law Board, London), On the Earnings of Agricultural Labourers in England and Wales, 1860; Journal of the Statistical Society, Vol. 24, No. 3 (Sep. 1861) http://www.jstor.org/stable/2338485
1860 Agricultural Gazette, The Value of Agricultural Labour, April 28, 1860, p. 392
1860 Board of Trade, Returns of Wages. pp. 420-423
Following we have a comparison of the different years:
| Abstract Wages | Poor Law Report | Select Comm. | Purdy | Agric Gazette | Caird | Purdy | Agric Gazette | Board Trade | |
| 1824 | 1832 | 1833 | 1837 | 1850 | 1850 | 1860 | 1860 | 1860 | |
| Bedford | 8.6 | 9.5 | 9.5 | 8.0 | 9.0 | 10.0 | 10.5 | ||
| Berkshire | 8.8 | 9.6 | 9.0 | 7.5 | 9.0 | 12.0 | |||
| Buckingham | 8.2 | 9.8 | 8.5 | 8.5 | 11.0 | ||||
| Cambridge | 9.0 | 10.0 | 9.0 | 10.0 | 10.0 | ||||
| Cheshire | 10.7 | 8.9 | 9.5 | 13.0 | 8.0 | 11.5 | 11.0 | 11.5 | |
| Cornwall | 8.2 | 8.4 | 9.0 | 9.0 | 11.0 | 11.0 | |||
| Cumberland | 12.2 | 9.3 | 11.0 | 12.0 | 10.5 | 13.0 | 15.0 | 15.0 | 13.5 |
| Derby | 10.8 | 10.8 | 12.0 | 12.0 | 10.0 | 12.0 | 11.0 | 12.0 | |
| Devon | 7.8 | 8.5 | 8.0 | 11.0 | 9.0 | 11.5 | 10.0 | ||
| Dorset | 7.0 | 8.0 | 7.5 | 7.0 | 7.5 | 9.5 | 8.0 | 9.5 | |
| Durham | 12.5 | 11.0 | 12.0 | 11.0 | 14.0 | 13.0 | 14.0 | ||
| Essex | 9.3 | 10.2 | 9.0 | 10.5 | 10.0 | 8.0 | 11.0 | 10.0 | 11.0 |
| Gloucester | 9.2 | 8.8 | 9.0 | 8.5 | 7.0 | 9.5 | 10.0 | 9.5 | |
| Hampshire | 8.5 | 10.1 | 10.0 | 9.5 | 8.0 | 9.0 | 12.0 | 10.0 | 13.0 |
| Hereford | 7.0 | 8.2 | 9.0 | 8.0 | 8.0 | 9.0 | 10.0 | 9.5 | |
| Hertford | 9.0 | 10.9 | 9.5 | 9.0 | 9.0 | 10.0 | 10.0 | 10.0 | |
| Huntingdon | 7.5 | 12.1 | 8.0 | 8.5 | 11.0 | ||||
| Kent | 11.4 | 12.3 | 14.0 | 12.0 | 9.5 | 12.0 | 11.5 | 12.0 | |
| Lancashire | 12.2 | 10.7 | 13.5 | 13.5 | 13.5 | 15.0 | 14.0 | ||
| Leicester | 10.0 | 9.9 | 10.0 | 9.0 | 11.5 | 13.0 | |||
| Lincoln | 10.2 | 12.0 | 12.0 | 9.0 | 10.0 | 13.0 | 12.0 | 13.5 | |
| Middlesex | 11.2 | 12.1 | |||||||
| Monmouth | 10.0 | 10.0 | 10.5 | 9.0 | 11.5 | 12.0 | 12.0 | ||
| Norfolk | 9.0 | 9.7 | 11.0 | 10.5 | 8.0 | 8.5 | 10.5 | 9.0 | 10.5 |
| Northampton | 8.0 | 9.7 | 8.0 | 9.0 | 8.5 | 9.0 | 11.0 | 12.0 | 11.5 |
| Northumberland | 11.4 | 10.4 | 12.0 | 12.0 | 11.0 | 14.0 | 15.0 | 14.0 | |
| Nottingham | 10.2 | 11.4 | 13.0 | 12.0 | 10.0 | 10.0 | 12.5 | 11.0 | 12.5 |
| Oxford | 8.2 | 9.2 | 7.5 | 9.0 | 11.0 | ||||
| Rutland | 10.8 | 9.0 | 11.0 | 11.5 | |||||
| Shropshire | 9.0 | 8.6 | 9.0 | 9.0 | 10.0 | 10.0 | 10.0 | ||
| Somerset | 9.0 | 7.8 | 8.5 | 8.5 | 7.0 | 10.0 | 10.0 | 10.0 | |
| Stafford | 10.5 | 12.5 | 10.0 | 12.0 | 9.5 | 12.5 | 10.0 | 12.5 | |
| Suffolk | 8.2 | 9.3 | 10.5 | 7.5 | 8.5 | 10.5 | 9.0 | 11.5 | |
| Surrey | 10.5 | 11.6 | 10.0 | 10.5 | 12.0 | 9.5 | 13.0 | 13.0 | |
| Sussex | 9.5 | 11.3 | 9.5 | 10.5 | 9.0 | 10.5 | 11.5 | 11.5 | 11.5 |
| Warwick | 8.8 | 10.4 | 10.0 | 8.0 | 8.5 | 10.5 | 11.0 | 10.5 | |
| Westmoreland | 10.3 | 12.0 | 11.0 | 14.0 | 14.0 | ||||
| Wiltshire | 7.5 | 8.7 | 8.0 | 8.0 | 6.5 | 7.0 | 9.5 | 8.5 | 9.5 |
| Worcester | 10.3 | 9.5 | 9.0 | 9.5 | 8.0 | 10.0 | 10.0 | 10.0 | |
| York E Rid | 11.7 | 12.4 | 12.5 | 12.0 | 10.0 | 12.0 | 13.5 | 14.0 | |
| York N Rid | 10.2 | 9.7 | 12.0 | 10.0 | 11.0 | 13.5 | 14.0 | 13.5 | |
| York W Rid | 12.4 | 10.6 | 12.0 | 12.0 | 10.0 | 14.0 | 13.5 | 14.0 | 15.0 |
| Average | 9.6 | 10.1 | 10.4 | 10.2 | 9.1 | 9.6 | 11.5 | 11.2 | 11.7 |
We notice that Dorset and Wiltshire have much lower wages than the other counties. But in Dorset it was the norm for the farmer to absorb the cost of the cottage rent, and deliver the firewood free. In Wiltshire many labourers had allotments, where they could cultivate potatoes and sometimes wheat.
“What is the state of farming in Dorsetshire?” “In the agricultural districts I think it is very bad; it is bad everywhere. In Dorsetshire there has been less distress than in almost any county in England, from our poor-rates not being so heavy; and I think the system of Dorsetshire, allowing the men their cottages, and giving their potato ground in a field, where we plough and manure it, according to the size of their families, and they get their fuel from the down, the furze (they have an allowance of wheat as well), though we pay them but 7s. a week, I consider it equal to 11s. to them.”
“You include in that a cottage with a piece of garden?” “Yes.”
“Do you mean to say that they pay nothing for their cottages?” “No.”
“They have wood from the copses?” “No, we have no copse in some of the parishes; furze is the principal with us.”
“You think that keeps your poor in a better state than in the neighbouring counties?” “Yes.”
(Select Committee on the State of Agriculture, 1837, Mr. James Taylor, Dorsetshire. Farmer, p. 171)
“That was before the allotment system began?” “It was before it was so general.”
“The allotment system has been carried to a greater extent in Wiltshire than any other county?” “I believe it has.”
“What is the extent in point of quantity of land?” “My rule is never to go beyond a quarter of an acre, if the family be ever so large; that will be sufficient to maintain the largest family in vegetables.”
“Do you include potatoes in vegetables?” “They grow potatoes principally; if they had more it would spoil the character of the man, and make a sort of gardener of him.”
“What quantity of corn do you suppose each of those labourers used to consume before the allotment system was introduced?” “The calculation used to be about a quarter in the twelvemonth.”
“What quantity do they consume now?” “According to my calculation, the consumption is reduced one-third.»
“That, you think, applies pretty much to the agricultural population?” “Yes; I think it has had a considerable effect upon the price of wheat.”
“Is it the case with respect to the labourers in agriculture, where the allotment system does not prevail, on account of potatoes being grown in farmers’ fields?” “It is the case in every county, more or less, but more strongly where the allotment system is introduced.”
“What quantity of potatoes do you conceive a labourer can grow in a quarter of an acre?” “Twenty sacks; that is 60 bushels.”
“Are 60 bushels of potatoes any thing equal to the support of the family of an agricultural labourer?” “Quite sufficient; they tell me they always have plenty if they can grow 20 sacks; that will keep them, and they fatten their pigs with the small potatoes.”
“You do not suppose them to live entirely on potatoes?” “No, certainly not.”
“Do you think the potatoes grown in farmers’ fields have dimished the consumption of wheat?” “No doubt of it; they are so commonly grown by farmers, they are very cheap.”
“Then they have no cause of complaint, if the price of wheat has been diminished by the growth of the potatoes by themselves?” “We know it applies in that way, but then the comforts of the poor are increased.”
“Has the farmer any cause of complaint, if his land produces him as great a profit in potatoes as wheat?” “It is not in general the farmers who grow the potatoes, but other persons who have taken land to grow them.”
“Do not you think that the introduction of Irish bacon among the labourers has tended to decrease the quantity of wheat eaten?” “Yes; the quantities of Irish bacon brought through Wiltshire to the London market and other markets are beyond any thing that can be conceived.”
(Select Commission on the State of Agriculture, 1837, Mr. Robert Hughes, Steward to landowners, Wiltshire, p. 163)
We also have a number of sources for one county or for one farm, but each giving a complete series over 15 or more years:
1815-1840, Essex
G. E. Mingay, Land, Labour and Agriculture, 1700-1920, Appendix 4.1, p. 90, Indices of Agricultural Labourers’ Wages, the Cost of Living and Real Wages, in Essex, 1790-1840
1814-1823, Huntingdon
Report of the Select Committee on Labourers Wages, 1824, Minutes of Evidence, pp. 21-22
1815-1840, Lincolnshire
Richardson, T. L., The Agricultural Labourers’ Standard of Living in Lincolnshire, 1790-1840: Social Protest and Public Order; Fig. 1, p. 4, Agricultural Labourers’ Wages at Stamford and the Cost of Living, 1790-1840
1815-1843, Norfolk
Richard Noverre Bacon, The Report on the Agriculture of Norfolk for which the Prize was awarded by the Royal Agricultural Society of England, 1844, p. 144, The Average Price of Wheat per Coomb received, and Labourers’ Weekly Wages, paid from 1804 to 1844, on a Light-land Farm
1815-1829, Northampton
Viscount Milton, Address to the Landowners of England on the Corn Laws, James Ridgway, London, 1832, https://catalog.hathitrust.org/Record/001737305, Table A, pp. 44-45.
1815-1820, Sussex
House of Commons, Report from the Select Committee to whom the several Petitions complaining of the Distressed State of the Agriculture of the United Kingdom were referred, 1821, p. 53
1815-1825, Kent
H. G. Hunt, Agricultural Rent in South-East England, 1788-1825, British Agricultural History Society, Vol. 7.2., 1959, http://www.bahs.org.uk/AGHR/ARTICLES/07n2a4.pdf
1815-1822, Norfolk (Great Massingham)
Brereton, Rev. C. D. (Rector of Little Massingham, Norfolk), Observations on the Administration of the Poor Laws in Agricultural Districts, J. Hatchard and Son, Norwich, 1824, p. 101
1815-1830, Middlesex (Houndslow)
Select Committee of the House of Lords, appointed to consider of the Poor Laws, 1830-1, Minutes of Evidence, Ordered to be Printed, 7th December 1830, p. 109
1815-1823, Cumberland
John Rooke, An Inquiry into the Principles of National Wealth, Balfour and Company, London, 1842, Table I, Part II, p. 432.
1821-1843, Surrey (Limpsfield)
House of Lords, Royal Commission on the Employment of Children, Young Persons, and Women in Agriculture, 1867-9, (quoted in Bowley, 1900, p. 33)
1821-1839, Sussex
Arthur Lyon Bowley, Wages in the United Kingdom in the Nineteenth Century, Cambridge University Press, Cambridge, 1900; Section V: Agricultural Wages in Sussex, Wages contrasted with Earnings, p. 40
These are resumed as follows:
| 1815 | 1816 | 1817 | 1818 | 1819 | 1820 | 1821 | 1822 | ||
| Essex | 10.4 | 9.4 | 10.0 | 10.4 | 10.4 | 10.4 | 9.5 | 8.8 | |
| Huntingdon | 11.5 | 11.5 | 11.5 | 12.0 | 11.8 | 11.5 | 10.5 | 7.5 | |
| Lincoln | 12.0 | 12.0 | 12.0 | 12.0 | 12.0 | 12.0 | 12.0 | 10.0 | |
| Norfolk | 10.0 | 10.0 | 12.5 | 10.5 | 10.5 | 10.0 | 9.0 | 8.0 | |
| Northampton | 12.0 | 11.0 | 12.0 | 12.0 | 12.0 | 12.0 | 10.0 | 10.0 | |
| Sussex | 13.0 | 13.0 | 13.0 | 13.0 | 13.0 | 13.0 | |||
| Somerset | |||||||||
| Kent | 13.5 | 13.5 | 13.5 | 13.5 | 13.5 | 13.5 | 11.0 | 11.0 | |
| Norfolk | 10.0 | 12.0 | 12.0 | 12.0 | 10.5 | 10.0 | 8.0 | 9.0 | |
| Middlesex | 15.0 | 15.0 | 15.0 | 15.0 | 12.0 | 12.0 | 10.5 | 10.0 | |
| Cumberland | 13.5 | 12.0 | 11.8 | 11.5 | 11.0 | 10.5 | 10.0 | 9.5 | |
| Surrey | 14.0 | 14.0 | 13.5 | 12.0 | 11.0 | ||||
| Sussex | 9.0 | 8.0 | |||||||
| Average | 12.1 | 11.9 | 12.3 | 12.4 | 11.9 | 11.7 | 10.1 | 9.3 |
| 1823 | 1824 | 1825 | 1826 | 1827 | 1828 | 1829 | 1830 | ||
| Essex | 8.4 | 8.4 | 9.3 | 9.3 | 9.3 | 9.3 | 9.3 | 9.3 | |
| Huntingdon | 8.5 | ||||||||
| Lincoln | 10.0 | 10.0 | 12.0 | 12.0 | 12.0 | 12.0 | 12.0 | 12.0 | |
| Norfolk | 9.0 | 9.0 | 9.0 | 10.0 | 10.0 | 10.0 | 10.0 | 10.0 | |
| Northampton | 9.0 | 10.0 | 11.0 | 11.0 | 11.0 | 11.0 | 11.0 | ||
| Sussex | |||||||||
| Somerset | |||||||||
| Kent | 9.5 | 9.5 | 13.5 | ||||||
| Norfolk | |||||||||
| Middlesex | 12.0 | 12.0 | 12.0 | 12.0 | 12.0 | 12.0 | 12.0 | 12.0 | |
| Cumberland | 9.0 | ||||||||
| Surrey | 10.0 | 11.0 | 12.0 | 12.0 | 12.0 | 12.0 | 12.0 | 11.0 | |
| Sussex | 9.0 | 9.5 | 9.5 | 9.5 | 10.0 | 10.0 | 10.0 | 11.0 | |
| Average | 9.4 | 9.9 | 11.0 | 10.8 | 10.9 | 10.9 | 10.9 | 10.9 |
| 1831 | 1832 | 1833 | 1834 | 1835 | 1836 | 1837 | 1838 | ||
| Essex | 9.3 | 9.3 | 9.3 | 9.5 | 9.5 | 9.5 | 9.5 | 9.5 | |
| Huntingdon | |||||||||
| Lincoln | 12.0 | 12.0 | 12.0 | 10.0 | 10.0 | 10.0 | 10.0 | 12.0 | |
| Norfolk | 10.5 | 10.5 | 10.0 | 9.0 | 9.0 | 9.0 | 10.0 | 11.0 | |
| Northampton | |||||||||
| Sussex | |||||||||
| Somerset | |||||||||
| Kent | |||||||||
| Norfolk | |||||||||
| Middlesex | |||||||||
| Cumberland | |||||||||
| Surrey | 12.0 | 12.0 | 12.0 | 12.0 | 11.0 | 11.0 | 12.0 | 12.0 | |
| Sussex | 12.0 | 11.0 | 10.0 | 10.0 | 10.0 | 10.0 | 10.0 | 10.0 | |
| Average |
| 1839 | 1840 | 1841 | 1842 | 1843 | ||
| Essex | 10.0 | 10.0 | ||||
| Huntingdon | ||||||
| Lincoln | 12.0 | 12.0 | ||||
| Norfolk | 10.5 | 10.5 | 10.5 | 10.0 | 9.0 | |
| Northampton | ||||||
| Sussex | ||||||
| Somerset | ||||||
| Kent | ||||||
| Norfolk | ||||||
| Middlesex | ||||||
| Cumberland | ||||||
| Surrey | 13.0 | 13.0 | 13.0 | 13.0 | 13.0 | |
| Sussex | 10.0 | |||||
There are more figures of the same magnitude in: Wilson Fox, A., Journal of the Royal Statistical Society, Vol. 66, No. 2 (Jun., 1903), pp. 273-359
1825-1860 Warwickshire
1825-1860 Hertfordshire
1836-1860 Suffolk
1850-1860 Essex
1825-1860 Wiltshire
1825-1860 Herefordshire
1850-1860 Devon
There is further a list of average wages for England for 1850-1860 in:
Wilson Fox, op. cit., Appendix II, pp. 331-332
| 1850 | 1851 | 1852 | 1853 | 1854 | 1855 | 1856 | 1857 | 1858 | 1859 | 1860 |
| 9.3 | 9.2 | 9.2 | 9.9 | 10.7 | 10.9 | 11.0 | 11.0 | 10.8 | 10.7 | 11.0 |
We have another contemporary source of data, particularly giving movements in wages and living conditions, by counties. In 1833, Parliament decided to investigate and debate the possibility of changing the Corn Laws; these were laws that prohibited the import of corn, unless the domestic price was higher than a certain limit, and thus kept up the price of wheat in England, to the advantage of the landowning classes. To that end, Parliament named a Committee, which summoned a number of land agents, surveyors, tenant farmers, and landowners, from different counties to answer a large number of questions (in total, more than twelve thousand). The main point of the questions was the price of corn and its influence on the financial health of the farming community. But they also asked about the labourers, for example: their income in 1833, their income 10 or 20 years ago, if their living conditions were better or worse, how well did they eat, and if they had a cottage. We may suppose that the answers of the experts were honest, since they were responding in front of a Committee of Parliament, with other experts present (the questions appear to be put with much knowledge of the matter).
The questions were answered with the following content by the great majority of the respondents:
- the labourers are divided into two classes, those that have guaranteed employment all the year round, and a smaller number who are not employed in the winter, when there is less work on the farms, as these are “bad workers” or “bad characters”;
- 15 or 20 years earlier, there was work for all the labourers, all the year round;
- the quantity of work available has decreased because the prices earned by the farmer are not enough, and because the Poor Law payments are now too generous (a man with wife and three children can gain as much as a man with employment);
- the harvest payments are much higher than the normal weekly wages, and there is also a possibility to earn a higher amount in a given week through “task-work”;
- the nominal wages have decreased against the situation of 15 or 20 years before;
- the men and families are better off in their daily life, than 15 or 20 years ago (in the case of those with continuous employment), in spite of the decrease in nominal wages;
- the cost of clothing (*), and of food has gone down;
- more men and women now wear cotton (*);
- the men usually eat meat more than once a week, and the other family members eat cheese or bacon, additional to bread or porridge;
- many have a cottage, for which they pay a rent to the sub-tenant of the landowner, and a number have land for growing vegetables;
- as to the men without employment in the winter, the farmers try to find them small maintenance jobs around the fields, and the parish authorities try to give them work remaking roads, before they are put on the Poor Law payments, or required in the workhouse.
(*) this shows a positive effect of the Industrial Revolution, since the efficiency of the machines made it possible to have much more cotton in the market, and at a lower price.
The basic weekly wages in 1833, and on the previous date of comparison, according to the Report, were:
| Region | County | Basic Wage | Basic Wage |
| Previous date | 1833 | ||
| North-East | N. Riding | 21s. | 12s. to 13s. |
| North-West | W. Riding | 12s. | |
| Lancashire | 12s. to 15s. | ||
| Cheshire | 9s. to 10s. | ||
| Cumberland | 14s. | 10s. to 12s. | |
| Leicestershire | 13s. to 15s. | 10s. | |
| Staffordshire | 13s. | 10s. | |
| Derbyshire | 6s. | 12s. | |
| Nottinghamshire | 18s. | 13s. | |
| South-East | Essex | 9s. | 9s. |
| Norfolk | 11s. | 11s. | |
| Hampshire | 9s. | ||
| Kent | 18s. to 21s. | 12s. to 15s. | |
| Kent | 9s. | 13s. to 15s. | |
| Kent | 13s. to 15s. | 13s. to 15s. | |
| Sussex | 12s. to 18s. | 9s. to 10s. | |
| Hampshire | 9s. to 12s. | ||
| Surrey | 8s. | 12s. | |
| Wiltshire | 9s. | 8s. | |
| Surrey | 8s. to 9s. | 7s. | |
| South-West | Worcester | 9s. to 10s. | |
| Worcester | 10s. | 9s. | |
| Somerset | 9s. | 8s. | |
| Herefordshire | 9s. | ||
| Somerset | 9s. | ||
| Northamptonshire | 7s. to 9s. | ||
| Cornwall | 8s. to 10s. |
The wages in the column of 1833 are in general lower than those in the previous column; agricultural labourers wages were higher during the French Wars, and up to 1820, as they had an informal compensation for the high wheat prices.
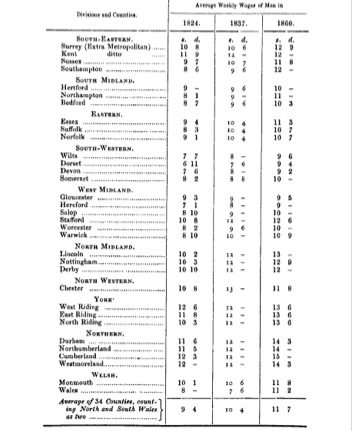
For the period 1824-1860, we have a report of 45 pages by Charles Purdy in 1861 to the Royal Statistical Society, on the Earnings of Agricultural Labourers in England and Wales. Mr. Purdy was Principal of the Statistical Section of the Poor Law Board in London, and thus had access to a large quantity of data about the condition of the poor; he was also later President of the Royal Statistical Society.
The main message of his report was of an increase of the wages of the labourers, and the sufficiency of their incomes to cover their expenses.
(Purdy, 1861, p. 342)
The increase in nominal weekly wages was 10.7 % from 1824 to 1837, 12.1 % from 1837 to 1860, and thus 24.1 % from 1824 to 1860. This was during a period of decrease in the costs of food.
The figures in the column for 1837 are similar to those shown three pages before, taken from the Commission on Agriculture of 1833. The wages in the column of 1860 are similar to those of the Returns of Wages, published by the Secretary of the Board of Trade, pp. 420-423.
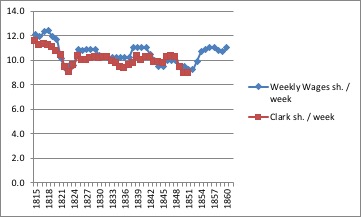
From the above pages of data sources, which are consistent with one another, we can draw up a list of probable winter weekly wages (shillings), averaged over all the counties of England, by years from 1815 to 1860:
| 1815 | 12.1 | 1841 | 11.0 | |
| 1816 | 11.9 | 1842 | 10.5 | |
| 1817 | 12.3 | 1843 | 10.0 | |
| 1818 | 12.4 | 1844 | 9.5 | |
| 1819 | 11.9 | 1845 | 9.5 | |
| 1820 | 11.7 | 1846 | 10.0 | |
| 1821 | 10.1 | 1847 | 10.0 | |
| 1822 | 9.3 | 1848 | 10.0 | |
| 1823 | 9.6 | 1849 | 9.5 | |
| 1824 | 9.6 | 1850 | 9.5 | |
| 1825 | 10.9 | 1851 | 9.2 | |
| 1826 | 10.8 | 1852 | 9.2 | |
| 1827 | 10.9 | 1853 | 9.9 | |
| 1828 | 10.9 | 1854 | 10.7 | |
| 1829 | 10.9 | 1855 | 10.9 | |
| 1830 | 10.4 | 1856 | 11.0 | |
| 1831 | 10.3 | 1857 | 11.0 | |
| 1832 | 10.2 | 1858 | 10.8 | |
| 1833 | 10.2 | 1859 | 10.7 | |
| 1834 | 10.2 | 1860 | 11.0 | |
| 1835 | 10.2 | |||
| 1836 | 10.2 | |||
| 1837 | 10.2 | |||
| 1838 | 11.0 | |||
| 1839 | 11.0 | |||
| 1840 | 11.0 |
The low figures for 1822, 1823, 1824, are not as bad as they seem; in 1822 England had the best wheat harvest since 1779, and the price went down to 4 shillings the bushel.
The above figures per year are simple averages of the numbers per county. A calculation of the average, weighted by agricultural population per county, does not change the figures. One might think that the proportion of the agricultural population per county, as a percentage of the total for England, would have changed during the period, due to different migration movements, but in fact this is not the case:
| Persons employed | Agricultural | |||||
| in agriculture | labourers | |||||
| Census 1801 | Census 1851 | |||||
| Bedford | 19,000 | 1.2% | 18,000 | 1.8% | ||
| Berkshire | 38,000 | 2.4% | 26,000 | 2.5% | ||
| Buckinghamshire | 25,000 | 1.6% | 20,000 | 1.9% | ||
| Cambridge | 28,000 | 1.8% | 26,000 | 2.5% | ||
| Cheshire | 39,000 | 2.5% | 22,000 | 2.1% | ||
| Cornwall | 43,000 | 2.8% | 22,000 | 2.1% | ||
| Cumberland | 21,000 | 1.3% | 11,000 | 1.1% | ||
| Derby | 32,000 | 2.1% | 12,000 | 1.2% | ||
| Devon | 96,000 | 6.2% | 45,000 | 4.4% | ||
| Dorset | 28,000 | 1.8% | 20,000 | 1.9% | ||
| Durham | 18,000 | 1.2% | 10,000 | 1.0% | ||
| Essex | 65,000 | 4.2% | 41,000 | 4.0% | ||
| Gloucester | 49,000 | 3.1% | 28,000 | 2.7% | ||
| Hampshire | 51,000 | 3.3% | 36,000 | 3.5% | ||
| Hereford | 31,000 | 2.0% | 14,000 | 1.4% | ||
| Hertford | 21,000 | 1.3% | 24,000 | 2.3% | ||
| Huntingdon | 10,000 | 0.6% | 9,000 | 0.9% | ||
| Kent | 54,000 | 3.5% | 46,000 | 4.5% | ||
| Lancaster | 52,000 | 3.3% | 36,000 | 3.5% | ||
| Leicester | 24,000 | 1.5% | 17,000 | 1.7% | ||
| Lincoln | 61,000 | 3.9% | 50,000 | 4.9% | ||
| Middlesex | 13,000 | 0.8% | 9,000 | 0.9% | ||
| Monmouth | 13,000 | 0.8% | 8,000 | 0.8% | ||
| Norfolk | 62,000 | 4.0% | 51,000 | 5.0% | ||
| Northampton | 29,000 | 1.9% | 26,000 | 2.5% | ||
| Northumberland | 23,000 | 1.5% | 14,000 | 1.4% | ||
| Nottingham | 24,000 | 1.5% | 20,000 | 1.9% | ||
| Oxford | 33,000 | 2.1% | 22,000 | 2.1% | ||
| Rutland | 4,000 | 0.3% | 3,000 | 0.3% | ||
| Shropshire | 45,000 | 2.9% | 26,000 | 2.5% | ||
| Somerset | 61,000 | 3.9% | 39,000 | 3.8% | ||
| Stafford | 43,000 | 2.8% | 24,000 | 2.3% | ||
| Suffolk | 56,000 | 3.6% | 46,000 | 4.5% | ||
| Surrey | 35,000 | 2.2% | 20,000 | 1.9% | ||
| Sussex | 39,000 | 2.5% | 37,000 | 3.6% | ||
| Warwick | 35,000 | 2.2% | 23,000 | 2.2% | ||
| Westmoreland | 12,000 | 0.8% | 4,000 | 0.4% | ||
| Wiltshire | 54,000 | 3.5% | 33,000 | 3.2% | ||
| Worcester | 39,000 | 2.5% | 16,000 | 1.6% | ||
| York E Rid | 32,000 | 2.1% | 19,000 | 1.8% | ||
| York N Rid | 44,000 | 2.8% | 19,000 | 1.8% | ||
| York W Rid | 56,000 | 3.6% | 36,000 | 3.5% | ||
| 1,557,000 | 100.0% | 1,028,000 | 100.0% | |||
| North | 297,000 | 19.1% | 171,000 | 16.6% | ||
| Midlands | 377,000 | 24.2% | 270,000 | 26.3% | ||
| South West | 459,000 | 29.5% | 251,000 | 24.4% | ||
| South East | 424,000 | 27.2% | 336,000 | 32.7% | ||
| 1,557,000 | 100.0% | 1,028,000 | 100.0% | |||
Census 1801, p. 451, persons employed in agriculture
Census 1851, Statistics of Counties, p 171 et seq., Farm Labourers
These wage figures are very close to those in: Gregory Clark, Farm Wages andLiving Standards in the Industrial Revolution: England, 1670-1850, Appendix 1, Winter Farm Wages by Year, 1670-1851, pp. 28-29 (converted from pence per day to shillings per week):
With respect to the geographical distribution of the wage levels, the wages were considerably higher in the North, and lower in the South West.
| 1824 | 1832 | 1833 | 1837 | 1850 | 1850 | 1860 | 1860 | 1860 | |
| North | 11.7 | 10.4 | 12.0 | 12.2 | 10.7 | 12.6 | 13.4 | 13.9 | 13.8 |
| Midlands | 9.3 | 10.7 | 10.4 | 11.0 | 8.7 | 9.1 | 11.9 | 11.0 | 12.1 |
| South West | 8.4 | 8.5 | 8.6 | 8.5 | 8.4 | 7.1 | 9.6 | 10.1 | 10.0 |
| South East | 9.4 | 10.6 | 10.8 | 10.5 | 8.9 | 8.9 | 11.2 | 10.1 | 11.3 |
| England | 9.5 | 10.1 | 10.2 | 10.3 | 9.0 | 9.5 | 11.3 | 11.0 | 11.6 |
There was not much differentiation in the increase of wages in this period; in the Midlands in 1860 they were 131 % of 1824, and in the other regions around 118 % of 1824.
Index 1824 =100.0, each line
| 1824 | 1832 | 1833 | 1837 | 1850 | 1850 | 1860 | 1860 | 1860 | |
| North | 100.0 | 89.0 | 102.3 | 103.9 | 91.7 | 108.0 | 114.4 | 118.8 | 117.6 |
| Midlands | 100.0 | 115.1 | 112.6 | 119.1 | 94.0 | 98.0 | 128.1 | 119.2 | 131.0 |
| South West | 100.0 | 101.5 | 102.3 | 101.0 | 100.0 | 85.0 | 114.7 | 120.0 | 118.8 |
| South East | 100.0 | 112.4 | 114.4 | 112.0 | 94.6 | 94.7 | 119.4 | 107.3 | 119.9 |
| England | 100.0 | 106.0 | 107.1 | 108.8 | 95.0 | 100.2 | 118.7 | 115.7 | 121.8 |

