From the data as to weekly wages, and as to costs of living, we can now construct the real wages in each year (a figure in the 4th or 8th column which is above 100.0, means that the year was better than 1770):
| Earnings | Expenses | Real Wage | Earnings | Expenses | Real Wage | ||
| 1770 | 100.0 | 100.0 | 100.0 | 1800 | 143.1 | 175.2 | 81.7 |
| 1771 | 101.5 | 103.7 | 97.9 | 1801 | 158.5 | 189.8 | 83.5 |
| 1772 | 101.5 | 112.3 | 90.4 | 1802 | 156.9 | 134.8 | 116.4 |
| 1773 | 101.5 | 110.3 | 92.0 | 1803 | 158.5 | 127.3 | 124.5 |
| 1774 | 101.5 | 104.3 | 97.3 | 1804 | 161.5 | 134.3 | 120.2 |
| 1775 | 101.5 | 105.5 | 96.2 | 1805 | 163.1 | 161.6 | 100.9 |
| 1776 | 101.5 | 93.6 | 108.5 | 1806 | 166.2 | 150.4 | 110.4 |
| 1777 | 101.5 | 102.6 | 98.9 | 1807 | 167.7 | 147.3 | 113.9 |
| 1778 | 107.7 | 99.9 | 107.8 | 1808 | 167.7 | 156.5 | 107.1 |
| 1779 | 107.7 | 91.6 | 117.5 | 1809 | 169.2 | 172.2 | 98.3 |
| 1780 | 107.7 | 85.8 | 125.6 | 1810 | 173.8 | 179.5 | 96.9 |
| 1781 | 107.7 | 98.1 | 109.8 | 1811 | 184.6 | 169.2 | 109.1 |
| 1782 | 107.7 | 102.4 | 105.2 | 1812 | 200.0 | 206.9 | 96.7 |
| 1783 | 107.7 | 105.5 | 102.1 | 1813 | 196.9 | 197.2 | 99.8 |
| 1784 | 107.7 | 101.4 | 106.2 | 1814 | 198.5 | 164.7 | 120.5 |
| 1785 | 107.7 | 97.4 | 110.6 | 1815 | 186.2 | 150.6 | 123.6 |
| 1786 | 107.7 | 94.2 | 114.4 | ||||
| 1787 | 109.2 | 99.0 | 110.4 | ||||
| 1788 | 110.8 | 101.1 | 109.5 | ||||
| 1789 | 112.3 | 104.3 | 107.6 | ||||
| 1790 | 113.8 | 112.2 | 101.4 | ||||
| 1791 | 115.4 | 108.2 | 106.7 | ||||
| 1792 | 115.4 | 106.4 | 108.5 | ||||
| 1793 | 115.4 | 111.0 | 103.9 | ||||
| 1794 | 118.5 | 115.7 | 102.3 | ||||
| 1795 | 136.9 | 139.1 | 98.4 | ||||
| 1796 | 143.1 | 150.3 | 95.2 | ||||
| 1797 | 143.1 | 125.3 | 114.2 | ||||
| 1798 | 141.5 | 122.9 | 115.2 | ||||
| 1799 | 141.5 | 144.2 | 98.1 | ||||
The graphical expression is as follows:
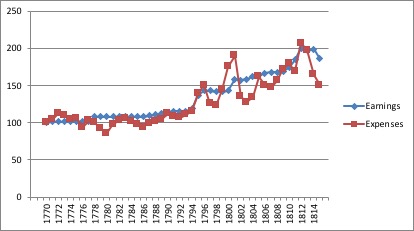
We note that the index of real wage for 1787-1792, which is the range of years commented by the Rev. Davies and his correspondents, is from 105 to 110. This means that the “mental image” that we have of the standard of living in those years, was only exceeded in the following years: 1796-1797, 1802-1804, and 1814-1816. The worst years were 1801-1801, which were 20-25 % below 1787-1792.
| Real Wage | Real Wage | |
| Index Quinq | Clark Quinq | |
| 1770-1774 | 100.0 | 100.0 |
| 1775-1779 | 110.7 | 105.8 |
| 1780-1784 | 114.9 | 111.5 |
| 1785-1789 | 115.6 | 112.4 |
| 1790-1794 | 109.4 | 108.1 |
| 1795-1799 | 109.1 | 106.0 |
| 1800-1804 | 110.2 | 102.7 |
| 1805-1809 | 111.1 | 104.1 |
| 1810-1814 | 109.5 | 105.2 |
| 1790-1794 | ||
| To | ||
| 1810-1814 | 100.0 | 97.3 |

The Clark figures for 1795 to 1809 are a little lower than in this study, as he does not take into account the change to cheaper cereals (barley, rye, oats) in this time-span.
