For the basic data of the percentages of the expenses of a typical agricultural family, we can take the three Cases in Berkshire, identified above.
| Barkham Berkshire Low Case Real 1787 7 persons | Barkham Berkshire Middle Case Real 1787 7 persons | Streatley Berkshire High Case Est. 1787 7 persons | Average | |
| Cereal, bread | 61 | 46 | 43 | 50 |
| Meat, bacon | 6 | 21 | 6 | 9 |
| Cheese | 5 | 2 | ||
| Butter | 3 | 2 | 10 | 5 |
| Sugar | 3 | 2 | 9 | 5 |
| Tea | 3 | 2 | 2 | 2 |
| Milk | 1 | 1 | ||
| Beer | 4 | 2 | ||
| Candle, soap | 6 | 4 | 4 | 5 |
| Cottage rent | 5 | 5 | 6 | 5 |
| Fuel | 2 | 3 | 2 | 3 |
| Clothing | 5 | 9 | 12 | 8 |
| Lying-in, sickness | 6 | 2 | 3 | |
| Total | 100 | 100 | 100 | 100 |
Middle Case: Pig fattened in-house, beer prepared in-house
In defining the sources for the cost figures for each position, it is important to note that these farm workers are still partly in a non-monetary economy, and in many cases do not buy their necessities in shops (cheese, butter, sugar, tea, candles, soap). However, since we do not have detailed yearly cost figures for the purchases made by the labourers, in the following we use the “commercial market” or “large purchaser” figures, and assume that the movements in the costs to the labourers reflect these available data.
Cereal, bread:
The cost basis for farm labourers is that of grain flour, and not of loaves purchased in shops, as practically all the labourers bought flour and baked the loaves in the oven in their cottage.
As discussed in another chapter, the percentages for each period, reflecting the real decisions by the population about consumption of cereals, in function of the movements in prices, should be about:
1760-1779: Wheat 63 %, rye 15 %, barley 12 %, oats 10 %.
1780-1799: Wheat 60 %, rye 10 %, barley 15 %, oats 15 %.
1800-1815: Wheat 40 %, rye 10 %, barley 30 %, oats 20 %.
1816-1825: Wheat 60 %, rye 10 %, barley 15 %, oats 15 %.
This gives the following index numbers per quinquennium, (1770-1774 = 100), with a comparison against Gregory Clark, who uses 50 % wheat for the whole period.
| Cereals | Cereals | |
| index | Clark | |
| 1770-1774 | 100 | 100 |
| 1775-1779 | 86 | 89 |
| 1780-1784 | 89 | 96 |
| 1785-1789 | 88 | 95 |
| 1790-1794 | 101 | 108 |
| 1795-1799 | 131 | 132 |
| 1800-1804 | 147 | 172 |
| 1805-1809 | 146 | 172 |
| 1810-1814 | 173 | 204 |
| 1790-1794 | ||
| to | ||
| 1810-1814 | 171 | 189 |
Meat, bacon:
The agricultural labourers did not eat “butcher’s meat”, that is, fresh beef, pork, or mutton. They either bought salt pork or bacon each week in a butcher’s shop, or they fattened a pig during the year, killed it in December, and salted the pork to keep it in the house during the next year. The assumptions here are: a) 50 % purchased meat, 50 % fattened pig; b) the cost for feeding the pig was 1/3 barley, 1/3 peas, 1/3 beans.
Cheese:
Ex-farm prices
Butter:
Ex-farm prices
Sugar:
Wholesale market prices (the cost presented includes import duty paid).
Tea:
Wholesale market prices (the cost presented includes import duty paid).
Milk:
Sometimes bought in village shops; a certain part of the milk consumed – apart from the breast milk for the baby – was taken from an owned cow, or bought from neighbours with a cow.
Beer:
The beer shown in the family budgets that we have from the beginning of this period, is home-brewed, and the cost is the malt. (We know that the men did drink a certain amount of beer weekly, because we have data as to the numbers of alehouses in the villages, but these figures were not “publicised”!). There was also consumption of beer or cider in the field-work, given free by the farmer, particularly at harvest-time.
The custom of brewing in-house, however, fell into disuse from 1780-1800 onward. Thus for consistency here, and with the period 1815-1860, the cost is taken from the barrel of beer purchased by Greenwich Hospital (plus 25 % sales tax up to 1830).
Candle, soap:
Large consumer Greenwich Hospital.
Cottage rent:
The rent was paid to the landowner (not to the farmer), and the yearly movements in cost were in parallel to the movements in wages. It is logical that the rent was proportional to the wages, as the payment of the rent was made directly out of the money that the labourer had received for the harvest month.
“The rent of cottages is, of course, much varied by their size, situation, and the conveniences attached to them. Where there is land sufficient for the keep of a cow, it is generally 7, 8, or 9 L. per annum; when a garden only is annexed, they usually let for 4 or L. 5 per annum. The rents have, however, been greatly increased within the last ten years; a natural consequence of the general increase which has taken place in the price of labour, throughout the country.”
(Board of Agriculture / Sir Henry Holland, General View of the Agriculture of Cheshire, 1808, p. 86)
“These rents are increasing in proportion to the increase of labour; few good cottages, with a garden, letting now under four pounds, and where a cow can be kept, they are worth from five to eight pounds per annum.”
(Board of Agriculture / John Boys, General View of the Agriculture of the County of Kent, 1805, p. 33)
Fuel:
The fuel – for heating the cottage, cooking the food – could be coals, wood (bought in faggots, collected from the nearby wood or hedges), or peat or turf. The assumption here is 50 % coal, 50 % wood. The price of fuel varied greatly between counties, according to the geographical position relative to the coal mines. (For the use and cost in each country, see the sections “Fuel” in each “General View of the Agriculture …”). The yearly cost was between 10 and 40 shillings per family.
The movements used in the coal price reflect the pithead price in the Northeast coalfields (Gregory Clark and David Jacks, Coal and the Industrial Revolution 1700-1869, http://gpih.ucdavis.edu/files/Clark_Jacks.pdf, Table 1, p. 37), which should be applicable for the inflation in prices at the other mines. It is not correct to take prices in London (e.g. Greenwich Hospital), since these varied a lot, due to the abusive profits by the owners in the Northeast, the costs of the sea voyage from Newcastle to London, and the duty on arriving in London.
The cost of wood etc. is taken to be in proportion to the wages in the country, it was the cost of labour for cutting the faggots, or the time lost (one week) by the labourer in collecting the wood or peat himself.
For the details of cost, collection and usage, consult: Zylberberg, David; Plants and Fossils: Household Fuel Consumption in Hampshire and the West Riding ofYorkshire, 1750-1830, 2014.
Clothing:
It is difficult to calculate the movements in cost of the clothing of the farm workers and their families. In general, they did not buy the clothes ready-made from the shops; rather they bought them second-hand, “handed them down” from one child to a younger child, or made them at home (especially in the North). Thus the best way to estimate a figure (obviously a decrease; that is what the Industrial Revolution was about!), is to make an average of the movements in linen, woollens, and cotton, and also wages of sempstresses.
We know that the cost of clothing was already decreasing, from 1700 to 1775, that is, before the introduction of cotton manufacture:
“The real recompence of labour, the real quantity of the necessaries and conveniences of life ….. has, during the course of the present century increased perhaps in a still greater proportion than in money price. …. The great improvements in the coarser manufactures of both linen and woolen cloth furnish the labourers with cheaper and better cloathing; …”
(Adam Smith, The Wealth of Nations, 1776, Book 1, Chapter 8, On the Wages of Labour)
The data that we have for prices in these materials are:
- Cotton yarn, 100 yards to the pound: 38 shillings in 1786 to 6 s. 9d. in 1807 and (with gap in the data) 3 s. 2 d. in 1829 ((Porter, 1836, Production, p. 212, quoting an article in the Encyclopaedia Britannica);
- Selling price of one piece of calico cloth: 25 shillings in 1814 to 8 shillings in 1825(Baines, 1835, p. 356);
- Cotton cloth Nield: from 40 shillings per piece in 1780 to 12 shillings in 1825 (C. Knick Harley, Prices and Profits in Cotton Textiles during the Industrial Revolution, 2010, http://www.economics.ox.ac.uk/materials/papers/4363/harley81.pdf, Figure 2, p. 8);
- Superfine broadcloth wool: cost of labour from 8 L. 18 s. in 1781 to 4 L 7 s. in 1828 (House of Lords, Hand-loom Weavers, 1840, p. 439);
The approximated value is to 80 % at 1815.
Lying-in, sickness:
This was the cost of medical care in general, nurse for the birth of a baby, official costs for birth, marriage, and burial; also lost daily wages if the worker was sick.
It is calculated with the index equal to the movements in wages.
Sources:
- Prices Greenwich Hospital (McCullogh), 1770-1825;
- Annals of Agriculture, 1785-1792;
- Wheat Prices Windsor, 1595-1789 (Annals of Agriculture, Vol. XIV, 1790);
- Gentleman’s Magazine, 1770-1784;
- Journal Royal Statistical Society, Vol. 1, 1838;
- Victualling Office, 1770-1792 (Annals of Agriculture, Vol. XXVI, 1796);
- British History, John Wade, 1843;
- Thoughts and Details on the High and Low Prices of the Last Thirty Years, Thomas Tooke, 1823, Appendix to Part IV, No. 1;
- State of the Tea Trade, Montgomery Martin, 1832;
- The Farmer’s Magazine, Vol. 8, 1838;
- Sugar and Slavery, Richard B. Sheridan, 1974;
- Coal and the Industrial Revolution 1700-1869, Gregory Clark and David Jacks.
The resulting cost of living indices are:
| Expenses | ||||||
| 1770 | 100.0 | 1800 | 175.2 | |||
| 1771 | 103.7 | 1801 | 189.8 | |||
| 1772 | 112.3 | 1802 | 134.8 | |||
| 1773 | 110.3 | 1803 | 127.3 | |||
| 1774 | 104.3 | 1804 | 134.3 | |||
| 1775 | 105.5 | 1805 | 161.6 | |||
| 1776 | 93.6 | 1806 | 150.4 | |||
| 1777 | 102.6 | 1807 | 147.3 | |||
| 1778 | 99.9 | 1808 | 156.5 | |||
| 1779 | 91.6 | 1809 | 172.2 | |||
| 1780 | 85.8 | 1810 | 179.5 | |||
| 1781 | 98.1 | 1811 | 169.2 | |||
| 1782 | 102.4 | 1812 | 206.9 | |||
| 1783 | 105.5 | 1813 | 197.2 | |||
| 1784 | 101.4 | 1814 | 164.7 | |||
| 1785 | 97.4 | 1815 | 150.6 | |||
| 1786 | 94.2 | |||||
| 1787 | 99.0 | |||||
| 1788 | 101.1 | |||||
| 1789 | 104.3 | |||||
| 1790 | 112.2 | |||||
| 1791 | 108.2 | |||||
| 1792 | 106.4 | |||||
| 1793 | 111.0 | |||||
| 1794 | 115.7 | |||||
| 1795 | 139.1 | |||||
| 1796 | 150.3 | |||||
| 1797 | 125.3 | |||||
| 1798 | 122.9 | |||||
| 1799 | 144.2 |
The total figure for the whole period is slightly lower in this study than in in Clark. This is however a compensation between, especially, higher meat increases, lower sugar and tea increases, and a figure of 80 in this study against 122 according to Clark for clothing. This Clark figure is not explainable, as the textiles decreased in cost in this period, and we know that by the end of the period, the farm labourers and their wives had changed in general to cotton.
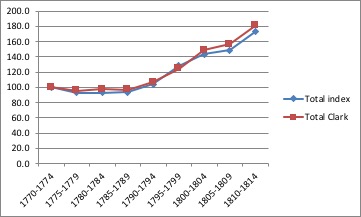
The following table shows the average values in each five-year period, according to the two calculations, on the basis 1770-1774 = 100.0 in both columns.
| Total | Total | |
| Index | Clark | |
| 1770-1774 | 100.0 | 100.0 |
| 1775-1779 | 93.0 | 95.3 |
| 1780-1784 | 93.0 | 97.6 |
| 1785-1789 | 93.5 | 96.9 |
| 1790-1794 | 104.3 | 106.6 |
| 1795-1799 | 128.5 | 124.3 |
| 1800-1804 | 143.5 | 148.4 |
| 1805-1809 | 148.5 | 156.4 |
| 1810-1814 | 172.9 | 180.7 |
| 1790-1794 | ||
| to | ||
| 1810-1814 | 165.8 | 169.5 |
The periods from 1760-1764 to 1790-1794, are practically equal, and for the French Wars / bad harvests period from 1795-1799 to 1810-1815, this calculation gives somewhat lower figures, due in the first place to the reduced proportion of wheat in the food consumption. However, the net movement from 1790-1794 to 1810-1814 is practically the same in the two calculations.
Graphical representation of the two calculations of living costs (1770-1774 =100), by quinquennia: