The agricultural and non-agricultural occupations have to be calculated and analysed separately, as there are a number of differences in wages and in structure of expenses.
Wages
| Agricultural | Non-agricultural | |
| Wage level | Defined by farmers’ incomes, i.e. wheat prices | Defined by negotiations with business owners, or with impersonal market |
| Wages movements in high-inflation periods | Protected from high cereal costs | Not protected |
| Extra payments | Summer wages, harvest wages,task work, gleaning | No extra payments |
| Non-cash benefits | Beer/cider, some cottages free of rent, own collection of wood for fire | None |
Expenses
| Agricultural | Non-agricultural | |
| Proportions food | 50 % cereal, 10 % meat | 25 % cereal, 15 % meat |
| Cereals | Baked in own ovens for bread | Loaves bought in bakers’ shops |
| Meat | No “red meat” | Beef, mutton, pork |
| Pig meat | Pig fattened at cottage, sold, or killed and eaten during the year | Pork meat bought |
| Clothing | Heavy duty | Change to cotton |
The resumed data for the agricultural labourers for the whole period 1770 to 1860, based on the pages above and the previous chapter, are as follows:
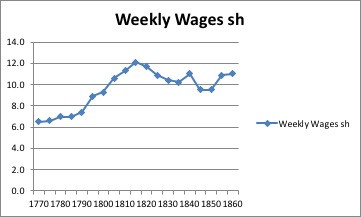
(Average weekly winter wages per man)
The expenses, calculated according to the consumption percentages of an agricultural family, were:

And the wages adjusted for inflation (only the man’s weekly winter wages) increased by only 21 % from 1770 to 1860.
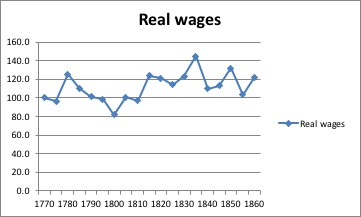
| COMPARISON 1770 TO 1860 AGRICULTURAL WORKERS, WEEKLY WAGES 1770 = 100 WAGES 169 EXPENSES 139 REAL WAGE 121 |
We have to make adjustments from the man’s wage to the total family income:
The “model” for the agricultural families is as follows:
- of the number of adult male workers in the basis data per year, 80 % are men of 20 years or more;
- we suppose that exactly these men are heads of family, and thus this figure gives the number of families;
- the extra income for the man is made up of: 4 months summer wage, 10 % more than the winter wage, 1 month harvest wage at double rate, task work at different percentages during our period;
- for each family, there are proportionally 10 % young men of 16 to 19, who earn a full wage;
- 30 % of families have a son from 12 to 16 years, who earns 30 % of the father’s basic wage;
- starting from 1770, and decreasing to zero in 1820, 80 % of the wives earn 3 shillings a week from spinning;
- starting from 1840, 30 % of the wives work in the fields at 40 % of the man’s basic wage;
- the income of little girls from spinning is negligible;
- the income of little boys working in the fields is negligible.
| Average wage | Average wage | Weekly wage | Bushel wheat | |
| Shillings week | without spinning | Shillings | Shillings | |
| Family | Man | |||
| 1770 | 13.5 | 11.1 | 6.5 | 5.3 |
| 1775 | 13.7 | 11.3 | 6.6 | 6.2 |
| 1780 | 14.0 | 11.9 | 7.0 | 3.8 |
| 1785 | 13.3 | 11.9 | 7.0 | 5.1 |
| 1790 | 13.8 | 12.6 | 7.4 | 6.7 |
| 1795 | 16.2 | 15.2 | 8.9 | 9.1 |
| 1800 | 16.7 | 15.9 | 9.3 | 13.8 |
| 1805 | 17.3 | 17.0 | 10.6 | 10.9 |
| 1810 | 18.4 | 18.2 | 11.3 | 12.9 |
| 1815 | 19.5 | 19.4 | 12.1 | 8.0 |
| 1820 | 18.9 | 18.8 | 11.7 | 8.2 |
| 1825 | 17.5 | 17.5 | 10.9 | 8.3 |
| 1830 | 16.7 | 16.7 | 10.4 | 8.0 |
| 1835 | 16.4 | 16.4 | 10.2 | 4.6 |
| 1840 | 17.4 | 17.4 | 11.0 | 8.3 |
| 1845 | 15.1 | 15.1 | 9.5 | 6.3 |
| 1850 | 15.2 | 15.2 | 9.5 | 5.0 |
| 1855 | 17.3 | 17.3 | 10.9 | 9.3 |
| 1860 | 17.5 | 17.5 | 11.0 | 6.8 |

The above figures as to the man’s wages and the family’s wages, show an increase in real wages of only about 20 % from 1770 to 1860. But it must be taken into account that the wage figures start from a high position. The family income in 1770, including spinning, was 13 shillings per week, which could purchase 2.6 bushels of wheat.
| COMPARISON 1770 TO 1860 AGRICULTURAL WORKERS TOTAL FAMILY, WITHOUT SPINNING 1770 = 100 WAGES 158 EXPENSES. 139 REAL WAGES 114 |
| COMPARISON 1770 TO 1860 AGRICULTURAL WORKERS TOTAL FAMILY, WITH SPINNING 1770 = 100 WAGES 130 EXPENSES. 139 REAL WAGES 94 |
