“In examining factories, we have frequently asked, “Where are the old men?” In fact, our towns and manufactures present but a small proportion of the aged,- no such proportion as we can find in the pursuits of husbandry. In the employments, moreover, which do present a considerable number of old workmen – weaving for instance – these individuals are by no means robust. They are vastly inferior in strength and appearance to old peasants. Though life may be protracted, it is not full life. On the whole, our inquiries shew that some artizans are cut off by severe maladies; but that the majority have their constitutions so impaired by premature labour, or by intemperance, that they fall under comparatively slight attacks of disease, – attacks, – which the constitutions of countrymen would resist.”
(Thackrah, 2nd. ed., 1832, pp. 203-205)
A number of industries caused specific damage to the worker. Bent or sitting position (weavers, tailors, shoemakers), or continuous standing position; great muscular efforts; high temperatures in the workplace; dust or poisonous gases in the air, affecting the lungs; poisonous substances taken in through the skin (solution of lead, mercury); dust affecting the eyes; noise from machinery, causing deafness. In general, these were caused by the new activities in industry; working on the farms, or working individually as a spinner or weaver could not cause this type of afflictions.
(Thackrah, 2nd. ed., 1832, pp. 192-199)
“Deformity, as an occasional result of manufactures, we must briefly notice. In manufacturing districts we frequently see not very marked deformity, but such a degree as to affect the figure and capability of motion. Many operatives have an absolute defectof motion. The smaller muscles only are brought into full activity. The limbs consequently, and especially in the growing youth, take the form which is induced by the weight of the body and the posture required in the employ. The spine evidently suffers. Wanting the action of its extensor muscles, it falls into curves, and these, by altering more or less the situation of the upper extremities, produce decided deformity. Such is the natural result of defect of muscular exertion. But many operatives have an excess. In some of these, however, this excess is partial. One set of muscles is immoderately and almost constantly exerted, while another wastes for want of action.”
(Refers to all sorts of manufacture, not solely textiles)
(Thackrah, 1832, p. 207)
According to the Assistant Commissioner, Mr. Tufnell, the causes of deformities in the cotton industry had disappeared by 1833:
“All the seriously-deformed persons who were sent to me were adults; nor did a single case of a child badly deformed come under my notice. The reason is this; many years ago it was the practice to work much longer hours than at present, and several persons who were injured by overwork at that time may be met with. But a far more potent reason for deformity being so much less frequent now than formerly is the disuse of the old spinning frame, which was made low for many years after its invention by Arkwright that many thousand persons were deformed by working at it, before the invention of the throstle-machinery.”
(Factories Inquiry Commission, Supplementary Report … as to the Employment of Children in Factories, 1834, Part I, Mr. Tufnell’s Report from Lancashire, p. 200)
Sallow faces
There are a number of descriptions of the Lancashire cotton workers, referring to their sallow skin, low stature and thin body, sharp features of the face, and the skin being tight on the muscles and bones:
“The bad effects of the cotton business have already appeared in the pale sallow complexions of the people in it and some young tender constitutions have already fallen sacrifice to it. Whether this is to be attributed to some pernicious effluvia arising from the [cotton-]wool, or the smaller fussy particles of it flying about during their work and drawn into the lungs by respiration, or the attitude or action of the spinner who is obliged to lean upon his breast or stomach, or the close confinement in the crowded rooms where they suck in corrupted putrid air, or as in such numbers of men and women assembled together in this employment.”
(Samuel Finney, An Historical Survey of the Parish of Wilmslow, 1785, National Trust, Quarry Bank, Source 67)
“These artizans are frequently subject to a disease, in which the sensibility of the stomach and bowels is morbidly excited; the alvine secretions [solid excrements] are deranged, and the appetite impaired. Whilst this state continues, the patient loses flesh, his features are sharpened, the skin becomes pale, leaden coloured, or of the yellow hue which is observed in those who have suffered from the influence of tropical climates.”
(Kay, 1832, pp. 11-12)
“It is perfectly true that the Manchester people have a sickly, pallid appearance; but this is certainly not attributable to factory labour, for two reasons; first, because those who do not work in factories are equally pallid and unhealthy-looking with those that do, and the sick society returns show that the physical condition of the latter is not inferior:- secondly, because the health of those engaged in country cotton factories, which generally work longer than town ones, is not injured even in appearance. … Mr. Wolstenholme, surgeon at Bolton, says that “the health of factory people is much better than their pallid appearance would indicate to any person not intimately acquainted with them”.”
(Factories Inquiry Commission, Supplementary Report … as to the Employment of Children in Factories, 1834, Part I, Mr. Tufnell’s Report from Lancashire, p. 198)
“The Physical Appearance of Factory Workers
“Of course the air in which they work exercises a marked effect upon the appearance of the people. This is a subject which I shall treat of at length later; but I may be here permitted to remark upon the more obvious physical characteristics of carders, spinners and weavers. In the first place I do not remember seeing one male or female adult to whom I would apply the epithet of a “stout” man or woman. There is certainly no superfluity of flesh in the factories. When I say this I do not by any means intend to insinuate that the people are unhealthy or unnaturally lean; they are generally thin and spare but not emaciated. By such occupation as is afforded in the various branches of cotton spinning, much muscle cannot be expected to be developed. There is no demand for it – the toil does not require it – it would be useless if it existed. I cannot therefore term the appearance of the people “robust”. They present no indication of what is called “rude” health. They are spare, and generally – so far as I can judge – rather undersized. At the same time their appearance cannot rightly be called sickly. Their movements are quick and easy, with nothing at all of langour expressed either in face or limbs. The hue of the skin is the least favourable characteristic. It is a tallowy-yellow. The faces which surround you in a factory are, for the most part lively in character, but cadaverous and overspread by a sort of unpleasant greasy pallor.”
(Razzell, Wainwright, 2014, Selections from the Morning Chronicle, Manchester, report from 1850)
“One of the first things that strikes a visitor is the large number of women and girls at work compared with men. Recent statisticians quote the number of women employed in textile industries as 867,000, and over 300,000 of these are workers in the Lancashire and Cheshire mills. To see these women at work at the factories is a somewhat depressing spectacle. Most of them are languid, expressionless, anaemic; many are mere children, “half-timers” of from 12 to 14, or “young persons” of from 14 to 17 years of age. The younger girls are under-sized, sallow and anaemic; the older women bear the marks of excessive strain in their thin, worn faces. Nearly 40 per cent. of the women workers in factories are married women. Both the older women and the girl workers look insufficiently fed; they look as if they never breathed fresh air; they look cheerless and sad.”
There has been no investigation as to the causes of this state of the workers. This abnormal bodily constitution of the workers was not due to insufficient food, nor toexcessive work. We can see this, as the condition still subsisted in 1910. It probably was due to conditions of poor ventilation in the factories.
A particular illness caused by work in the cotton and flax mills, was the “spinners’ phthisis” [phthisis = consumption, present = pulmonary tuberculosis], described by Dr. Kay, and commented by Dr. Thackrah, and caused by the dust in the air, in the rooms where the cotton/flax was prepared for the spinning process This was an inflammation of the bronchial membrane, which led in the long term to difficulty in breathing, and sometimes caused the man to be incapable of work. It still exists, and is now known as “byssinosis”.
(Thackrah, 2nd. ed., 1832, p. 147)
In Manchester in particular, there was pollution in the rivers, from ash, cinders, chemical wasters, pig excrements from upstream; the water for drinking was black from the coal particles in the air.
In general, there was damage to the people from human waste, smoke, industrial waste, slag heaps, noise of the machinery, chronic health problems, mental illness, and reproductive problems of the women. The worst cases were in the Black Country.
Many women and girls who worked in lace, after a number of years were functionally blind.
“We scarcely need remark that the air of a large town is always in an unnatural state. The excess indeed of carbonic acid gas is said to be very trifling; but our skins and linen prove an abundant admixture of charcoal itself. Ammoniacal and other vapours from manufactories, sewers, and places of refuse add to the general impurity. This state of atmosphere affects, in a greater or less degree, all the inhabitants. The complexion is pallid; and the tongue shows that digestion is disordered and imperfect. I should think that not 10 per cent. of the inhabitants of large towns enjoy full health.”
(Thackrah, 1832, pp. 23-24)
The worst environmental problem was that of the coal smoke from the stationary steam engines in the textile mills.
In order to investigate if there was an increase in mortality – and thus a decrease in life expectancy – due to the Industrial Revolution, we have to collect population, birth and death data for the years up to e.g. 1830, and compare these with those of 1830 to 1860. The Census data were collected for 1801, 1811, …, and are reliable. As to the births and deaths, for the years 1801 to 1841 we have “Parish-Register” numbers with a detail level per Township or per Hundred; starting from 1837 we have the numbers collected by the new procedures of the Registrar-General with a detail per Registration District.
The challenge is to “knit together” the births/deaths from up to 1841 with those starting in 1837, as they may well have been collected with different premises.
The totals per every ten years for England and Wales are the following:
Year
Population England and Wales
Baptisms/ Births
Burials/ Deaths
Birth Rate %
Death Rate %
Population Per Burial
1760
6,736,000
187,000
156,000
2.77
2.32
43.1
1770
7,428,000
207,000
174,000
2.78
2.34
42.6
1780
7,953,000
222,000
192,000
2.79
2.41
41.4
1790
8,675,000
249,000
179,000
2.87
2.06
48.5
1801
8,873,000
237,000
204,000
2.67
2.30
43.5
1811
10,150,000
304,000
189,000
3.00
1.86
53.7
1821
11,979,000
355,000
212,000
2.96
1.77
56.5
1831
13,897,000
382,000
254,000
2.75
1.83
54.7
1841
15,856,000
520,000
343,000
3.28
2.16
46.2
1851
17,982,000
615,000
395,000
3.42
2.20
45.5
1861
20,061,000
696,000
435,000
3.47
2.17
46.1
1871
22,712,000
797,000
515,000
3.51
2.27
44.1
The figures for 1760 to 1790 are “best estimates” in 1760-1800, Marshall, 1832, p. 61 (Baptisms and Burials). The figures of Population are taken from the Census of each prescribed year, and the Births and Deaths from Parish Register Returns and from Annual Reports of the Registrar-General.
The improvement in the “value of life” (population divided by burials) from 1760/1801 to 1811/1831 was known and accepted at the time. “Showing in this respect a continually diminishing mortality. This effect, so strongly indicative of amendment in the condition of the people, must be attributed to the concurrence of various causes. Among these may be mentioned, the less crowded state of our dwellings; the command of better kinds of food and medical assistance; the superiority and cheapness of clothing; and probably also, more temperate habits and greater personal cleanliness. One influential cause of the diminished mortality will be found in the introduction of vaccination, which has had so powerful an effect in diminishing the rate of mortality among children; besides which, the extensive surface drainage which has been going forward in those parts of the country which, owing to the presence of stagnant waters, were once productive of intermittent fever, has added to the general healthiness of the country.”
(George Porter, Head of the Statistical Department at the Board of Trade, Progress of the Nation, 1836, Vol. 1. Section 1, Population, p. 19)
We see that there is a large “jump” from 1831 to 1841; actually this took place from 1836 to 1838. The “jump” is not real. One problem was that the children who died before baptism were not registered in the local church as “born” and also not as “died”. The second situation was that before 1837 the “Non-Parochial Registers” (births and deaths), which were in general of non-conformist persons, were not all included in the Anglican Parish reports (the majority were included), and thus the number reported was too low. In 1837 the Marriage and Registration Act was passed to regulate all the information about marriages, births and deaths under the supervision of a Registrar-General. The third exception was that of military or civil persons who died abroad or at sea. From 1837, the only missing data of marriages, births and deaths were those of individual persons who decided not to inform the authorities.
Mr. Rickman (of the Census) and Dr. Farr (of the Public Records Office) were conscious of the problem of under-registration before 1837. There is a calculation made in 1835 by a Mr. Edmonds, statistician, using data from the Population Returns of 1831, in which he estimates a missing amount of 40 % in births and 20 % in deaths (Edmonds, T. R.; On the Mortality of the People of England; The Lancet, Volume 24, Issue 614, June 06, 1835, pp. 310-316; https://doi.org/10.1016/S0140-6736(02)97790-1). Mr. Finlaison, the Actuary in the National Debt Office, calculated in 1839 that, based on the real numbers in the two systems, that the Parish-Register numbers for births and deaths should be increased by 18 % (Porter, 1846, p. 29).
If we increase the official figures for births and deaths before 1837 by 18 %, we have the following corrected figures:
Year
Population England and Wales
Baptisms/ Births
Burials/ Deaths
Birth Rate %
Death Rate %
Population Per Burial
1760
6,736,000
221,000
184,000
3.28
2.73
36.6
1770
7,428,000
244,000
205,000
3.28
2.76
36.2
1780
7,953,000
262,000
227,000
3.29
2.85
35.0
1790
8,675,000
294,000
211,000
3.39
2.43
41.1
1801
8,873,000
322,000
216,000
3.62
2.43
41.1
1811
10,150,000
359,000
223,000
3.54
2.20
45.5
1821
11,979,000
419,000
250,000
3.50
2.09
47.9
1831
13,897,000
451,000
300,000
3.24
2.16
46.3
1841
15,856,000
520,000
343,000
3.28
2.16
46.2
1851
17,982,000
615,000
395,000
3.42
2.20
45.5
1861
20,061,000
696,000
435,000
3.47
2.17
46.1
1871
22,712,000
797,000
515,000
3.51
2.27
44.1
With these assumptions (for example), there is practically no movement from 1831 to 1841.
Thus, as a general statement, the Industrial Revolution in its wider sense did not increase the per cent death rate in England and Wales from 1801 to 1861.
Death Rates in Industrial Towns 1800-1820 and 1820-1840
There is a hypothesis, that after an improvement in the death rate of the northern industrial towns in 1800-1820 against previous decades, these towns suffered a mortality crisis in 1820-1840.
Luckily, we have some tables from the 1830 Census and Parish Returns, which answer this doubt with considerable accuracy. The data show us the value of life, that is number of the population divided by the burials (i.e. the reciprocal of our “death rate”) for each year from 1801 to 1830, for the total of the county of Lancashire and for the total of the county of the West Riding, and which thus include all of the industrializing towns:
(Census 1831, Answers and Returns, Parish Register Abstract, p. 157 and p. 408)
It was also possible to find the data of burials for each year from 1831 to 1840 from the Census and Abstract of 1841.
The burials are under-registered by about 18 %, and show an average of the industralised regions and the rural regions. Although they are not correct in absolute terms, they are consistent in the definitions.
Now we convert the numbers to “death rates” as a percentage, and express them as a graph:
By way of interpretation, a movement of from e.g. 1.50 % to 1.60 % would correspond to an increase in yearly deaths in Lancashire from 15,600 to 16,600. It is highly probable that the increase in Lancashire in the period 1822 to 1830 – but not in the West Riding – shows deaths among the domestic hand-loom weavers (the worst-hit were in the rural North of Lancashire).
We also have evidence of the yearly burials in the decade of the 1830’s in: Preston, Rochdale, Bury, Bolton, Wigan, Prescott, Warrington, Sheffield, Wakefield, Huddersfield, Halifax, Bradford. In no case was the increase from 1831 to 1840 more than 25 %; all the towns were growing. The death rate of e.g. Wigan was 2.48 % in 1831 and 2.67 % in 1840. (We do not have figures from earlier decades, as the reports were made out for larger geographical regions).
(HISTPOP.ORG – Browse > Parish register abstract, England and Wales, 1841, Page 109)
(HISTPOP.ORG – Browse > Parish register abstract, England and Wales, 1841, Page 114)
The editors of the report on “Great Towns” made an approximate calculation of the “cost” of urbanization. They compared the real number of deaths in the large industrial towns with a theoretical number on the basis of an “ideal” death rate of 2.0 % (the normal rate for agricultural counties). The “penalty” was 60,000 excess deaths in the whole country in the 3 years 1841-1843 (p. xlviii, see last number, below, right).
For large towns in the period 1801 to 1841, your author has been able to find yearly data of births and deaths in the “Abstracts of Parish Registers” for 1811, 1821, 1831, and 1841. The following population numbers are from the Census of 1801, 1811, 1821, 1831, and 1841, with interpolations per year by this author. The editors of the data inform that they have collected a large number of documents of “Dissenters”.
Manchester, Township
Persons
Births
Burials
Birth Rate %
Burial Rate %
1801
70,000
2,655
2,528 Insuff. Harvest
3.79
3.61
1802
70,900
3,484
2,146 Insuff. Harvest
4.91
3.40
1803
71,800
4,210
1,914
5.86
2.66
1804
72,700
3,996
1,451
5.49
2.00
1805
73,600
3,763
1,697
5.11
2.30
1806
74,500
3,605
1,591
4.83
2.13
1807
75,400
3,566
1,503
4.73
1.99
1808
76,300
3,376
1,245
4.42
1.63
1809
77,200
3,096
1,473
4.01
1.91
1810
78,100
3,015
1,320
3.86
1.69
1811
79,000
3,238
1,183
4.10
1.50
1812
81,500
2,925
1,493
3.59
1.83
1813
84,000
2,901
1,569
3.45
1.87
1814
86,500
2,887
1,539
3.33
1.78
1815
88,000
3,442
1,431
3.91
1.63
1816
91,000
3,020
1,690
3.32
1.86
1817
94,000
3,155
1,815
3.36
1.93
1818
97,500
3,181
2,450
3.26
2.51
1819
101,000
3,376
1,878
3.34
1.85
1820
104,500
3,405
1,815
3.25
1.74
1821
108,000
3,453
3,327
3.26
3.08
1822
111,000
4,136
3,378
3.72
3.04
1823
114,000
3,736
4,809
3.27
4.22
1824
117,000
3,835
4,713
3.27
4.03
1825
120,000
4,788
4,969
3.99
4.14
1826
123,000
4,791
5,515
3.89
4.48
1827
126,000
4,901
4,888
3.89
3.88
1828
130,000
5,056
5,780
3.89
4.44
1829
134,000
4,931
5,231
3.67
3.90
1830
138,000
5,209
6,016
3.77
4.35
1831
142,000
6,573
N/A
4.63
1832
146,000
6,748
N/A
4.62
1833
150,000
6,958
N/A
4.64
1834
154,000
7,583
N/A
4.92
1835
159,000
7,505
N/A
4.72
1836
164,000
7,757
N/A
4.73
1837
169,000
N/A
N/A
1838
175,000
6,668
N/A
3.81
1839
181,000
6,779
N/A
3.74
1840
186,000
6,443
N/A
3.46
1841
192,000
The figures of burials for 1831 to 1840 given in the Parish Register data are clearly too low; the persons were buried in “overflow” cemeteries, and not correctly registered in the parish church (Collegiate Church). This had happened in the 1810’s, and was later corrected; although apparently not in the figures shown above. (Census 1831, Parish Register Abstract, County of Lancaster, Proportion of Burials to the Population 1801-1830, p. 157)
Liverpool, parish only
Year
Persons
Births
Burials
Birth Rate %
Death Rate %
1801
75,000
2,625
3,464 Insuff. Harvest
3.50
4.62
1802
78,000
2,975
2,287 Insuff. Harvest
3.81
2.93
1803
79,500
3,114
2,209
3.92
2.78
1804
81,000
3,246
2,178
4.01
2.69
1805
82,500
3,342
2,580
4.05
3.13
1806
84,000
3,692
2,173
4.39
2.59
1807
85,000
3,788
2,509
4.46
2.95
1808
86,500
3,591
2,447
4.15
2.82
1809
88,000
3,609
2,452
4.10
2.79
1810
90,000
3,894
3,132
4.33
3.48
1811
92,000
3,965
2,822
4.30
3.07
1812
94,000
3,719
2,340
3.96
2.49
1813
96,000
3,380
2,352
3.52
2.45
1814
98,000
3,690
2,465
3.76
2.52
1815
100,000
3,891
3,030
3.89
3.05
1816
103,000
4,083
2,812
3.96
2.73
1817
106,000
4,499
2,489
4.24
2.35
1818
109,000
4,290
3,416
3.94
3.13
1819
112,000
4,932
3,011
4.40
2.69
1820
115,000
4,540
2,944
3.95
2.56
1821
119,000
4,490
3,267
3.77
2.74
1822
123,000
4,614
3,187
3.75
2.59
1823
127,000
4,851
3,358
3.82
2.64
1824
131,000
5,112
3,933
3.90
3.00
1825
135,000
6,226
3,745
4.61
2.77
1826
139,000
6,589
4,555
4.74
3.28
1827
144,000
6,612
4,202
4.59
2.92
1828
149,000
6,878
3,787
4.62
2.54
1829
154,000
6,838
3,728
4.44
2.42
1830
160,000
7,280
3,620
4.55
2.26
1831
165,000
7,867
5,044
4.77
3.06
1832
171,000
7,767
5,866 Cholera
4.54
3.43
1833
177,000
7,756
5,225
4.38
2.95
1834
183,000
8,145
5,881
4.45
3.21
1835
189,000
8,556
4,740
4.52
2.50
1836
195,000
8,759
5,296
4.49
2.72
1837
201,000
9,388
6,875
4.67
3.42
1841
224,000
(The data for 1832 to 1837 are taken from the Bills of Mortality in “The Stranger in Liverpool», which are very close to the Parish-Registers for the years before 1832)
Leeds, town and out-townships
Persons
Births
Burials
Birth Rate %
Death Rate %
1801
53,200
1,544
1,622 Insuff. Harvest
2.90
3.04
1802
54,100
1,886
1,393
3.48
2.57
1803
55,000
2,046
1,759
3.72
3.20
1804
55,900
2,094
1,186
3.74
2.12
1805
56,800
2,041
1,348
3.59
2.37
1806
57,700
1,996
1,745
3.46
3.02
1807
58,600
2,121
1,274
3.62
2.17
1808
59,700
2,124
1,225
3.55
2.05
1809
60,700
1,954
1,249
3.21
2.06
1810
61,700
2,077
1,571
3.36
2.54
1811
62,700
2,051
1,217
3.27
1.94
1812
64,200
1,918
1,331
2.99
2.07
1813
65,700
2,033
1,375
3.09
2.09
1814
67,200
2,001
1,442
2.98
2.14
1815
69,400
2,454
1,481
3.53
2.13
1816
71,400
2,386
1,360
3.34
1.90
1817
73,400
2,467
1,757
3.36
2.39
1818
75,400
2,462
2,012
3.26
2.66
1819
77,400
2,582
1,653
3.33
2.13
1820
80,400
2,491
1,546
3.10
1.92
1821
83,900
2,741
1,741
3.26
2.08
1822
87,900
2,905
1,933
3.30
2.20
1823
92,000
3,021
2,326
3.28
2.53
1824
96,000
3,001
2,081
3.12
2.17
1825
100,000
3,178
2,471
3.18
2.47
1826
104,000
3,101
2,897
2.98
2.78
1827
108,000
3,182
1,949
2.94
1.80
1828
111,500
3,397
2,946
3.05
2.64
1829
115,500
3,225
2,425
2.79
2.10
1830
119,500
3,266
2,530
2.73
2.11
1831
123,500
3,776
3,494
3.06
2.83
1832
127,500
3,591
3,701
2.82
2.90
1833
131,500
4,022
3,284
3.06
2.50
1834
135,000
4,059
3,387
3.00
2.51
1835
139,500
4,308
3,054
3.09
2.19
1836
143,500
4,593
3,375
3.20
2.35
1837
148,000
4,855
3,912
3.28
2.64
1838
153,000
3,569
3,387
2.33
2.21
1839
158,000
3,593
3,327
2.27
2.10
1840
163,000
3,420
3,404
2.09
2.09
1841
168,000
Although the birth and death rates may be too low in absolute terms, as explained at the beginning of this chapter, in relative terms there is no sign of an abnormal increase in deaths in the period.We cannot find a possible negative effect from industrialization or from worsening of sanitation/housing. The numbers at the end of the period are around 3.5 % p.a. for births and 2.5 % p.a. for deaths.
We now give the numbers of births and deaths collected with the new system of the Registrar-General, starting in July 1837.
These numbers below refer to the whole conurbation in each case. Particularly in the case of Manchester, we know that the better class of workers from 1825 moved to new housing areas in Hulme and Chorlton. It would not be correct to use only Manchester Township, and thus have birth/death data from only the poorer workers.
We need to show that the 1837 data are consistent in their values from those of 1831, and we do have reasonable evidence:
We see that the absolute numbers from the years up to 1831 are 3.5 % p.a. for births and 2.5 % p.a. for deaths; the numbers for the first years from 1837 are 3.5 % to 4.0 % for births and 2.5 % to 3.0 % for deaths.
For Liverpool, we do have a direct connection in the year 1837: the parish registers give around 4.5 % and 3.0 %, and the Registrar-General gives around 3.5 % and 3.0 %.
Mr. George Porter compares the yearly statistics of deaths from 1801 to 1831 from the Parish Registrars, with an annual average for 1831 to 1841 calculated by the Census Commissioners, and finds them to be practically equal; that is, the real facts did not changefrom year to year (Porter, 1847, Population, p. 29).
Manchester, Salford, Chorlton
Persons
Births
Burials
Birth Rate %
Death Rate %
1838- 1839 (+)
340,000
10,700
9,276
3.14
2.73
1839- 1840 (+)
348,000
10,192
8,667
2.93
2.49
1841
356,000
14,051
10,378
3.94
2.91
1842
365,000
13,857
10,748
3.80
2.94
1843
374,000
14,109
11,057
3.77
2.96
1844
383,000
15,194
10,470
3.96
2.73
1845
393,000
15,802
10,898
4.02
2.77
1846
403,000
16,758
14,095 Typhus
4.16
3.50
1847
413,000
15,482
15,114 Typhus
3.75
3.66
1848
423,000
14,949
13,841
3.53
3.27
1849
433,000
16,686
14,426
3.85
3.33
1850
443,000
14,403
11,383
3.25
2.56
1851
453,000
17,570
11,855
3.88
2.62
1852
459,000
14,268
13,828
3.10
3.01
1853
465,000
18,644
13,821
4.01
2.97
1854
471,000
18,862
13,953
4.00
2.96
1855
477,000
18,508
13,803
3.88
2.89
1856
482,000
17,357
12,356
3.60
2.56
1857
487,000
18,697
13,643
3.83
2.80
1858
492,000
17,398
14,947
3.53
3.04
1859
497,000
19,093
13,136
3.84
2.64
1860
504,000
18,442
12,993
3.66
2.58
1861
512,000
19,923
13,858
3.89
2.71
1862
518,000
20,122
14,187
3.88
2.74
1863
524,000
20,165
15,785
3.84
3.01
1864
530,000
19,768
15,100
3.73
2.85
1865
537,000
20,275
17,041
3.78
3.17
1866
544,000
20,702
17,218 Cholera
3.80
3.16
1867
552,000
21,453
17,016 Scarlatina
3.88
3.08
1868
560,000
22,298
17,784 Scarlatina
3.98
3.17
1869
568,000
21,835
16,363
3.84
2.88
1870
576,000
22,480
16,226
3.90
2.82
1871
585,000
(+) Only Manchester plus Salford
Liverpool and West Derby
Persons
Births
Burials
Birth Rate %
Death Rate %
1838- 1839
298,000
9,603
8,467
3.22
2.84
1839- 1840
306,000
9,925
9,990
3.24
3.26
1841
314,000
10,805
9,758
3.44
3.10
1842
323,000
12,428
9,785
3.84
3.03
1843
332,000
12,756
9,767
3.84
2.94
1844
342,000
13,057
10,200
3.81
2.98
1845
352,000
14,273
9,929
4.05
2.82
1846
362,000
15,440
13,537 Typhus
4.26
3.73
1847
372,000
15,469
21,570 Typhus + Irish
4.15
5.79
1848
382,000
15,456
13,163
4.04
3.44
1849
392,000
14,237
18,700 Cholera
3.63
4.77
1850
402,000
14,441
10,822
3.59
2.69
1851
412,000
14,815
12,550
3.60
3.04
1852
420,000
13,676
12,067
3.25
2.87
1853
428,000
14,333
11,852
3.34
2.77
1854
436,000
15,666
14,797 Cholera
3.59
3.43
1855
444,000
15,994
13,271 Cholera
3.66
2.99
1856
452,000
16,539
12,363
3.65
2.73
1857
460,000
16,790
13,138
3.65
2.86
1858
478,000
16,734
14,781
3.50
3.10
1859
476,000
16,682
12,718
3.50
2.67
1860
483,000
16,246
13,206
3.36
2.73
1861
490,000
16,989
13,964
3.46
2.85
1862
498,000
19,222
14,747
3.86
2.96
1863
506,000
18,430
16,536
3.64
3.26
1864
512,000
21,029
18,562
4.10
3.63
1865
521,000
21,689
18,895
4.20
3.63
1866
530,000
21,585
22,250 Cholera
4.12
4.20
1867
539,000
22,366
16,260
4.15
3.02
1868
549,000
22,192
16,785
4.04
3.06
1869
560,000
21,481
16,652
3.83
2.97
1870
570,000
22,052
18,386
3.87
3.22
1871
581,000
Leeds, town and out-townships
Persons
Births
Burials
Birth Rate %
Death Rate %
1838-1839
164,000
6,175
4,690
3.76
2.86
1839-1840
166,000
6,664
4,209
4.01
2.53
1841
168,000
6,696
4,361
3.99
2.60
1842
170,000
6,376
4,612
3.75
2.71
1843
172,000
6,126
4,335
3.56
2.52
1844
174,000
6,584
4,124
3.78
2.37
1845
176,000
6,653
4,239
3.78
2.40
1846
178,000
6,882
4,529
3.86
2.54
1847 (*)
180,000
6,325
5,693
3.51
3.16
1848
182,000
6,760
4,860
3.71
2.67
1849
184,000
6,612
7,274 Cholera
3.59
3.95
1850
186,000
6,936
4,530
3.73
2.43
1851
189,000
7,232
5,477
3.82
2.90
1852
192,000
8,072
5,950
4.20
3.10
1853
195,000
7,686
5,009
3.94
2.57
1854
198,000
8,011
5,544
4.04
2.80
1855
202,000
8,114
5,594
4.02
2.77
1856
206,000
7,049
4,924
3.42
2.39
1857
210,000
8,208
5,360
3.91
2.55
1858
214,000
8,088
5,760
3.78
2.69
1859
218,000
8,366
5,401
3.83
2.48
1860
222,000
8,704
6,008
3.92
2.71
1861
226,000
8,733
6,217
3.86
2.75
1862
230,000
9,138
5,882
3.97
2.55
1863
234,000
9,350
7,052
3.99
3.01
1864
238,000
9,702
6,595
4.07
2.77
1865
243,000
10,418
7,314
4.29
3.01
1866
248,000
10,647
7,757
4.29
3.12
1867
253,000
10,981
6,571
4.34
2.60
1868
259,000
10,839
7,110
4.18
2.74
1869
265,000
10,774
7,309
4.06
2.75
1870
270,000
11,134
7,750
4.12
2.87
1871
275,000
(*) District divided into: Leeds, Hunsley
Also here, we see that there is no clear increase or decrease in birth/death rates. This gives us the surprising conclusion that industrialization and the undeniable worsening of housing and sanitation, did not have any effect on the quantity of deaths. The probable explanation is that these changes made life very difficult, but did not kill people.
The case of Leeds is clear. In 1821, the town was “livable”, and the Township had 48,000 inhabitants. In 1841, the town had extreme housing overcrowding, inexistent sanitary arrangements in the working-class areas (as described in the Report on Large Towns), and the Township population had nearly doubled to 88,000. Death rate for years around 1821 = 2.20, but with 18 % adjustment gives 2.60; death rate for years around 1841 = 2.60.
We also do not see any decrement in the deaths in Liverpool in the years 1860-1870, which we might have expected due to the considerable public works of 1850-1870 in cleaning the sanitary installations, and removing people from cellar dwellings.
The case of the movement of the better class of workers, shopkeepers, and mechanics from the Township of Manchester to the new suburb of Hulme in 1825 to 1860 is also illustrative. Hulme was laid out on a rectangular plan, the streets were wide, the houses were new and had an own privy in the back-yard, there were no inhabited cellars, the inhabitants were of decent occupations, and the suburb did not have any factories – with coal smoke – nearby. But in 1842, when the Manchester death rate was 3.35 %, the death rate in Hulme was only slightly less at 2.96 (Second Report on the State of Large Towns, 1845, Appendix, pp. 106-116).
Average age of persons living
The widely quoted phrase “the average worker in Liverpool lived only 15 years” seem to give the idea that if we walk along the street or visit a place of work in Liverpool in 1844, we would see only teenagers. This is/was not true. The real distribution by age of persons in the population is given by the following tables. We see that of those persons who are above 10 years of age, they are fairly equally distributed from the age of 10 to the age of 50.
Comparison of proportions of ages of persons living, Census 1821 and Census 1841:
Age
1821
1821
1841
1841
Persons
Per cent
Persons
Per cent
< 5
1,782,000
14.9
2,099,000
13.2
5-9
1,565,000
13.1
1,898,000
12.0
10-14
1,334,000
11.1
1,726,000
10.9
15-19
1,189,000
10.0
1,581,000
10.0
20-29
1,886,000
15.7
2,822,000
17.7
30-39
1,415,000
11.8
2,043,000
12.9
40-49
1,119,000
9.3
1,520,000
9.6
50-59
790,000
6.6
1,022,000
6.5
60-69
547,000
4.6
697,000
4.4
70-79
273,000
2.3
342,000
2.2
80-89
75,000
0.6
94,000
0.6
90-99
6,000
0.0
7,000
0.0
11,981,000
100.0
15,907,000
100.0
(1821: Porter, 1844; 1841: Accounts and Papers of the House of Commons, Volume 56, Table No. 255, pp. 280-283)
Living persons, Liverpool, Census 1821:
Age
Persons
Per cent
< 5
17,900
14.7
5-9
16,800
14.1
10-14
13,200
11.2
15-19
11,200
9.4
20-29
18,000
15.2
30-39
16,500
14.0
40-49
12,600
10.7
50-59
7,000
5.9
60-69
3,800
3.2
70-79
1,500
1.3
80-89
380
0.3
90-99
40
0.0
Total
118,920
100.0
(Kaye, 1833, p. 68)
Comparison of proportions of ages of persons living, counties, Census 1841:
Lancashire
West Riding
Wiltshire
Persons
Per cent
Persons
Per cent
Persons
Per cent
< 5
230,000
13.8
165,000
14.3
33,000
12.8
5-9
196,000
11.8
145,000
12.6
32,000
12.4
10-14
182,000
10.9
133,000
11.6
30,000
11.6
15-19
175,000
10.5
122,000
10.6
26,000
10.1
20-29
320,000
19.2
202,000
17.6
42,000
16.3
30-39
232,000
13.9
144,000
12.6
31,000
12.0
40-49
153,000
9.3
104,000
9.0
25,000
9.7
50-59
94,000
5.6
69,000
6.0
18,000
7.0
60-69
57,000
3.4
42,000
3.6
13,000
5.0
70-79
22,000
1.3
19,000
1.7
6,000
2.3
80-89
5,000
0.3
5,000
0.4
2,000
0.8
90-99
0
0.0
0
0.0
0
0.0
Total
1,666,000
100.0
1,150,000
100.0
258,000
100.0
(1841: Accounts and Papers of the House of Commons, Volume 56, Table No. 255, pp. 280-283)
(Edwin Chadwick, Report on the Sanitary Condition of the Labouring Population…, 1842, Comparative Chances of Life in different Classes of the Community, pp. 158-159)
The next point is that, as we see above, the “15 years” applies only to “labourers, mechanics, and servants”; the “tradesmen and their families” have an average age of 22 years, and the “gentry and professional persons” have an average age of 35 years.
But the most important point is that we have an incorrect conflation of the terms “average age at death” and “life expectancy”. The average age at death is a function of persons who were born in previous years, and who die in the present year; the life expectancy is a function of the persons who are born in the present year, and their possibility of dying in each future year. According to Mr. Chadwick, “In Liverpool – where the investigations into the condition of the resident cellar population certainly show an increase in the causes of death, – over crowding, defective ventilation, bad supplies of water, and increased filth, – the average age of death is, for the whole town, 17 or 18 years only, whilst the average age of the living population, as far as it can be made out from the mode in which the census is prepared, is 25 years. …. In Manchester, the average age of the living is 25 years, while the average age of the dying is only 18. In Leeds, the average age of the living is also 25 years, but the average age of the dying is only 21” (Chadwick, 1844, pp. 13-14).
Chadwick gives some arithmetical bases to show that the difference between average age at death and life expectancy, is greatest in those towns – or districts of towns – where the life expectancy is lowest. Further he states that these differences are exaggerated when the growth of population is high (which is the case that we are observing).
But actually, Chadwick does not give figures about the future. In his 1842 Report and in his 1844 Paper to the Statistical Society, he does not use the phrase “life expectancy”. On two occasions he uses the term “probabilities of life”, which is the probable duration of a life beginning now. “The probabilities of life at infancy for the whole population of Liverpool, as deduced from the actual ages at death of the whole population, would be 17 years; …” (1842, p. 219). “The probabilities of life at different periods on which insurance companies act, are determined by tables of a different construction. To form a table of the probabilities of life at given periods, in 1000 cases say, the date of the birth in each case is ascertained, and observations are made of how many remain alive at the end of each year at the different periods of life. …. More than half the children of the working classes die, and only one-fifth of the children die, before the fifth year of age; and after having attained that age, the probabilities of life of the labourer’s child might be greater than that of the child of the person of the superior classes; …” (1842, p. 167).
A further point of definition is that we do not here have a population such as exists today in England, where only a few persons die before the age of 50. This is a society in which about 35 % of the human beings who are born, die before their fifth birthday. We shall see later, that in the projection of deaths for persons (the cohort born in 1840) in future years, starting from the date of birth the average life expectancy is 38, but the average life expectancy for those who pass their fifth birthday is 52 additional years, or 57 years in total. So it is not useful to say that “the life expectancy is 38 years”; we should say that “35 percent of the persons die before their fifth birthday” in conjunction with “65 percent of the persons have a life expectancy of 57 years”. It is important to track these two parameters, because the two groups have different causes of their deaths.
We have a map of real “ages of the living” in England and Wales in 1861:
(Cambridge Group for the History of Population and Social Structure, PopulationsPast.org)
The average age in England and Wales at the Census of 1821 was 25.3 years, and at the Census of 1841 was 26.7 years. The average age in Great Britainin 1851, 1861, 1871, remained without movement at 26.4 years.
Life Expectancy per Person
Edwin Chadwick reported figures that showed an impressive difference in average life expectancy between the workers in manufacturing areas, and the labourers in agricultural counties (Chadwick, 1842, Section IV, Comparative Chances of Life in Different Classes of the Community). There was obviously a difference, but not exactly in the way he presents it. His figures correspond approximately to the following tables, which are taken from another source.
Distribution of ages at death for Manchester and for Dorset and Wiltshire in July 1839 to June 1840
Manchester
Dorset and Wiltshire
Deaths
8,667
7,676
Births
10,192
12,415
% of Deaths
% of Births
% of Deaths
% of Births
0-1
2,116
24.4
20.7
1,357
17.7
10.9
1
1,099
12.7
10.7
424
5.5
3.4
2
568
6.6
5.6
264
3.4
2.1
3
443
5.1
4.3
174
2.3
1.4
4
332
3.8
3.2
139
1.8
1.1
5-9
537
6.2
5.3
357
4.7
2.9
10-14
188
2.2
1.8
238
3.1
1.9
15-19
238
2.7
2.3
326
4.2
2.6
20-29
573
6.6
5.6
662
8.6
5.3
30-39
589
6.8
5.8
465
6.1
3.7
40-49
567
6.5
5.6
449
5.8
3.6
50-59
461
5.3
4.5
515
6.7
4.1
60-69
469
5.4
4.6
715
9.3
5.8
70-79
352
4.1
3.4
907
11.8
7.3
80-89
99
1.1
1.0
576
7.5
4.6
90-100
22
0.3
0.2
90
1.1
0.1
>100
2
0.0
0.0
16
0.2
0.0
(extracted from: Registrar-General, Annual Report of Births, Deaths, and Marriages, 1841, p. 35, p. 41)
(The above data were taken from the Registrar-General’s report, and not from Dr. Chadwick’s report, as the latter does not give enough precision, just the expression for example “1 in 1 ½ “. Thus, the present data refer to the totality of the urban area of Manchester and to the counties of Dorset and Wiltshire, and are not restricted to the working classes in each case.)
But it is not necessarily true to say “the manufacturing workers had a much lower life expectancy than the agricultural labourers”. The calculation is affected greatly by the high figures of child mortality (50 % deaths before 5 years in Manchester); i.e. the child deaths should not affect our judgement as to what happened to the adult workers.
If we calculate from the basis of those persons who were able to survive until their fifth birthday, the figures come much closer together:
Distribution of ages at death for Manchester and for Dorset and Wiltshire in July 1839 to June 1840, as a percentage of births (only those persons who had passed their fifth birthday).
Manchester
Dorset and Wiltshire
Births
5,634
10,057
5-9
537
9.5
357
3.5
10-14
188
3.3
238
2.4
15-19
238
4.2
326
3.2
20-29
573
10.1
662
6.6
30-39
589
10.4
465
4.6
40-49
567
10.0
449
4.5
50-59
461
8.2
515
5.1
60-69
469
8.3
715
7.1
70-79
352
6.2
907
9.0
80-89
99
1.8
576
5.7
90-100
22
0.4
90
0.9
>100
2
0.0
16
0.0
And here we have a median life span of 40 for people in Manchester, and 53 for people in Dorset and Wiltshire.
But we also have to take into account that the Registrar-General’s figures refer to the past and not to the future. They show the number of persons born in e.g. one year of 1800-1809 who died in 1839/40, whereas we would really like to know how many people born in 1839/40 will die in one year of 1870-1879. This effect is multiplied by the extremely rapid growth (2.3 times) of the population of Manchester in the preceding 40 years. This means that the “universe” of people in 1800-1809, who might die in 1839/40, was small. If there had been 2.3 times more people in Manchester in 1800-1809, then the figure of deaths for 30-39 years old in 1839/40 would have been not 589 butabout 1450. Wiltshire and Dorset grew more slowly (+ 45 %).
Distribution of ages at death for Total of England and Wales, in July 1839 to June 1840:
England and Wales
Deaths
350,100
Births
501,600
% of Deaths
% of Births
0-1
76,300
21.8
15.2
1
29,800
8.5
5.9
2
15,900
4.5
3.2
3
11,400
3.2
2.3
4
8,200
2.3
1.6
5-9
18,500
5.3
3.7
10-14
9,500
2.7
1.9
15-19
12,300
3.5
2.5
20-29
26,700
7.7
5.3
30-39
23,000
6.7
4.6
40-49
20,900
6.0
4.2
50-59
20,800
5.9
4.2
60-69
26,800
7.6
5.3
70-79
29,600
8.6
5.9
80-89
17,200
4.9
3.4
90-100
2,800
0.8
0.6
>100
100
0.0
0.0
(extracted from: Registrar-General, Annual Report of Births, Deaths, and Marriages, 1841, p. 59)
In 1773, the actual enumeration of the town of Liverpool was found to be 32,400; dividing this by 1,191, the number of burials, we have a “value of life” of 1 in 27. “Liverpool, notwithstanding the crowded manner in which the inhabitants lived at that era, was then considered a healthy place; but a most marked improvement in the health and salubrity of the town has taken place since 1773.” In the year 1828 the deaths were 1,822, which, compared with a population of 150,000, gives a ratio of 1 in 40. “If there be no error in the calculation, or inaccuracy in the bills of mortality, Liverpool with its environs, is amongst the most healthy and salubrious spots in the country.”
(Kaye, 1833, p. 70)
“It is remarkable, that this superior value of life in Great Britain is not confined to any particular districts, or classes of individuals. To whatever point we turn our view, the advantage is still the same: the man of affluence, the pauper-patient of the hospital, the sailor and the soldier on active service, the prisoner of war, the inmate of a goal, all enjoy a better tenure of existence from this country than from any other of which we have been able to consult the records.”
(Hawkins, 1829, p. 30)
Although the life expectancy in the manufacturing regions was low, caused principally by the high mortality of the children, there were counties with a relatively large number of old persons. In Cornwall, Devon, Wiltshire, Dorset, and the extreme North of Lancashire, more than 20 % of the people were over 70 years old.
(Third Annual Report of the Registrar-General, 1841, p. 19)
The following table from the Annual Report of the Registrar-General for 1876 gives us the number of deaths (male) for England and Wales, by date of death and age at death. This means that we can have the numbers (real persons): died in 1840 at age 0, therefore were born in 1840; died in 1841 at age 1, therefore were born in 1840; died in 1842 at age 2, therefore were born in 1840; etc.
So we can construct a table of males born in 1840: how many died in 1840 at age 0; how many died in 1841 at age 1; how many died in 1842 at age 2; etc. This takes us up to those people who died in 1875, at age 35.
For the deaths from 1876 onwards, we use the data in the table 19 on page xxviii of the 1876 Report, which shows what percentage of the people who were living in 1876 (*), and were of the age of e.g. 35 to 45, died in the year 1876, and thus we can estimate the deaths of persons born in 1840 and who died in 1876-1885; and consecutively for the following ten-year periods. (*) (The figures for 1848-72 were similar)
(Thirty-Ninth Annual Report of the Registrar-General of births, deaths, and marriages, 1876; p. lxviii)
The resulting table can give us the number of persons who died in each calendar year (or quinquennium, or decade), which then permits us to calculate the life expectancy for the cohort “born in 1840”. The life expectancy from birth is 37.3 years, and the expectancy for those who survived to 5 years of age was 52.1 additional years.
1840
MALES
Born
Died
Number Died
Surviving at end of Period
Age at Death
Per cent
Weighted
1840
257,400
1840
1840
43,900
213,500
0.5
17.1
21,900
1840
1841
14,000
199,500
1
5.4
14,000
1840
1842
7,500
192,000
2
2.9
15,000
1840
1843
4,700
187,300
3
1.8
14,100
1840
1844
3,700
183,600
4
1.4
14,800
1840
1845-1849
9,460
174,140
7
3.7
66,220
1840
1850-1854
4,940
169,200
12
1.9
59,280
1840
1855-1859
5,960
163,240
17
2.3
101,320
1840
1860-1864
7,380
155,860
22
2.9
162,360
1840
1865-1874
15,840
140,020
30
6.2
475,200
45.6
1840
1875-1884
19,600
120,420
40
7.6
784,000
1840
1885-1894
23,400
97,020
50
9.1
1,170,000
1840
1895-1904
33,400
63,620
60
13.0
2,004,000
1840
1905-1914
42,200
21,420
70
16.4
2,954,000
1840
1915-1924
19,300
2,120
80
7.3
1,544,000
1840
1925-1940
2,120
0
90
1.0
190,800
54.4
e (0)
37.3
2.7 % p.a.
e (5)
52.1
From a similar report about Females, we can construct a table of deaths in each year. The life expectancy from birth was 40.1 years, and the life expectancy of those who survived to 5 years was 56.3 additional years.
1840
FEMALES
Born
Died
Number Died
Surviving at end of Period
Age at Death
Per cent
Weighted
1840
244,800
1840
1840
33,900
210,900
0.5
13.8
16,950
1840
1841
13,200
197,700
1
5.4
13,200
1840
1842
7,300
190,400
2
3.0
14,600
1840
1843
4,800
185,600
3
2.0
14,400
1840
1844
3,500
182,100
4
1.4
14,000
1840
1845-1849
9,200
172,900
7
3.8
64,400
1840
1850-1854
5,080
167,820
12
2.1
60,960
1840
1855-1859
6,720
161,100
17
2.7
114,240
1840
1860-1864
7,380
153,720
22
3.0
162,360
1840
1865-1874
16,350
137,370
30
6.7
490,500
43.9
1840
1875-1884
16,070
121,300
40
6.6
642,800
1840
1885-1894
18,440
102,860
50
7.5
922,000
1840
1895-1904
29,100
73,760
60
11.9
1,746,000
1840
1905-1914
43,080
30,680
70
17.6
3,015,600
1840
1915-1924
24,500
6,180
80
10.0
1,960,000
1840
1925-1940
6,180
0
90
2.5
556,200
56.1
e (0)
40.1
2.5 % p.a.
e (5)
56.3
Average of males and females was 38.7 years and 54.2 additional years.
The life expectancies for males and for females born in July 1840 – June 1841, according to the calculation in the Registrar-General’s Report for 1841, pp. 19-25, were 40.19 yearsand 42.18 years. The calculation here presented is closer to the reality, as it includes persons who actually died in the years 1840 to 1875.
Following, we have the “Life Table” for England and Wales for persons born in 1840, and which is very close to the numbers calculated in this chapter. In any case, we see that the males and females who survived their first five years, had about a 65 % of reaching the age of 65.
(Fifth Annual Report of the Registrar-General of births, deaths, and marriages, 1841; p. 23)
Following we have the mortality rates for different types of town, at the end of the eighteenth century and the beginning of the nineteenth century, taken from an earlier chapter.
Town type
Under the age of 1
Between 1 and 2
Between 2 and 5
Between 5 and 10
Total under 10
London
169
82
77
30
358
Large towns
186
99
93
34
458
Smaller towns
167
83
88
32
371
Village parishes
216
57
52
27
352
Agricultural Parishes
132
52
58
33
275
We shall see that the correct statement is not “the Industrial Revolution increased the death rate for infants and children against previous periods”, but “there was a decrease in the death rate in the agricultural counties and in London, and an increase in the industrial counties”.
The first quantitative data which can help us to understand the probabilities of death for small children of the working class, come from reports which were required by the Lords Committee on the State of Children employed in Manufactories in 1819. This gave the total list of the heads of family in each mill or street, with names, noting the number of children living, dead, and born.
Place
Number of Families
Number of Years married (average)
Children Living
Children Dead
Children Born
Cotton Mills in Holywell and Greenfield, Wirral
101
13
352
138 (28 %)
490
Other Occupations in Holywell and Greenfield, Wirral
101
17
290
171 (37 %)
461
Cotton Mill of Messrs. Peter Ewart, Manchester
41
6
72
60 (45 %)
132
M’Connel and Kennedy’s Factories, Manchester
108
14
307
217 (41 %)
524
Spinners, Adam and George Murray, Manchester
133
12
339
252 (43 %)
591
Factory of William Douglas and Co., Pendleton
205
12
266
192 (42 %)
458
Families, where no part of the Family works in Factories, Manchester
361
14
906
747 (45 %)
1,653
Families, where Children only Work in Factories, and not the Parents, Manchester
171
20
687
488 (41 %)
1,175
Families, where the Heads of Families work in Factories, Manchester
292
15
830
563 (40 %)
1,393
Families of Persons in various Employments, Manchester
156
17
494
435 (47 %)
929
Parent employed in Cotton Spinning, Preston
56
12
196
72 (27 %)
268
Parent employed in any Occupation, and some or any of the Children working in Cotton Mills, Preston
58
18
281
134 (32 %)
415
Parent employed in any Occupation, and none of the Children working in Cotton Mills, Preston
54
16
193
125 (39 %)
318
James Heginbottom and Co.’s Cotton Mill, Ashton-under-Line
40
–
140
50 (26 %)
190
Catrine Cotton Works, Ayr
276
24
1439
599 (29 %)
2038
Village of Mauchline, Ayr
240
19
827
404 (33 %)
1231
Agricultural District of the Parish of Mauchline, Ayr
110
21
543
114 (32 %)
657
Wool Factory in the Agricultural District of Mauchline Parish
7
15
26
16 (38 %)
42
Village of Sorn, Ayr
70
20
274
101 (27 %)
375
Agricultural District of the Parish of Sorn
163
21
742
204 (22 %)
946
Families now or formerly employed at the Deanston Cotton Works, Kilmadock, Perth
52
21
283
75 (21 %)
358
All the married families in the Parish of Lescropt, Stirling
73
21
301
87 (22 %)
388
(Lords Committee on the State of Children …., 1819, Appendix, Tables 10 to 29)
From the number of years married in each case, we can suppose that the children (living or dead) were born in the years from about 1805 to 1819. Probably the average age of the children (or the theoretical age, had they lived) at the time of the reports would be about 10 years old. So we have a death rate up to 10 years of 40-45 % in the case of families living in Manchester, and of 20-33 % in the case of families living in villages in the Scottish Lowlands. This gives us the well-known differentiation between manufacturing regions and agricultural regions. What we do not know, is if the death rate in Manchester in the previous generation was also 40-45 % (i.e. towns had always been at this level), or had been 35 % (i.e. there were more deaths due to the more difficult environment). We note that the proportion in Manchester was 40-45 %, even for those groups of families, that did not work in the factories.
In any case, it is not pleasant to lose a number of children. In one of the lists, we find at the first position on the page, a couple married for 24 years, who had had 17 children, of whom 12 had died.
There was no worsening of the infant and child mortality rates from 1800 to 1835, we have some comments from specialists, and a calculation from Mr. George Porter of the Board of Trade.
“That the actual mortality under the age of ten is universally less than it was 25 years ago, …. there are convincing proofs, which depend on the acknowledged fact of the mortality, compared with the population, being everywhere diminished.”
(Dr. John Roberton, Observations on the Mortality and Physical Management of Children, 1827, Section V, On the Comparative Mortality of Children before and since the Commencement of the Present Century, pp. 46-47)
mortality under the age of ten universally less than it was twenty-five years ago.” [The contents of the section are not visible in Internet].
(Dr. John Roberton, Observations on the Mortality and Physical Management of Children, 1827)
“The very great diminution of the mortality of infants in England is one of the most remarkable phenomena of modern times”
(T. R. Edmonds, Mortality of Infants in England, The Lancet, Vol. 1, 1835-36, p. 690)
“The effect of those better habits has been the prolongation of the average period of life among the working classes?” “Yes; cleanliness, their better nursing, and their better feeding of their children, better training in every particular, have produced this effect.”
“There are more children reared than there used to be?” “To a very great extent. From the best inquiries I have been able to make of everybody likely to posess information, and especially some connected with Life Insurance Offices, I have the most satisfactory assurance that more children are reared, and the term of life is prolonged very considerably. I mean that this is so independently of the extermination to a great extent of the small-pox and the autumnal fever.”
(Mr. Francis Place, political and educational reformer, Evidence to the Select Committee on Education in England and Wales, 1835, p. 74)
Mr. Porter gives us a comparison between 1813, 1818-1824, and 1830, of the proportions of ages at death; we see that the percentage of “From Birth to 10 Ten Years old” practically does not change.
Age at which the Deaths have occurred
1813 Per Cent
1818-1824 (average) Per Cent
1830 Per Cent
From Birth to 10 Years old
39.75
39.60
38.56
“ 11 “ 20 “
5.87
6.33
6.63
“ 21 “ 30 “
7.47
7.09
8.06
“ 31 “ 40 “
6.77
6.69
6.77
“ 41 “ 50 “
6.51
6.61
6.42
“ 51 “ 60 “
7.46
7.14
7.35
“ 61 “ 70 “
9.75
9.44
9.27
“ 71 “ 80 “
10.34
10.25
10.55
“ 81 “ 90 “
5.37
5.57
5.74
“ 91 “ 100 “
0.67
0.65
0.04
Above 100
0.04
0.03
0.02
(Porter, 1836, Vol. 1, Population, p. 30)
To extend this to 1840, we can take the report of Comparative Mortality from the 1841 Census, which gives the “under 5 years” for the average 1813-1830 at 34.5 percent and for the average 1831-1840 at 35.4; for “5 to 9 years” the figures are 4.2 and 4.9 (Parish Register Abstract, England and Wales, 1841, Preface, p. xxi).
The quantitative investigation that we have to carry out, is to see if the percentage figures for infant mortality (0-11 months) and for child mortality (12-59 months) increase during the period 1800-1860. We do not have data from the same administrative sources, or with the same quality, for the whole period. For the births and deaths, from 1801 to 1831, we have collections of “Parish Registers”; from 1837 to 1860, we have the birth and death forms as organized by the Registrar-General in the terms of the Marriage and Registration Act. The incoming data for 1801 to 1831 are not complete, particularly because they do not include births and deaths of children who died before they were baptized. The data for years from 1837, are absolutely reliable.
In the following sub-chapter on “Life Expectancy”, we will see that it is possible to demonstrate a continuity (adjusting the earlier figures with + 18 %) from the numbers up to 1831, with those starting from 1837, and that the birth rates and death rates do not change in an important amount in the period 1801 to 1860.
Here we have to go through the same processes as for the birth and death rates, but for the percentages of infant mortality and child mortality. First we shall inspect some data from the period of 1801-1831, then we shall attempt to construct a “bridge” between the earlier and later series, and then we shall copy figures from the Registrar-General’s Annual Reports, and show that these do not have increases during the period 1837-1860.
There is only one source which gives us numbers as to infant and child mortality for the years before 1837. It comes from a government compilation of information from the year 1834. The original pages give the number of persons “buried and registered” by each year of age, and for every calendar year from 1813 to 1830, but with only the total for England and Wales. Thus we can copy figures of the deaths at age “Under 1 Year”, “1 Year”, etc.
Births
Deaths
Under 1 Year
1 Year
2 Years
3 Years
4 Years
Total under 5 Years
1813
314.4
186.4
36.2
11.9
7.4
4.7
3.3
63.5
1814
318.9
206.4
39.1
12.6
7.9
4.9
3.5
67.7
1815
314.9
197.4
40.3
12.3
7.2
4.9
3.3
68.0
1816
330.2
205.9
40.3
12.9
7.3
4.5
3.3
68.3
1817
331.6
199.3
39.0
14.0
7.9
4.7
3.2
68.8
1818- 1824 av.
378.4
221.3
42.7
14.7
8.5
5.1
3.6
74.6
1825
375.0
255.0
49.1
16.6
9.5
5.4
3.8
84.4
1826
380.4
268.2
49.1
16.9
9.9
5.8
4.0
85.7
1827
374.2
251.9
46.3
16.3
9.2
5.7
3.9
81.4
1828
392.4
255.3
49.6
17.0
9.5
5.7
3.9
85.7
1829
380.2
264.2
46.5
16.6
9.6
6.1
4.4
83.2
1830
382.1
254.0
43.8
16.3
9.2
5.6
4.1
79.0
(figures in thousands of persons)
(Tables of the Revenue, Population, Commerce &c. of the United Kingdom, 1834, Part 3; Table 400 – An Account of the Ages of Males and Females Buried and Registered in England and Wales in each Year, from 1813 to 1830, inclusive, p. 455)
We can convert this table to rates per birth, presented in per 1000:
Under 1 Year
1 Year
2 Years
3 Years
4 Years
Total under 5 Years
1813
115
38
23
15
10
201
1814
122
40
25
16
10
212
1815
128
37
23
16
11
216
1816
122
39
22
14
10
205
1817
118
42
24
14
10
208
1818- 1824 av.
113
39
22
14
10
197
1825
131
44
25
14
10
225
1826
129
44
26
15
11
226
1827
123
43
25
15
10
218
1828
127
43
24
15
10
219
1829
122
44
25
16
12
219
1830
115
43
24
15
11
206
(figures in per 1000 of births)
But the numbers of births and deaths from the system of collection of data of the years before 1837 (“Abstracts of Parish-Registers”) do not include all the births and deaths, as they do not have the children who died without being baptized, some reports from churches of the non-conformist Protestant are missing, and those persons who died abroad or at sea are not included. See the first pages of the next sub-chapter “Life Expectancy”, the letter of Mr. J. Finlayson, Actuary of the General Debt Office, February 2nd 1839, to the Registrar-General in the First Annual Report of the Registrar-General, pp. 82-86, and Porter, 1847, Population, p. 49.
Based on Mr. Finlayson’s calculations, we should a) divide the death rates by 1.18, as this is the proportion missing from the absolute numbers of births (denominator), b) add 10 percentage points to the totality of the death rates for the first five years, as this represents the children who died before being baptized (nearly all should be in the first 12 months of life).
This gives us:
Under 1 Year
1 Year
2 Years
3 Years
4 Years
Total under 5 Years
Average of the above table
119
41
24
15
11
210
Adjust divide 1.18
101
34
21
12
9
177
Adjust add 100 p mil
178
44
26
16
13
277
So that the real facts based on the original data were: infant mortality 178 / 1000, child mortality 99 / 1000, total 277 / 1000.
Mr. Porter, in a presentation to the Statistical Society of London in 1841, commented the basic figures of the Census taken in early 1841. One point that he showed was the proportions of deaths at different ages, as a comparison between 1838-1841 and 1813-1830, which appeared to show a worsening of the parameter of “deaths under five years”. But he said that this was against the general judgment that the per cent child mortality had decreased, and that the reason for the apparent increase was the under-registration before 1838.
“In the table given in the Appendix will be found the number of deaths registered at different ages during each of the three years ending 30th June, 1838, 1839, and 1840 as returned to the Registrar-General; the aggregate of these three years; the number of deaths at different ages recorded in the parish registers during the 18 years from 1813 to 1830, and the proportions of those deaths in each 10,000 that occurred at different ages.
From this table it would appear, that the proportional number of deaths under five years of age has been very materially greater during the three years ending June, 1840, than it was during the 18 years ending with 1830. This result is contrary to the general and probably well founded opinion that a larger proportion of infants are reared now than were reared in the earlier years of this century, though the general adoption of vaccination, and the spread of more rational treating the diseases of infancy. It is contrary also to the evidence afforded by the comparative ages of persons now living, as already has been sufficiently pointed out.
It is evident that the returns of deaths from the parish registers for the 18 years from 1813 to 1830 were very greatly deficient in the numbers registered. The population has increased since 1821 (about midway between 1813 and 1830) only 33 per cent. while the yearly burials as returned to the Registrar-General are 55 per cent. greater than those recorded in the 18 years. May we not conjecture that an unduly small proportion of infants were buried in consecrated grounds? If so, this would account for the discrepancy that has been noted, but we are not possessed of any data by which to certify the error.”
(Porter, An Examination of some Facts obtained at the recent Enumeration…,1841)
(Underline by this author)
Here following, a simplified presentation of these data, in another publication by Mr. Porter.
Proportions of Deaths in 10,000 at different Ages
1838
1839
1840
1841
1842
Five Years 1838- 1842
Eighteen Years 1813- 1830
Under 5 years
3,911
3,959
4,056
3,892
3,962
3,967
3,451
5 to 10 “
460
476
538
520
490
505
424
10 “ 15 “
259
272
271
265
259
268
265
15 “ 20 “
342
354
353
351
339
347
343
20 “ 30 “
787
796
765
780
753
772
781
30 “ 40 “
685
677
658
658
649
660
672
40 “ 50 “
644
629
597
605
596
611
660
50 “ 60 “
640
630
596
622
620
619
700
60 “ 70 “
820
806
768
812
814
802
917
70 “ 80 “
858
837
829
877
881
855
1,049
80 “ 90 “
515
437
496
531
526
511
642
90 “ 100 “ 100 & upwards
79
77
77
83
88
83
96
(Porter, 1847, Vol. 1, Population, p. 17)
We have comments in two books, which are general guides to Manchester and to Liverpool, which may not be in accordance with our ideas as to children’s deaths. It appears that the idea was that the large proportion of children dying, did not enter into a judgement of the healthiness of the places; it was “acceptable”.
“Notwithstanding its low situation, Manchester is a healthy place, if we are to judge by the longevity of its inhabitants, and the bills of mortality, which exhibit a far greater number of births than burials.” (Aston, 1828, p. 3)
“…. render Liverpool one of the healthiest places in the kingdom, in proportion to the number of inhabitants.” (Kaye, 1833, p. 65)
“If there be no error in the calculation, or inaccuracy in the bills of mortality, Liverpool with its environs, is amongst the most healthy and salubrious spots in the country.” (Kaye, 1833, p. 70)
The only town, for which we have figures of child deaths from 1800 to 1840, is Liverpool; the yearly Bills of Mortality do include «age at death».
Bills of Mortality, Liverpool (parish only)
Year
Persons
Births
Burials
Died under 2 years
Died between 2 and 5 Years
Per 1000
Per 1000
1802
78,000
3,123
2,480
837
344
268
110
1811
92,000
4,183
3,078
987
278
236
66
1812
94,000
3,889
2,546
797
254
204
65
1813
96,000
3,535
2,534
908
304
256
86
1814
98,000
3,851
2,677
722
291
172
69
1815
100,000
4,068
3,298
1,210
426
297
103
1816
103,000
4,153
3,033
959
341
231
82
1817
106,000
4,315
3,372
1,117
365
259
84
1818
109,000
4,432
3,652
1,136
446
256
100
1819
112,000
4,548
3,728
1,236
430
272
95
1820
115,000
4,718
3,157
991
303
210
64
1821
119,000
4,629
3,497
1,232
411
266
89
1822
123,000
4,734
3,379
1,164
359
245
75
1823
127,000
5,029
1824
131,000
5,305
4,132
1,432
467
270
88
1825
135,000
6,527
4,143
1,448
422
310
64
1826
139,000
6,579
4,485
1,592
589
242
89
1837
201,000
9,388
6,875
2,483
822
264
87
(General Bills of Mortality, Churchwardens, Liverpool; The Stranger’s Guide to Liverpool, different years)
The challenge is to “knit together” the births/deaths from 1831 with those of 1837, as they may well have been collected with different premises.
We need to show that the 1837 data are consistent in their values from those of 1831, and we do have reasonable evidence:
We have found that the infant mortality rate and child mortality rate from the years up to 1831 are 178 / 1000 and 98 / 1000, giving a total of 277 / 1000; we shall see that the numbers for the first years from 1837 for the total of the country, are 150 / 1000 and 120 / 1000, giving a total of 270 / 1000.
For Liverpool, we do have a direct connection in the year 1837: the parish registers give 264 / 1000 and 87 / 1000, giving a total of 351 / 1000; if we adjust with + 10 percentage points, we have 344 / 1000 and 107 / 1000, giving a total of 451 / 1000; the Registrar-General has 243 / 1000 and 213 / 1000, giving a total of 454 / 1000.
Mr. George Porter compares the yearly statistics of deaths from 1801 to 1831 from the Parish Registrars, with an annual average for 1831 to 1841 calculated by the Census Commissioners, and finds them to be practically equal; that is, the real facts did not change in this transition period.
The numbers below for 1838 to 1870 are taken from the Annual Reports of the Registrar-General: the pages of Deaths at Different Ages, given per Registration District.
The numbers below for Manchester, Liverpool, Leeds, refer to the whole conurbation in each case. Particularly in the case of Manchester, we know that the better class of workers from 1825 moved to new housing areas in Hulme and Chorlton. It would not be correct to use only Manchester Township, and thus have birth/death data from only the poorer workers.
Total England and Wales
Births
Deaths
Under 1 Year
1 to 4 Years
Per 1000
Per 1000
1838- 1839
480,000
331,000
72,304
58,390
151
122
1839- 1840
501,000
350,000
76,328
65,419
152
131
1840- 1841
504,000
355,000
75,507
64,582
150
128
1842
517,000
349,000
78,704
60,331
152
117
1843
527,000
346,000
79,253
58,370
150
111
1844
540,000
356,000
80,716
59,918
149
111
1845
543,000
349,000
77,426
58,151
142
107
1846
572,000
390,000
93,644 Cholera
66,975
163
117
1847
539,000
423,000
88,508 Cholera
69,863
164
130
1848
563,000
400,000
86,437
69,698
153
123
1849
578,000
440,000
92,171 Cholera
68,839
159
119
1850
593,000
368,000
86,302
58,359
145
98
1851
616,000
395,000
96,753
65,197
157
105
1852
624,000
407,000
98,660
67,454
158
108
1853
612,000
421,000
101,501
63,577
165
103
1854
634,000
438,000
99,299 Cholera
78,886
157
124
1855
635,000
425,000
97,503
68,240
153
107
1856
657,000
390,000
94,407
62,660
144
95
1857
663,000
419,000
103,928
70,056
157
105
1858
655,000
449,000
103,837
83,092
158
127
1859
689,000
441,000
105,629
77,715
153
112
1860
684,000
422,000
100,984
65,800
147
96
1861
696,000
435,000
106,428
74,701
152
107
1862
712,000
436,000
101,173
77,140
142
108
1863
727,000
473,000
108,089
93,921
149
129
1864
740,000
495,000
112,935
86,668
153
117
1865
748,000
491,000
119,810
80,035
160
107
1866
754,000
501,000
120,299
82,720
159
110
1867
768,000
471,000
117,261
71,337
152
92
1868
786,000
480,000
122,075
81,054
155
103
1869
773,000
494,000
120,274
83,288
155
107
1870
792,000
515,000
126,638
84,957
160
107
This result was unexpected, it shows that the average over the different regions of the country for deaths under 12 months was in a small range from 145 to 158 / 1000 (leaving out years with epidemic illnesses). This can only be explained if we suppose that these deaths were not in a function of the financial situation of the family nor of the work situation (industrialization); rather they were caused by the difficulty of the mothers to look after their babies, which remained unchanged through these years.
Equally the average for 1 to 4 years was in the range from 110 to 130 / 1000.
Manchester, Salford, Chorlton
Births
Burials
Under 1 Year
1 to 4 Years
Per 1000
Per 1000
1838- 1839 (+)
10,700
9,276
2,045
2,214
191
207
1839- 1840 (+)
10,192
8,667
2,116
2,442
207
240
1841
14,051
10,378
2,651
2,546
188
181
1842
13,857
10,748
3,029
2,566
218
185
1843
14,109
11,057
N/A
N/A
1844
15,194
10,470
N/A
N/A
1845
15,802
10,898
2,944
2,470
186
156
1846
16,758
14,095 Typhus
4,225
3,508
252
209
1847
15,482
15,114 Typhus
3,413
3,441
222
222
1848
14,949
13,841
3,281
3,585
219
240
1849
16,686
14,426
3,631
2,876
217
172
1850
14,403
11,383
3,364
2,463
233
171
1851
17,570
11,855
3,418
2,173
194
123
1852
14,268
13,828 Epidemic diarrhea
4,144
3,289
290
230
1853
18,644
13,821
3,804
2,982
204
160
1854
18,862
13,953
3,807
3,335
202
177
1855
18,508
13,803
3,828
3,150
206
170
1856
17,357
12,356
3,414
2,648
197
152
1857
18,697
13,643
3,876
2,829
207
151
1858
17,398
14,947
3,606
3,972
207
228
1859
19,093
13,136
3,439
2,693
180
141
1860
18,442
12,993
3,241
2,390
176
129
1861
19,923
13,858
3,640
3,035
183
152
1862
20,122
14,187
3,429
3,514
170
174
1863
20,165
15,785
3,727
4,242 Scarlatina
184
210
1864
19,768
15,100
3,520
3,208
178
162
1865
20,275
17,041
4,322
3,448
213
170
1866
20,702
17,215 Cholera
4,252
3,175
205
153
1867
21,453
17,016
4,366
3,696 Scarlatina
204
172
1868
22,298
17,874
4,549
4,070 Scarlatina
204
182
1869
21,835
16,363
4,165
3,269
191
149
1870
22,480
16,226
4,461
2,881
198
128
(+) Only Manchester plus Salford
Liverpool and West Derby
Births
Burials
Under 1 Year
1 to 4 Years
Per 1000
Per 1000
1838-1839
9,683
8,476
2,045
2,214
211
228
1839-1840
9,925
9,990
2,376
2,927
239
294
1841
10,805
9,758
2,449
2,528
226
234
1842
12,428
9,785
2,546
2,631
205
212
1843
12,756
9,767
N/A
N/A
1844
13,057
10,200
N/A
N/A
1845
14,273
9,929
2,607
2,407
182
168
1846
15,440
13,537 Typhus
3,751
3,563
243
230
1847
15,469
21,570 Typhus
3,628
4,048
234
261
1848
15,456
13,163
2,545
3,286
164
212
1849
14,237
18,700 Cholera
3,458
3,960
242
278
1850
14,441
10,822
2,806
2,621
194
181
1851
14,815
12,550
3,107
3,217
210
217
1852
13,676
12,067 Epidemic Diarrhea
3,282
3,167
240
231
1853
14,333
11,852
2,985
2,622
208
182
1854
15,666
14,797 Cholera
3,539
3,952
226
252
1855
15,994
13,271 Cholera
3,236
3,276
202
204
1856
16,539
12,363
3,192
3,114
192
188
1857
16,790
13,138
3,618
3,471
215
207
1858
16,734
14,781
3,605
3,489
215
208
1859
16,682
12,718
3,259
2,850
195
171
1860
16,246
13,206
2,896
2,377
178
146
1861
16,989
13,964
3,459
3,455
203
203
1862
19,222
14,747
3,413
3,867
178
201
1863
18,430
16,536
3,770
3,994 Scarlatina
204
216
1864
21,029
18,562
4,545
3,648
216
173
1865
21,869
18,895
4,504
3,630
206
166
1866
21,585
22,250 Cholera
4,892
5,341
226
244
1867
22,366
16,260
4,135
3,499
184
156
1868
22,192
16,785
4,521
3,573
203
161
1869
21,481
16,652
4,066
3,673
189
171
1870
22,052
18,386
4,636
4,150
210
189
The numbers of infant and child deaths below 5 years, shown here for 1838 to 1842, are somewhat higher than the figures for 1830 to 1837 shown above from the Bills of Mortality. The explanation is that the earlier figures do not include the babies who died before being baptised, and were not registered; the necessary adjustment was estimated at about 18 %.
Leeds, town and out-townships
Births
Burials
Under 1 Year
1 to 4 Years
Per 1000
Per 1000
1838- 1839
6,175
4,690
1,124
1,351
182
219
1839- 1840
6,664
4,203
1,029
1,006
154
151
1841
6,696
4,361
1,125
917
168
137
1842
6,376
4,612
1,254
1,055
197
165
1843
6,126
4,335
N/A
N/A
1844
6,584
4,124
N/A
N/A
1845
6,653
4,239
1,071
1,032
161
155
1846
6,882
4,529
1,376
958
199
139
1847 (*)
6,325
5,693 Typhus
1,343
1,404
212
222
1848
6,760
4,860
1,308
1,100
193
162
1849
6,612
7,274 Cholera
1,387
1,221
209
184
1850
6,936
4,530
1,277
742
184
107
1851
7,232
5,477
1,511
1,126
214
156
1852
8,072
5,950
1,656
1,471
205
182
1853
7,686
5,009
1,450
783
189
101
1854
8,011
5,544
1,831
1,062
228
132
1855
8,114
5,594
1,343
1,168
165
144
1856
7,049
4,924
1,492
867
211
123
1857
8,208
5,360
1,528
1,035
186
126
1858
8,088
5,760
1,596
1,287
197
159
1859
8,366
5,401
1,483
1,106
177
132
1860
8,704
6,008
1,657
1,409
190
161
1861
8,733
6,217
1,569
1,035
180
119
1862
9,138
5,882
1,610
1,328
176
145
1863
9,350
7,052
1,873
1,697 Scarlatina
200
181
1864
9,702
6,595
1,813
1,377
187
142
1865
10,418
7,314
2,117
1,613
203
154
1866
10,647
7,757
2,266
1,556
213
146
1867
10,981
6,571
2,053
1,097
187
100
1868
10,839
7,110
2,204
1,474
203
136
1869
10,774
7,309
2,134
1,289
198
120
1870
11,134
7,750
2,350
1,578
211
141
In the Manchester, Liverpool, and Leeds conurbations, we do not see any particular movement upwards or downwards (leaving out years of epidemic illnesses), which might reflect the worsening of the housing and sanitary situations.
The figures of infant mortality in England as an average were much lower than in other countries during the 19th century. The figures for Manchester and Liverpool, i.e. the worst cases in England, were about 210 in 1840, and decreased to about 175 in 1900. This means that the average in Germany was higher than Manchester and Liverpool throughout the nineteenth century. The data shown for each country are averages of rural and urban areas; since industrialization did not start until 1830 on the European mainland, we can suppose that the figures correspond in a large proportion to agricultural communities and small towns. Thus the high figures (from our point of view) from industrial towns in England, are lower than those from agricultural areas in all the other countries.
(Gehrmann, 2011, pp. 839-869, Graph 3
We have data for each county from 1841:
(Registrar-General, Annual Report of Marriages, Births and Deaths, 1841, p. 18)
Clearly the industrial counties had a higher rate of infant mortality than the agricultural counties (data referring to 1845-54):
(Newman, 1902, p. 23)
A large part of the high figure for industrial towns was due to the impossibility of the working mothers to care for their children, or to give them milk or enough other food. The causes given in the death certificates, or in general information from doctors, were “diarrhea, convulsions, atrophy, measles”, but as Dr. Farr comments, these illnesses were “inseparable from bad nursing and feeding”.
The employment of women in industrial work, and particularly in the textile factories, had a number of bad effects on the care of their small children:
The women, who worked ten hours a day in the factories, in general in a standing position, left their work only 15 days before the birth, and took it up again about 30 days after the birth; this obviously was a great stress on the body of the woman, and of the baby;
As the women worked 10 days a day, they were only a few hours in the house, where they could look after the baby, and give it breast milk;
The little children were often given to small daughters of the mother, or to minders, to look after the children;
The food given to the babies was of bad quality;
A number of small children were given calming liquids with an opiate base (“Godfrey’s Cordial” was the favourite), which in some cases caused the death of the child;
The mothers often did not know how to look after children, or indeed how to do household work, as their own mothers – who had passed through these experiences – were not able to give them advice.
“The great mortality among children under 2 years of age is not directly chargeable to the factory system. The mortality between 1 and 2 is greater in Birmingham than in Manchester, for those are the two places especially contrasted. To what cause, therefore, may it be attributed? To no one in particular. The manners and habits of the people have much to do with it. That some localities are less healthy than others there can be no doubt. The most plausible reason which I can find is, not that the youths die in factories, but that the very young children are, under the existing system, not sufficiently taken care of by the mothers – both as regards themselves during gestation, and their offspring during childbirth. The women, during pregnancy, continue as long as possible at their work, and after child-birth return to it sooner than they ought, leaving their infants to the care of ill-paid and unsuitable persons. Nor ought we to omit, that soothing drugs, such as the well-known nostrum, Godfrey’s Cordial, are often had recourse to, with a view to ease the pains and to quiet the restlessness of infants; and it is perhaps to this improper use of narcotics that the frequent deaths from convulsions may be attributed. However desirable it may be, on other grounds, to regulate the labour of youths in factories, it is still more expedient, that mothers should not, if possible, be abstracted from attention to their helpless infants, particularly during the periods of lactation and teething.»
(Johns, 1840, pp. 195-6)
“Factory women soon return to labour after their confinement. The longest time mentioned as the average period of the absence from work in consequence of child-bearing was five or six weeks; many women among the highest class of operatives in Birmingham acknowledged to having generally returned to their work at the expiration of a month (*). And it was stated that the factory women even sometimes return to work as early as eight or ten days or a fortnight after confinement. The mother’s health suffers in consequence of this early return to labour, especially if, as is often the case, it is carried on in a standing position; and the influence on the health and mortality of children is most baneful … Mothers employed in factories are, save during the dinner hours, absent from home all day long, and the care of their infants is entrusted either to young children, to hired nurse-girls, sometimes not more than eight or ten years of age, or perhaps more commonly to elderly women, who eke out a livelihood by taking infants to nurse. Young girls, aged seven or eight years, are frequently removed from school for the purpose of taking charge of younger children while the mother is absent at work, and are sometimes said to return, on the death of the child, evidently rather pleased that the event has released them from their toil …. Pap, made of bread and water, and sweetened with sugar or treacle, is the sort of nourishment usually given during the mother’s absence, even to infants of a very tender age: and in several instances little children not more than six or seven years old were seen preparing and feeding babies with this food, which in such cases consisted only of lumps of bread floating in sweetened water …. Illness is the natural consequence of this unnatural mode of feeding infants ….. Children who are healthy at birth rapidly dwindle under the system of mismanagement, fall into bad health, and become uneasy, restless, and fractious. To remedy the illness caused by mismanagement various domestic medicines are administered, more particularly some kind of opiate such as Godfrey’s cordial or laudanum. Wine, gin, peppermint, and other stimulants are often given, for the purpose, it is alleged, of relieving flatulence, the actual effect being, however, rather to stupefy the child. The quantity of opiates sold for the purpose of being administered to infants in some of the manufacturing towns is very large … Indeed, there seems to be no doubt that the habitual administering of opiates to infants must be included among the causes of a high infantile mortality in certain manufacturing towns, not only on account of an overdose being given, but also because infants kept in a state of continued narcotism will be thereby rendered disinclined for food and be but imperfectly nourished. …. Parents who thus entrust the management of their children so largely to strangers become more or less careless and indifferent about them, and as many of these children die, the mothers become familiarized with the fact, and speak of the deaths of their children with a degree of nonchalance rarely met with among women who devote themselves to the care of their offspring … Abundant proof of the large mortality among the children of female factory operatives was obtained during the enquiry. An operative of the better class in Birmingham reported that he collects money for the expenses attendant on the deaths of children among the workers in a factory where 150 women are employed, and that he believed that ten out of every twelve children born to the married women in this factory died within a few months after birth. Many married women were questioned, as opportunity served, in the several factories visited, regarding their families, the number of children they had borne, the number that survived, and the manner in which they were brought up. The evidence of those women tallied exactly with that of other persons …. It was frequently found that two-thirds or three-quarters of the children borne to those women had died in infancy.”
(Sir John Simon, Fourth Report of the Medical Officer of the Privy Council, 1861, pp. 187-196; quoted in Newman, 1907, pp. 95-96)
(*) The wives in the better paid class of workers, in Birmingham, in 1861, could not interrupt their earnings for more than 6 weeks. This gives a different point of view as to the apparently good financial position of the families where both the father and the mother worked.
Dr. Newman shows in a number of pages that the infant mortality rate is highest in the manufacturing towns with the highest percentage of adult women working in the mills (see the whole chapter “The Occupation of Women” in his book). There was also an effect in some agricultural regions, when the adult women took up hard manual work in the fields; there was an identifiable increase in infant mortality in parts of East Riding, Cambridgeshire, and Norfolk, exactly due to this cause. The same differentiation between factory employment and rural employment was observed by the German health authorities in the later years of the nineteenth century.
The effect of mothers’ employment in the mills is shown in a rather gruesome manner by the effects of the Lancashire Cotton Famine of 1862-65, in which the death rates for adults increased, but the death rates for children decreased, exactly because the mothers had time to look after their children in the house.
“…. At the crisis of the famine the mills in Lancashire were not working more than half time, and in December, 1862, 247,000 cotton operatives were out of employment, and 165,000 others only partially employed. Twenty-four per cent. of the total population in the affected districts were in receipt of charitable relief. The result of the privation existing was an increase in the general death rate, whereas the infant mortality declined. In Lancashire in 1861 the infant death rate was 184, but in 1862 it fell to 168, rising gradually again to 200 in 1866. In England and Wales in the same period it fell to 142 (in 1862), rising again to 160 in 1865-66. For Coventry, too, owing to trade depression, in 1861 there was a decline in infant mortality, which led the Registrar-General to remark that “the care of the mothers of Coventry has, it would seem, counteracted some of the effects of privation, so that neglect of their homes by mothers at work in factories is apparently more fatal than starvation.” A somewhat similar condition of things has been found to prevail at Macclesfield when the silk mills are closed or working part time. During the siege of Paris (1870-71) also it is alleged that while the general mortality was doubled, the infant mortality fell 40 per cent. The interpretation of these facts is believed to be that in times of trade depression the women stop at home, and tend and suckle their infants more than in times of prosperity.”
(Newman, 1907, p. 227)
“Cotton Famine and mortality in Lancashire 1862. A few of the registrars witnessing a reduction of the mortality with the distress that prevailed in their districts at the same time have been tempted to speculate on the facts, and as those officers are in frequent communication with the labouring classes their opinions may be quoted. The registrar of Wigan states that more freedom to breathe the fresh air, inability to indulge in spirituous liquors, and better nursing of children, are believed to have improved the public health. The registrar of Little Bolton holds that the decrease of deaths is mainly due to a greater amount of domestic superintendence. The registrar of Hulme thinks that the even temperature of the weather and increased attention paid to young children have caused the decrease. The registrar of Knott Lanes (Ashton) attributes the result to absence of epidemics, mildness of the weather out-door exercise, maternal care; also to parish relief and charitable contributions, by means of which food has been obtained not sufficient for health but enough to mitigate distress and prevent hitherto an increase of mortality. The registrar of Preston sub-district also refers to the good effect of fresh air, nursing, and mildness of the weather, and he adds: “In the weeks ending August 2nd, 9th, 16th, 23rd, and 30th, I registered 30, 25, 29, 24, and 37 deaths, but in the corresponding weeks in 1861 when work was more plentiful and people in better circumstances they were 50, 40, 50, 42, and 57. The peaceful and dignified conduct of the operatives entitles them to the warmest sympathy and support of all classes.” The registrar of Ancoats (Manchester) is convinced that the low rate of mortality in his sub-district was due to the coldness of the summer, in consequence of which diarrhea did not prevail.”
(Farr, 1885, p. 141)
Thus we are fairly clear that the lack of maternal care was the most important factor in infantile mortality in the manufacturing towns. Possibly the next most important cause would be the extremely bad sanitation. But the question is, what was the proportion caused by lack of maternal care? We can inspect the per mille rates for a number of counties:
Infant Mortality in England and Wales
1845-1854
1871-1880
1881-1890
1891-1900
1901-1905
Lancashire
193
172
166
179
163
West Riding
174
166
156
164
154
Staffordshire
180
159
156
172
151
Derby
153
141
134
146
136
London
157
158
152
160
139
Kent
132
124
116
129
119
Devon
119
125
120
131
118
Oxfordshire
145
128
112
113
98
Wiltshire
128
110
103
102
91
(Newman, 1907, p. 21)
And then calculate the “manufacturing county penalty”, subtracting from the figure of each county, the figure for Wiltshire:
1845-1854
1871-1880
1881-1890
1891-1900
1901-1905
Lancashire
65
62
63
77
72
West Riding
46
56
53
62
63
Staffordshire
52
49
53
62
60
Derby
25
31
33
44
45
London
29
48
49
58
48
Kent
4
14
13
27
28
Devon
-9
15
17
29
27
Oxfordshire
17
18
9
11
7
Wiltshire
We see that the infant mortality decreases in practically all the counties; the “manufacturing county penalty” of, for example, Lancashire or the West Riding, increases a little, but this is due to the fact that Wiltshire improves by 10 points from 1881-1890 to 1901-1905. This would appear to suggest that the different factors continue. But this is not the case. It is not the case that the sanitation problem continued with the same intensity up to 1905.
The British Government, through the mechanism of the Public Works Loan Board, spent 62 million pounds from 1845 to 1876 on water supply and sewerage in the large towns of the country (Ian Webster, The Public Works Loan Board 1817-76 and the Financing of Public Infrastructure, Doctoral Thesis, Sheffield Hallam University, 2015, http://shura.shu.ac.uk/9939/1/Public_works_loan_board_1817-76.pdf. Chapter 5, Failure and then Success: Water Supply and Sewerage, 1848-76). This, as we see from the table above, did not have any effect on reducing the infant mortality.
But, more specifically, there was infrastructure investment in Lancashire. This was the Public Works (Manufacturing Districts Act) of 1864, which was passed in order to give work to the starving workers in Lancashire in the Cotton Famine of 1862-1865. Up to February 1865, 1,850,000 pounds were spent by the Government, with the following positive results:
“…. The larger portion of the expenditure was on sewerage and street improvement works, including the formation, paving and flagging, channeling and kerb stones of streets, and also the widening, re-forming, and improvement of highways in the rural districts. The length of sewerage works thus undertaken, exclusive of house drainage, would be 534,445 yards, or about 304 miles. The area of paving and other works of street and highway improvement, undertaken in respect of the above-mentioned sum, was 3,708,393 square yards, or about 766 acres. The total length of the streets and highways was 485,560 yards, or nearly 276 miles. The cubical contents of the reservoirs, forming the storage of the water-works undertaken in respect of the sum of £ 414,629, were about 1,480,000,675 gallons; equal to about three-days flow of the river Thames in dry weather.
…….
One important result would be that the cottages [town and rural houses] of the working men throughout Lancashire would be very materially improved, in regard to the comfort and health of the occupants.”
[the quantities in the original text are expressed in words]
(Watts, 1866, pp. 328-329)
These improvements in sanitation also did not reduce the rates of infant mortality in Lancashire. We must therefore suppose that practically all the infant mortality in the manufacturing counties, above the “base level” of the agricultural counties, was caused by deficiencies in maternal care, due to the absence of the mothers in the factories.
This certainly is a “human cost” of the Industrial Revolution.
According to a table in the Registrar-General’s Report for 1871, the mortality of persons having the age of 0 to 5 years, did not change from the average of 1838-54 to the average of 1838-71.
Annual Mortality per cent of Males and Females in England and Wales
Ages
Males 1838-54 (17 Years)
Males 1838-71 (34 Years)
Females 1838-54 (17 Years)
Females 1838-71 (34 Years)
All Ages
2.33
2.33
2.17
2.15
0 to 5
7.25
7.26
6.23
6.27
5 to 10
0.92
0.87
0.91
0.85
10 to 15
0.52
0.49
0.54
0.50
15 to 25
0.82
0.78
0.85
0.80
25 to 35
1.00
0.99
1.06
1.01
35 to 45
1.28
1.30
1.27
1.23
45 to 55
1.85
1.85
1.59
1.59
55 to 65
3.18
3.20
2.82
2.80
65 to 75
6.69
6.71
6.00
5.89
75 to 85
14.76
14.71
13.44
13.43
85 to 95
30.14
30.55
27.92
27.95
95 & upwards
44.03
44.11
43.22
43.04
(Thirty Fourth Annual Report of the Registrar-General, 1871, p. vi)
(The number “7.25” at the top of the first column is a calculation for one year, and is to be understood that 36.25 persons in the total of the age range “0 to 5” died.)
The better classes, when they talked about “the poor”, did not mean “the totality of the working class”. For them, “the poor” were those persons who were objectively poor, that is, did not earn enough to eat properly, or were unemployed, or had very bad living conditions. The majority of workers were referred to as “the labouring classes” or “the factory operatives”, and were able to eat enough. In all the manufacturing towns, the really poor lived in clearly defined areas.
M. Faucher in 1844 mentioned “the poor quarters of the town – Angel Meadow, Garden-Street, Newtown, St. George’s Road, Oldham Roads, Ancoats, and Little Ireland. …” (Faucher, 1844, p. 27)
Herr Johann Georg Kohl made visits to several parts of Manchester, including the poor parts near the rivers Irk and Irwell. “Sometimes the work-people of each manufactory form a little community by themselves, living together in a neighbourhood in a little town of their own [probably he means Ancoats]; but in general they occupy particular quarters of the town, which contain nothing but long unbroken rows of small low dirty houses, each exactly like the other. These quarters are the most melancholy and disagreeable parts of the town, squalid, filthy and miserable, to a deplorable degree.” (Kohl, 1844, p.133)
Mr. Nassau Senior, a politician who was a firm proponent of the New Poor Law, visited Manchester on a fact-finding trip. He was steered in the right direction: “The difference in appearance when you come to the Manchester operatives is striking: they are sallow and thinner. But when I went through their habitations in Irish Town, and Ancoats, in Little Ireland, my only wonder was that tolerable health could be maintained by the inmates of such houses.”
(Senior, Nassau W., Letters on the Factory Act, as it affects the Cotton Manufacturer; Addressed to the Right Honourable The President of the Board of Trade; B. Fellowes, London, 1837; p. 16)
“Several of the habitations of the Manchester poor are low, damp, ill-ventilated, and surrounded with filth. This is especially the case in Little Ireland, and the neighbouring district, which is chiefly inhabited by Irish. This, however, the most destitute part of the population, does not in general work in factories; but it would be a great improvement in their condition if they did, as the worst room in a factory is a palace of health and comfort in comparison with their miserabledwellings. The factory workmen are usually in a very comfortable condition, many of their houses displaying neatness, and even elegance in their arrangements; and when I visited them at dinner-time, the occupants were generally eating fresh meat and potatoes.”
(Factories Inquiry Commission, Supplementary Reports, Part I, 1834; D2 Lancashire District, Report by Mr. Tufnell, p. 204)
The rapporteur for Manchester to the Poor Law Commissioners in 1842, Dr. Howard (Physician to the Ardwick and Ancoats Dispensary), made it clear that, although there were really horrible districts in Manchester, these were confined to a small number of regions.
“That the filthy and disgraceful state of many of the streets in those densely populated and neglected parts of the town where the indigent poor chiefly reside, cannot fail to exercise a most baneful effect on their health, is an inference which has fully proved to be well founded; and no fact is better established than that a large proportion of the cases of fever which occur in Manchester originate in these situations.”
(Poor Law Commissioners, Local Reports, 1842, Lancashire, p. 305)
“It appears to me to be unnecessary to lengthen this report by specifying the particular localities in which nuisances, productive of malaria, tending injuriously to affect the health of the inhabitants, and to promote the prevalence of contagious diseases, exist; but it may be well to mention a few of the streets which, either from being unpaved, or without drains, or containing collections of refuse, &c., or being over-crowded and ill ventilated, have been remarked to be particularly unhealthy.”
(ibid., p. 312)
“These two districts [Ancoats and Angel Meadow] are very densely populated, principally by hand-loom weavers and the workpeople employed in the factories, a large proportion of whom are Irish, living for the most part in a state of extreme indigence, and without the least attention to cleanliness. Altogether they comprehend by far the worst quarters of the town both as regards the wet and filthy state of the streets, the dirty, damp and dilapidated condition of the houses, and the improvidence, poverty, and destitution of the inhabitants; and, as might be anticipated, they furnish the great bulk of our fever patients.”
(ibid., pp. 313-314)
“Of the 1042 patients admitted into the House of Recovery [the Fever Hospital] from the 31st May, 1838, to the 31st May, 1839, 276 came from Ancoats district, 320 from Angel Meadow district, 104 from the Collegiate Church district, 141 from Bank Top district, 134 from Deansgate district, and 67 from Salford.”
(ibid., p. 316)
Here we have a map of the Police Districts of the Township of Manchester in 1832, in a report on the activities of the Special Board of Health against the cholera outbreak in 1831-1833.
(Record Society of Lancashire and Cheshire; The Challenge of Cholera: Proceedings of the Manchester Special Board of Health; 1831-1833, ed. Alan J. Kidd and Terry Wyke: Volume CXLV, 2010, p.2.;http://rslc.org.uk/api/file/Vol_145.pdf)
Almost exclusively inhabited by the labouring population: Districts 1, 2, 3, 4, 10
Dwellings of the operatives, and of shopkeepers and tradesmen: Districts 7, 13, 14
Central districts, containing the principal streets, the most respectable shops, the dwellings of the more wealthy inhabitants, and the warehouses of the merchants and manufacturers: Districts 5, 6, 8, 9
Undefined: District 11
Populations of each Police District:
Newtown
Ancoats
Central
Portland Street
No. 2 .. 25581
No. 1 .. 31573
No. 5 .. 7275
No. 3 .. 11431
3/5 of 4 .. 9337
2/5 of 4 .. 6225
6 .. 1274
7 .. 9784
9 .. 3318
¾ of 8 .. 2058
10 .. 3886
12 .. 1859
11 .. 13635
13 .. 7269
14 .. 6834
¼ of 8 .. 686
34918
37798
36908
32401
(Kay, 1832, p. 30)
The areas identified by Dr. Howard as having the worst sanitation and the highest number of admissions for fever are geographically located as follows:
Ancoats: Square area (400 yds. x 400 yds.) in the eastern corner of District 1, between Oldham Road and Great Ancoats Street; here were the largest cotton mills in Manchester, with workers’ houses around them.
Angel Meadow: In District 2, between Oldham Road and St. George’s Road
Collegiate Church: Central part of District 6.
Bank Top: At the intersection of Piccadilly, Portland Street, and London Road (present Piccadilly Rail Station)
Deansgate: In District 14, between Deansgate, Quay Street, and Liverpool Road.
Little Ireland (commented by Engels): Shown at the southern extremity of District 10 (Little Ireland was cleared and declared unfit for human habitation in 1847)
In 1837 Registration and Marriage Acts for the whole of England and Wales were passed, which provided for the appointment of Registrars for each locality. Mr. William Johns, the Superintendent-Registrar for Manchester, sent a report to the Statistical Society of London with the data collected for 1837-38 and 1838-39. From one of the tables, we see that there was a differentiation between the districts of the Old Township, as to child mortality. Only the areas of Ancoats and St. Georges had horrible figures for mortality under 3 years.
Districts Percentage Proportion of Deaths at different Ages to the Total Mortality in 1837-38
Under 3 years
From 3 to 5
From 6 to 15
From 16 to 25
From 26 to 50
From 51 to 70
Ancoats
50.16
9.62
6.08
4.52
14.97
10.52
St. George’s
48.06
9.09
4.98
6.30
16.61
10.18
Deansgate
41.85
9.28
5.36
6.09
20.20
13.28
London-road
38.72
6.82
4.02
9.06
25.53
11.50
Market-street
25.76
6.54
6.23
9.84
28.77
16.00
(“Ancoats, the chief seat of the cotton mills; St. George’s, containing a large portion of the Irish population”)
(Johns, 1840, p. 194)
The following report by the Manchester Statistical Society, about the condition of the working population, refers specifically to the “district inhabited more than any other in the town by the working classes and by those of the poorest description”. Geographically the area includes the Ancoats district, and also the Police District with the largest number of lodging houses.
(British Association for the Advancement of Science; Report of the Fourth Meeting, held at Edinburgh in 1834, Report by the Manchester Statistical Association; John Murray, London, 1835; pp. 690-691)
This report shows that the people in these districts had bad housing (60 % not comfortable; 85 % not well furnished), and did not pay much rent. We assume that they did not have good incomes, that is, the average was about 12 shillings for the total family, and a maximum of 16 shillings. However, 30 % paid a monthly charge to a Benefit Club (communal self-insurance for illness or death), and 1 child per family attended Sunday School. Only 0.5 persons per family worked in a factory.
This last point is interesting, because all these people lived near the large cotton mills, which employed perhaps 5,000 workers (men, women and children) in Ancoats. The assumption must be that the lower income workers lived near the factories, and in bad housing conditions, and the skilled workers lived in better areas, at a distance from the factories.
But we do know that these workers, in spite of being poor, had their own “Lyceum” (cultural and educational institute), with a subscription of 8 shillings a year:
(Report of the Proceedings Connected with the Grand Soirée of the Manchester Athenæum, Held on Thursday, October 3rd, 1844: From the Manchester Guardian of Saturday, October 5th, 1844, Printed by Cave & Sever, Manchester, 1844; p. 7)
As to the living conditions outside the factory, obviously these did not change for those families who were already living in the town. Certainly the streets and alleys were narrow, there was a lot of dirt and excrement, and the living quarters were small; but this was already part of their life. For those families who had been living in their cottage in the countryside, where they also farmed a little, the crowding and uncleanliness in the town would have been a change for the worse. But the strange part is that the workers, while they did make representations to improve the working conditions of the children, and to reduce the long hours of work, did not complain to anybody about the bad sanitary conditions in the streets. “Mr. Scott, of West Derby, after a description of the miserable condition of the fever patients attended by him, which has already been extracted, observes – “I have met many similar conditions of misery; yet amidst the greatest destitution and want of domestic comfort, I have never heard, during the course of twelve years’ practice, a complaint of inconvenient accommodation.””
(Poor Law Commissioners, Local Reports, 1842, No. 18, Lancashire, p. 274)
Not all the streets in Manchester were unpaved or had excrement piled up. We see from the following page that “only” 50 % of the streets in the working class districts (Police Districts 1, 2, 3, 4) were unpaved, and “only” 50 % contained “heaps of refuse, stagnant ponds, ordure, etc.”
(Kay, 1832, pp. 17-18; “table arranged by the Committee of Association appointed by the Special Board of Health, from the reports of the Inspectors of the various District Boards of Manchester”)
Similarly, 40 % of the houses inspected required whitewashing, 15 % required repair, less than 10 % needed repairs to the “sloughs” (drainage exits), 20 % were damp, less than 10 % were ill ventilated, and 30 % did not have a privy. This is not a good situation, and one would not like to live in these areas, but it is not as bad as the generally accepted description. We could also say “50 % of the streets did not contain heaps of refuse, stagnant ponds, ordure, etc.”, and “70 % of the houses did have a privy”. That sounds better!
It must also be taken into account, that the upper classes of Manchester did do something – starting in 1830 – to improve the drainage conditions. “In no place in England can more anxiety be shown to remedy the evils which I have described, or more humane and philanthropic desires evinced to improve the condition of the poor, than those which exist on the part of the wealthier classes in Manchester; and the following statement, made up to the end of October in the past year, of the improvements within the last eight or nine years, since the obtainment of the Manchester Police Act in 1830, will prove that the Commissioners have not been inattentive in their duties, as far as their functions enable them to act:
Number of streets paved and sewered 181
Miles Yards
Length of streets paved and sewered 16 540
Length of main sewers formed 15 678
Length of cross sewers formed 5 1223
Surface of streets paved, 289,971 square yards”
(Poor Law Commissioners, Local Reports on the Sanitary Condition of the Population, 1840, 17. Lancashire, Cheshire, Derbyshire and Staffordshire, Comment by Charles Mott, Assistant Poor Law Commissioner, p. 243)
They had also put into operation the first street-sweeping machine in the world in 1843:
The authorities in Stockport in the 1820’s and 1830’s also carried out some improvements:
“Besides the number of houses, have the conveniences of the town increased with respect of water and lighting, and so on?” “It is supplied with water by a company, with gas by a company. The town is increasing; the houses and the shops not only in number, but likewise in magnitude and in splendour. There is a general improvement in everything; it is better paved and lighted.”
“Is the sewerage also improved?” “They are making improvements in it. The old town is built upon a very uneven site, and many of the streets and alleys are inconvenient in everything; but the new parts of the town are laid out with more taste and convenience.”
(Select Committee on Commerce, Manufacture, and Shipping, 1833, Evidence of Mr. Henry W. Sefton, Stockport, p. 622)
In Leeds, the authorities – according to a report that they commissioned in 1840 – were very clear that nearly the whole town was in a bad sanitary condition.
(Statistical Committee of the Town Council, Leeds, 1840, Table I, p. 406)
However, there are a large number of people with good incomes:
(op. cit., p. 422)
At this point, we should revise the oft-quoted report of Dr. Robert Baker, “On the State and Condition of the Town of Leeds in the West Riding of the County of York” in “Local Reports on the Sanitary Condition of the Labouring Population of England” (1842), pp. 348-409.
This has a number of disagreeable descriptions of the living conditions of the working class in Leeds and of the filth in the streets, and which give a very bad impression of the town. These are clearly true and accurate; he personally went to inspect the houses. However, he himself notes that they are not applicable to the whole of the township: “The higher parts of the town are ordinarily clean for so large a manufacturing location; but the lower parts, which lie contiguous to the river and the Becks or rivulets are dirty, confined, ill ventilated, and in many cases self-sufficient to shorten life, and especially infant life, when exposed to their influence.” (p. 349).“The lower parts of the town are furthermore disgusting, particularly on account of a general want of paving and draining, …” (p. 350).“Thus, in Leeds, by drawing a line through the centre of the map from north to south, the deaths in proportion to population on the east side of the map were, in 1839, as 1 to every 24; while on the other hand, in those parts of the town where the streets are spacious and wide, and the drainage sufficient, the deaths were only as 1 to 36; both ratios being exceedingly high, but the difference remarkable.” (p. 366).
But what we have to take into account, and what was clear to his readers, is that the year 1842 was the last year of the worst industrial recession in the century. There was a general reduction in liquidity and in sales, and the working class suffered simultaneously a lowering of the wage level and a loss of jobs, which obviously led to a situation of hunger. In the Hansard report of the parliamentary debate on “Distress of the Country”, six pages were devoted to the extremely bad news about unemployment, hunger, loss of sales, insolvencies and factory stoppages in Leeds alone. “Taking into account the fall of wages and diminution of employment, the earnings of the operatives have diminished at least 50 per cent.” “I speak from personal experience, when I say there is a manifest alteration in the physical appearance of this class in the last twelve months. There is deficient sustentation written in their haggard countenances.” “Mr. Child, a butcher, believed from calculations there was one-third or one-fourth the less meat killed, and there is this striking fact – at present the best pieces realise high prices, the inferior very low; a strong proof that the working classes were much less able to purchase meat than formerly.”
(Hansard, Distress of the Country, 6th July 1842, pp. 1023-1029)
There is only one reference to the consumption of meat, which quotes the Irish children that they eat flesh-meat “never” or “perhaps once a week”. This might give us the impression that the working classes in Leeds in general (before the recession), ate little meat. But in the Hansard report, we have: “The shambles, which used to be crowded with working-men purchasing meat, were now ill attended” (Hansard, Distress of the Country, 6th July 1842, p. 1026). We can also find in the Commercial Directories of the 1830’s, that there were 200 butcher’s shops in Leeds. Which shows that impressions may not be true.
M. Faucher, who visited it in 1844, thought that Leeds had a number of advantages against Manchester, due to the air in the woollen factories being better than in the cotton factories, the working day being shorter, the workers having higher salaries (?), the population having less Irish, the poor families being able to find lodgings at a reasonable price in districts with clean air. But he also says “never has the hand of man done more to ruin nature.” (Faucher, 1844, pp. 28-29)
The Report on “Great Towns” has in the introduction a “status report” on sanitation measures in each town (here only one section).
a
a
a
a
Report of the Commissioners of the State of Large Towns and Populous Districts, Vol. 1, 1844; Abstract of Replies from 50 Towns as to Sewerage, Drainage, Cleansing, and Supply of Water, pp. xxxii – xlvii
We have the impression that all the districts of Manchester (apart from the mansions of the wealthy, on the outskirts of the town), were uniformly poor, dirty, with dirty water and excrement in the streets, and with houses with small rooms and people living in cellars. But the truth is that there was a great differentiation in the housing for the working class.
“Of the first or lowest class, averaging 1s. 3d. per week rent, the occupants are of the poorest description of persons, paying frequently one-fourth of their income for rent; by which the landlords or owners realize about eight per cent net on the outlay; whilst the dwellings are without ovens or boilers, and are often filthy, damp, and unfit for habitation; generally deficient of privies, or drainage; or, in manufacturing towns, one privy to 10 or 15 houses.
The second class of dwellings are occupied by a better class of labourers, paying about one-sixth of their incomes for rent; producing, perhaps, 8 ¾ per cent to the owners as interest on their capital; and although many of them are very defective, as regards drainage and privies, they are still much better provided than the class before described; and many of them have ovens or boilers.
Of the third or best class, the occupants being generally more skilled and a better class of workmen, whose rent amounts to about one-eighth of their income, producing 9 ¾ per cent on the outlay to the owners; and here we find far superior accommodation and comparatively comfortable dwellings, well drained, and provided with privies; frequently gardens, and in most of them ovens or boilers.
These results confirm the lamentable fact, that the lower the poor are reduced in the social scales, the more they are subject to imposition and extortion.
The cottages erected by the manufacturers, and other respectable owners of cottage property, are very superior in every respect to those built or purchased by avaricious speculators, whose sole object is gain, and who enforce the payment of their rents with rigid severity. They are moreover commodious, clean, white-washed, and in many cases have the advantage of school-houses.”
(These comments refer to the whole region of Lancashire, Cheshire, Derbyshire, and Staffordshire, not just to Manchester)
(Poor Law Commissioners, Local Reports on the Sanitary Condition of the Population, 17. Lancashire, Cheshire, Derbyshire andStaffordshire, p. 247)
(Poor Law Commissioners, Local Reports on the Sanitary Condition of the Population, 17. Lancashire, Cheshire, Derbyshire and Staffordshire, p. 242)
The table above shows that there were, for example, 3,700 families in Manchester and Salford who could pay 4 to 5 shillings a week for rent, and 2,200 families who paid 5 shillings to 8 shillings. Supposing the ratios of income to rent given above, namely one sixth and one eighth, then the medium workers had total family incomes of from 24 to 30 shillings, and the well-paid workers had total family incomes of from 40 to 64 shillings.
The houses in Manchester were built by people who used a flimsy form of construction in order to get out a maximum of profit from the property. The houses were built at a minimum cost, without cellars or foundations, and with walls of only half a brick thickness.
But the investors were not rich people, but “building clubs”, whose members were workers with good earnings and tradespeople. There had been possibly 150 of these clubs in Manchester and nearby towns; if each club had 100 “investors” at 100 pounds each, this would correspond to a total of 1,500,000 pounds. At 60 pounds cost of construction each, this would be 25,000 houses which had been built with this scheme.
The members paid 10 shillings per month, thus every 2 months the club had 100 pounds to start a building. This shows us that there were a good number of working-class men who could save 10 shillings a month, and also had taken the decision to use this amount in an “investment”. A person who wanted to build at this moment on a given lot, could take up all the money for the house, and contracted to pay the money in the following months to his co-investors. The payments for the house were assured by a mortgage on the house.
(Poor Law Commissioners, Local Reports on the Sanitary Condition of the Population, 17. Lancashire, Cheshire, Derbyshire and Staffordshire, 1842, pp. 240-241)
(J. T. Slugg, Reminiscences of Manchester Fifty Years Ago, J. E. Cornish, Manchester, 1881; Chapter XXV, Building Clubs)
The lodging houses where the indigents could sleep for from 1 penny to 3 pennies a night, were the least sanitary housing units in Manchester. There were probably 5,000 to 8,000 people sleeping in these places each night.
“In some of these houses as many as 6 or 8 beds are contained in a single room; in others, where the rooms are smaller, the number is necessarily less; but it seems to be the invariable practice of these “keepers of fever beds”, as the proprietors were styled by Dr. Ferrar, to cram as many beds into each room as it can possibly be made to hold: and they are often placed so close to each other that there is scarcely room to pass between them. The scene which these places present at night is one of the most lamentable description; the crowded state of the beds, filled promiscuously with men, women, and children; the floor covered over with the filthy and ragged clothing they have just put off, and with their various bundles and packages, containing all of the property they possess, mark the depraved and blunted state of their feelings, and the moral and social disorder that exists. The suffocating stench and the heat of the atmosphere are almost intolerable to a person coming in from the open air, and plainly indicate its insalubrity.”
(Poor Law Commissioners, Local Reports on the Sanitary Condition of the Population, 20. On the Prevalence of Diseases …. Manchester, 1842, pp. 319-320)
In Bradford a large number of the workers owned their houses:
“Do many of the labouring classes own houses?” “Many of the working classes have built their own cottages; those that have saved perhaps 60 l. or 70 l. have purchased land and raised money on mortgages, and then have erected others. In some instances clubs, sustained by monthly payments, have built, and the houses are divided by valuation and lot.
“What proportion of labouring class houses are held directly or indirectly by themselves?” “I cannot state precisely; probably there might be one-third of the cottage houses owned by the labouring class.”
“Are there other classes that are wholely dependent on cottage rent?” “Yes; I know several who sink all their capital in cottages, and depend on the rent.”
(Report of the Commissioners on the State of Large Towns and Populous Districts,1845, Vol. 2 p. 183; Bradford, Dwellings of the Working Classes, evidence of Mr. Joseph Farrar, one of the Secretaries of the Mechanics’ Institution)
Bradford, Back-to-Back Houses, Construction 1830’s, Photograph 1915
(George Sheeran, Bradford in 50 Buildings, Amberley Publishing, Stroud, 2017; Item 4, Gathorne Street, Great Horton)
The fathers of the inhabitants of these houses, who had probably lived in the countryside, could not have expected that their sons would have lived in a well-constructed house like this, and even less, that they might be owners.
In 1821, the owner of medium size flax mill in Dundee, Mr. William Brown, visited Leeds to inform himself about the spinning of flax there. He found a normal industrial town apparently without housing overcrowding or sanitary problems in the streets.
“The hands employed in the Leeds mills are nearly the same in manner, dress and appearance as those of Scotland. I observed them several times dispersing from the mills and took notice of them. A greater proportion of them seem to be young boys and girls of from nine to twelve years of age. In general they are not so stout and healthy as the Scotch – scarcely one of them to be seen of a ruddy complexion. They are certainly more comfortably lodged, their houses are but two storeys high and each family occupied a whole house. Cooking and eating in the lower flat or room and sleeping in the upper. They seem remarkably clean, and few are without neat and substantial furniture. The streets, roads and lanes are however, as irregular, narrow, wet and dirty as any in Scotland. In passing some mills on Sunday I heard knocking of hammers within, and learned that it is quite common to repair on Sundays. Indeed, tradesmen in most parts of England don’t stick at doing a bit of work on that day.”
(Brown, 1821, p. 97)
Leeds in the 1820’s was still a “pre-Industrial Revolution” town. It had a population of 49,000 in the town proper and a further 35,000 in the surrounding “out-townships”. The Museum was opened in 1821. In 1828 there were concerts (6 in the winter season), and a theatre (only in summer). The Baths were opened in 1820. The new Market Hall was opened in 1827, in a classical style, and had a large number of stalls for butchers and other tradesmen. The industries were woollen cloths, flax spinning, pottery, plate glass, and iron foundries (Meidinger, 1828, pp. 310-311).As in Manchester, there was considerable variety in the industry sectors (in both towns, only 25 % of the labour force worked in the textile mills).
The question is, how was it that the town in twenty years developed (?) into a place of extreme filthiness, as documented in the Report of the Sanitary Condition of the Labouring Population of Edwin Chadwick in 1842. In 1832 the town had an outbreak of cholera, which took 700 lives.
The primary cause was the increase in the population of 80 % in 20 years:
But as we see that the number of houses increased practically in proportion to the number of persons, it is not clear how the density of the population increased, and the sanitary condition of the town got worse (prosaically: the tons of filth, divided by the number of streets, increased).
The explanation appears to be that the new houses were not built on extensions to the area of the town, but rather were “inserted” into the existing street blocks. We can see from a comparison of the town plan of Mr. Fowler in 1817 and the Ordnance Survey Map 218 of 1846, that the continuous built-up area increased by only about 25 % between these two dates. Equally, the number of streets increased only from 450 to 586 from 1817 (Commercial Directory, Baines) to 1839 (Statistical Committee Town Council).
The method of inserting (“infilling”, “back-building”) the houses was to add new “twins” to the houses in a street. “Back-to-back houses” were formed of two houses, stuck one to another, without only one common wall forming the back wall of each. The majority were “one up, one down”, that is, the living area was below, and the sleeping area was above. What happened in the working-class areas of Leeds, was that originally there was one row of houses on a street, one row of houses on the other street of the block, and a large “court” between the houses with the privies and washing areas. It was easy and cheap to build a house on the space behind; the owner of the land had already paid for the second piece of land, and only had to pay for three walls, as the back wall already existed. The court was made much “thinner”. The population density per 1,000 sq. ft. (for example) doubled, but the number of persons per house remained the same.
The builder also did not have to add sanitary arrangements, as would have done if the houses were built in a new street. But this also meant that the inhabitants of the houses, instead of being (for example) 30 families with 5 “out-offices” were now 60 families with 5 “out-offices”. The filthiness was even greater than before.
(Ordnance Survey Plan OST (57) City of Leeds, taken from Yasumoto, 1995, Figure 18.1, p. 301, Working-class housing (back-to-back houses))
We note that every two or three houses, a passage or “tunnel” is inserted to give access from the front door of each house, via the street, to the court.
Following, a drawing of back-to-back houses in an outer area of Manchester; the houses in each block were all built at the same time, on new “streets” (we can see the washing hanging out, over the streets!).
a
(Hatton, 1854, plate after p. 8)
The back-to-back houses in Leeds (and in other towns, principally in Yorkshire) were usually 15 feet by 15 feet, and 12 feet to the ceiling, for each of the two rooms. In Leeds, these houses usually had 5 persons (2 adults, 3 children); if the house had a cellar, this was often sub-let to an Irish lodger. These houses were not pleasant or healthy to live in, but it must be said that these dimensions were roughly the same as those of the country cottages, where their fathers or grandfathers had lived.
a
(Hatton, 1854, plate before p. 9)
This house is more “splendid” than the majority of back-to-backs; normally they had only two storeys, and did not always have a cellar room.
According to opinions in the nineteenth century, the main disadvantage of the back-to-back’s was that there was no through current of air from front to back, and also no movement of air up to the upper room. This caused certainly respiratory problems in the inhabitants. The building of back-to-backs by “infilling” made the back court much smaller, and the proportion of sanitary arrangements to the number of persons much worse. Also, if you lived in a house which faced (from the front door) to the north, the sun did not enter in your house for the whole year.
We do have a detailed survey of the difference in health conditions and mortality between “through” houses and back-to-back’s, reported by Dr. Darra Mair in 1910 for the years 1898 to 1907 over thirteen industrial towns in the West Riding (A Report on Relative Mortality in Through and Back-to-Back Houses in certain Towns in the West Riding of Yorkshire).The general conclusion in the introduction was “that even relatively good types of back-to-back houses, when compared with through houses, have a death-rate from all causes taken together which is 15 to 20 per cent. in excess of the death-rate in through houses”. “… in back-to-back houses there is excessive mortality from certain important groups of diseases … The groups of diseases thus showing excess are diseases of the chest, like bronchitis or pneumonia, and diseases especially associated with defective growth and development of the young child.”
In the whole of Great Britain, according to the Census, the number of persons per house remained the same from 1801 to 1851, around 5.6; the figure was the same for England and Wales. (Cheshire, 1854, Table IV, p. 47). This means that the overcrowding in the towns was not due to an increase in the number of persons per house, but rather to the fact that the houses were being built closer to one another, i. e. inserting the houses in old parts of the town, or building in new areas with narrower streets.
The industrial towns were not more crowded in terms of persons per house, than the rest of the country (1851): Birmingham 5.1, Bradford 5.3, Leeds with out-townships 4.8, Liverpool 6.9 (cellar dwellings), Manchester 6.0, Newcastle 8.4 (tenement buildings), Sheffield 5.7, Wolverhampton 5.4 (Cheshire, 1854, Table XVII, pp. 63-68).
We also know that the houses were not being built smaller. We take the factor of decennial increase in houses from 1801-1811 to 1841-1851, 334,000 / 222,000 = 1.50 times (Cheshire, 1854, Table III, p. 52). We then take the increase in brick production, decade 1840-1849 against 1800-1809, 1,593,000,000 / 779,000,000 = 2.04 times (Lucas, 1997, p. 31). The number of bricks increases somewhat more quickly than the number of people.
Liverpool
This town was known to have worst sanitary condition in England at mid-century. The Medical Officer, Dr. Duncan, wrote his report to the Commission on the State of Large Towns and Populous Districts (1844), with the title “On the Physical Causes of the High Rate of Mortality in Liverpool”.
The reason for the high mortality and horrible problems of housing and sanitation, was that the working class-people were squeezed together even more tightly than in Leeds, and the streets and alleys were even narrower.
Liverpool had more persons living in cellars than any other town. In 1842 there were 6,294 cellars with 20,168 persons, which was 10 % of the Census population of the Parish; in 1847, the number of persons had risen to at least 30,000, due to the poor Irish who had had to flee Ireland due to the Famine. The cellars were 10 or 12 feet square and 6 feet deep below ground level; obviously they had no exits for rubbish or personal necessities.
But a larger proportion of persons were “housed” in “court dwellings”. These are sometimes described as houses, three stories high, around an open space. But the reality was much harder, and we show a model and a museum reconstruction to make clear the “claustrophobia”.
“Densely packed court housing in a state of severe delapidation in the St. Anne Street area is clearly shown in this model.
The 124 three-storey houses had been built prior to 1828. The majority were of the worst type of insanitary house, placed back-to-back without through ventilation and yard space, the closet accommodation unsuitable and inadequate, and the water supply obtained from a standpipe in the court. 563 people lived here and the general death rate was three times higher than in the rest of the city. [Your author is not in agreement with this figure]
The model, originally part of the collections of the School of Hygiene (established 1898), was used as a teaching aid for students studying public health.”
We can see that the small passageways make the movement of refuse very difficult, as also the ventilation.
COPYRIGHT LIVERPOOL MUSEUMS
Here we have a reconstruction of a central court, with the house entrances. Usually there were about 6 houses per court, each with a separate door. The houses were of 3 storeys, one room on each floor, the room was about 12 feet by 14 feet. There would be one toilet area per court.
COPYRIGHT LIVERPOOL MUSEUMS
In 1842 there were 1,982 courts with 10,692 courthouses, inhabited by 55,354 persons (25 % of the town’s population). In 1864, when new construction was prohibited, there were found to be 3,073 courts with 17,825 courthouses, inhabited by about 110,000 persons. On average 5.5 persons lived in each courthouse (480 sq. ft).
Those of the population who did not live in cellars or in courthouses, inhabited “back-to-back” houses, or shop/warehouse buildings which had been abandoned by their owners (better income level) when they left the commercial centre to live in the newer parts of the town. These had more square feet per person, but the sanitary installations were just as bad.
Dr. Duncan, who would be named the first Medical Officer of the town of Liverpool, and carried out many projects to improve the living and health conditions of the people, was of the opinion that the main cause of the high mortality was the extreme density of the people in the houses, and of the houses in the area of the town.
Towns
Population 1841
Deaths
Inhabitants to sq. mile (total area)
Inhabitants to sq. mile (builded area)
Metropolis
1,870,727
1 in 37.38
27,423
50,000 ?
Birmingham
138,817
“ 36.79
33,699
40,000 ?
Leeds
168,667
“ 36.73
20,892
87,256
Sheffield
85,293
“ 32.92
–
–
Bristol
64,298
“ 32.38
–
–
Manchester (Township)
192,108
“ 29.64
83,224
100,000 ?
Liverpool (Parish)
223,054
“ 28.75
100,899
138,224
(Dr. Duncan, Table 3 and Table 7)
But the mortality rates per ward (12 in the parish) actually varied from 1 in 23.50 (Vauxhall) to 1 in 41.62 (Rodney-street + Abercromby).
The population of these areas seems to have good incomes in the first third of the century. We have a report of the majority of the families in Vauxhall ward in 1835 (Fitch, 1842). 15 % of the men were middle class, 45 % were labourers, 25 % were mechanics and artisans; of these last, 150 were engineers and smiths, 160 joiners, 250 shoe and boot makers, 140 tailors, and 190 sailors and ship pilots. The gross income on an average of 50 families was 17.5 shillings per week; of which 2.5 shillings was spent on meat, 3.1 shillings on bread, 0.3 shillings on oatmeal, 1.0 shillings on potatoes, and the rest of 10.5 shillings on rent, clothing, etc. Of the totality of habitations, 581 are good or comfortable, 1355 are tolerable, 764 are bad, 680 are miserable, 218 are destitute (these housing data are from 1842, at the end of the Depression).
The financial situation of the people was made catastrophic by the Depression of 1839-1842. The average income was reduced to the half in 1842, and one third of the families had no visible means of support. They did however return to reasonable level in the following years.
But in 1847-49, at least 60,000 Irish persons arrived and stayed, fleeing from the Famine in their country; and this was at the same time as an epidemic of typhus. They generally found a place to sleep in the cellars, as they had no money, which meant that in many cases 9 persons were sleeping in one cellar. These persons for the first years were absolutely destitute, so they had to be given soup and bread at the cost of the town council. The ratepayers were assessed to pay 1 shilling in the pound, 3 times, additional to their basic rate (Lowe, 1974, p. 160); this at a time when “outdoor relief” was illegal in the country.
The intention of this section is to revise if the wages in the first years in the factories were or were not higher than for the preceding generation of workers.
In 1818, according to a newspaper, the men spinners had a net wage of 31s. at least, and the boys and girls at least 17s. (See Chapter Three).
In 1829, the spinners’ union stated that the top class of spinners earned 40 shillings, and gave other information from which we can calculate that the average for men spinners was 22 shillings. (See Chapter Three)
According to G. H. Wood, in “The History of Wages in the Cotton Trade”, the wages for 1st. class spinners in 1806 was 33 shillings, and the average 26 shillings; in 1814-1822 the top class was 32 shillings, and the average was 26.
(Wood, 1910, Table 6, p. 28)
We also have figures in the early years from one cotton mill:
A Statement of the clear average Earnings of Spinners, Dressers, and Weavers, in the Employ of Mr. Thomas Ashton, of Hyde, in the county of Chester, cotton manufacturer, in the years undermentioned.
1816
1821
1826
1831
1832
L. s. d.
L. s. d.
L. s. d.
L. s. d.
L. s. d.
Spinners, 1st class
1 17 0
1 13 6
1 15 0
1 14 0
1 15 0
Spinners, 2d & 3d
1 10 0
1 7 3
1 7 0
1 8 0
1 8 2
Spinners, 4th
0 19 8
1 0 0
Dressers
1 10 0
1 10 0
1 10 0
1 10 0
1 10 6
Weavers, power-loom(young girls)
0 14 0
0 14 0
0 13 0
0 12 0
0 12 0
(Taken from Baines, 1835, p. 445)
From the above data we can calculate the progression of the earnings of the average of the principal male workers (1769 weaver, 1797 spinner, 1806 spinner, 1814-22 spinner, 1816 spinner):
Year
1769
1797
1806
1814-22
1816
Wage shillings
7
16
26
26
33
Cost of quartern loaf (d.)
6
7 ½
11
11
12
Wage in loaves
14
25
28
28
33
Cost of 1 pound of meat (d.)
3
5
7 ½
7
7 ½
Wage in pounds of meat
28
38
41
44
52
Thus the earnings of the man increased from 1769 to 1797 by 130 % in shillings, by 90 % expressed in loaves, and by 40 % expressed in meat. The figures for 1797 to 1816 were 100 % in shillings, 20 % in loaves, and 35 % in meat.
We can also carry out the calculation “backwards”, that is, with deflation to previous dates. The man in 1797 with 16 shillings could buy 25 loaves a week; in order to buy 25 loaves a week in 1769, he would have needed earnings of 12 shillings. The man in 1816 with 33 shillings could buy 33 loaves a week; in order to buy 33 loaves a week in 1797, he would have needed earnings of 20 shillings; in order to buy 33 loaves a week in 1769, he would have needed earnings of 16 shillings. No working man in Lancashire, nor in Yorkshire (except some in Sheffield), was earning 16 shillings in 1769.
In order to take into account the movements in the wages of the women and children, and particularly the changes in the type of employment inside the family, we can calculate the total income for a family of 1 man, 1 woman, and 1.5 children (the proportion in 1833):
Year
1769
1797
1806
1814-22
1816
Wage man shillings
7
16
26
26
33
Wage woman shillings
3.5
8
14
Wage child shillings
1.5
4
4
Wages 3.5 persons
13.7
30
53
Cost of quartern loaf (d.)
6
7 ½
12
Wages in loaves
27
48
53
Cost of 1 pound of meat (d.)
3
5
7 ½
Wages in meat
55
72
84
The total family earnings increased from 1769 to 1797 by 120 % in shillings, 75 % expressed in loaves, and by 30 % expressed in meat. From 1797 to 1816 the figures were 75 % in shillings, 10 % in loaves, and 15 % in meat.
Year
1769
1797
1806
1814-22
1816
Cotton worker
7
16
26
26
33
Agricultural labourer
6.5
8.5
10.6
11.5
11.9
This means that there was a clear rise in the wages of these people, when they entered the factory. From this time onwards, the cotton mill workers had a higher level of income than many other groups in the economy. For this reason, it is not surprising that they remained at the same wage level for the next 50 years. This was reinforced by the fact that the cost of living went down by 20-25 % in the same period.
We have a comparison between textile wages in 1760 and in 1856:
“The weaver, if the spinning was not done by his own family, paid the spinner for the spinning, and the spinner paid the carder and the rover. The weaving of a piece of chains or thicksets, containing twelve pounds of weft, at 1s. 6d. per pound, occupied a weaver about fourteen days, and he received for the weaving 18s. The spinning of the weft, at 9d. per pound, amounted to 9s.; and the picking, carding, and roving of the article, at the same sum per pound, reached 9s. Thus, when the weaver took the piece to the master, he received 36s., out of which he paid the spinner 18s., the spinner paying 9s. for the carding and roving. A weaver required three grown persons to supply him with weft.
At this period (1760) wheat was 5s. per bushel, of 70 lbs.; meal, 20s. per load; beef, 2d. per lb.; a neck of mutton, 9d.; and cheese, 2 1/4 d. per lb. Land let for £1 10s. the Cheshire acre, and a weaver’s cottage, with a two-loom shop, for £2 or £2 10s. per annum.
The average rate of wages earned by power-loom weavers at the present time (1847) is 10s. per week each, cotton spinners 17s. per week, card-room hands from 9s. to 10s., and adult piecers from 9s. to 11s. At the present period, wheat is about 10s. 6d. per bushel, of 70 lbs.; meal, £2 l0s. per load; beef, 6 ½ d per lb.; and cheese, 7d. per lb. Land in this part of the country now lets for £5 per Cheshire acre, and the annual rent of an ordinary factory operative’s cottage is about £6 10s. to £7 10s.”
(Butterworth, 1856, pp. 103-104)
Worsted
In the worsted industry there was no “jump” in the wages, because the change to a factory environment only began in 1820, and the change in work methods was not great. The increases in nominal wages were exactly given to cover the costs in food costs. The wool comber changed from 18 loaves per week in 1769 to 19 loaves in 1825, the girl spinner from 6 loaves per week in 1769 to 3 loaves in 1825 (introduction of machinery, made the work easier), and the hand-loom weaver from 14 loaves per week in 1769 to 14 in 1797 and to 24 in 1825 (high volume of production from spinners).
These data do not show a particularly positive movement in wages during the beginning of the factory phase, as was the case in the cotton industry. What did happen was that the real wages stayed at basically the same level from 1770 to 1825, and that this was in spite of the fact that the population of Bradford increased exceptionally.
There was no “jump” in the real wages in Leeds, and for the same reasons as in Bradford. The wool sorter improved from 27 loaves per week in 1805 to 33 loaves in 1825, the slubber from 35 loaves in 1797 to 30 loaves in 1825, the male spinner from 27 loaves in 1797 to 23 in 1825, and the hand-loom weaver from 16 loaves in 1797 to 15 loaves in 1825.
We repeat here the remarks quoted in Chapter Four, referring to the contracting of the earlier workers to the mills. These all show that the initiative for looking for these men came from the mill-owners, and that they had to offer high wages to induce the men to change to the factories. It is not true that the men who entered the mills were agricultural workers, who were forced by hunger to look for work.
“When I began work in the cotton manufacture the workmen were not accustomed to that description of labour; they were joiners, carpenters, and colliers, who were induced by the higher wages which spinning yielded, to abandon their handicraft trades, and become spinners. These men brought their wives with them, women who had been accustomed to outdoor employment.”
(Titus Rowbotham, mechanic, quoted in Faucher, 1845, p.73)
“The art of spinning on Crompton’s machine was tolerably well known, from the circumstance of the high wages that could be obtained by those working on it, above the ordinary wages of other artisans, such as shoemakers, joiners, hat-makers, &c., who on that account left their previous employment.” (Baines, pp. 203-204)
“You have been a witness of the formation of the operative class in these parts: you have seen it grow from nothing into a great body in the space of a few years; how was it recruited; of what was it composed; what were the spinners taken from?” “A good many from the agricultural parts; a many from Wales; a many from Ireland and from Scotland. People left other occupations and came to spinning for the sake of the high wages. I recollect shoemakers leaving their employ and learning to spin; I recollect tailors; I recollect colliers; but a great many more husbandmen left their employ to learn how to spin; very few weavers at that time left their employ to learn to spin; ….”
(Factories Inquiry Commission, Supplementary Report, 1834, Evidence of Mr. Thomas Yates, spinner and foreman since 1797, Part 1, p. 169)
“You are a native of this part of the country, but you quitted it about the year 1800, at the time when spinning by power was just coming into general use. Can you give me any information about the manner or way in which the persons who were then being wanted for spinners were procured and collected together by the masters?” “The deficiency of hands led the masters to give great wages, and that led the people to transport themselves to these depôts of machinery, and they came in flocks from all occupations, and thus the great mass of operatives was assembled in these depôts.”
(Factories Inquiry Commission, Supplementary Report, 1834, Evidence of Mr. Richard Wilding, Part 1, p. 171)
The same process took place when a cotton mill was introduced into Macclesfield, Chester, which at that date (1785) had 12 silk mills:
“About 40 years ago, or in the year 1776, the wages paid to the Millmen and Stewards was seven shillings a week; that of the women employed as doublers, three shillings and sixpence. Children employed in the Silk Mills were hired for three years, at the rate of sixpence per week for the first week, ninepence, for the second, and one shilling, for the third. Butter was then fourpence per pound in Macclesfield Market; best cheese twopence halfpenny; and prime beef twopence. Mutton and veal were then bought by the joint; brown bread was sold for five farthings the pound, and fine flour at one shilling the peck of eight pounds weight. Milk was sold at a penny a quart.
…….. In 1785, some Lancashire men came to Macclesfield and erected a manufactory for spinning Cotton on the banks of the Bollin, in that part of the town called the Waters. ….. As the Cotton manufacture was then in a high state of prosperity, higher wages were given to Cotton spinners than the Silk throwsters could afford; consequently a large number of their people left them for the sake of greater emolument. A temporary stagnation of business particularly among the throwsters who had but a small capital, was the consequence; while the more opulent were compelled to counteract the influence of the cotton manufacturers by advancing the wages of their Millmen, Doublers, and the children employed in the silk mills. In a short time after Cotton spinning was established in Macclesfield, the Millmen employed in the Silk Mills were paid about sixteen shillings a week on an average; the doublers from eight and sixpence to ten shillings; and children two shillings and sixpence, three shillings, four shillings, and five shillings a week, according to dexterity.”
(Corry, 1817, pp. 66-67)
There were many advertisements in the newspapers in the towns, looking for men mule spinners.
An advertisement for spinners to work in a new Mill in Bolton in 1816 : (cottages!; liberal wages!; constant employ!)
(Kelly, Nigel, et al., Britain 1750-1900, Heinemann, London, 1998, p. 44)
“Before Arkwright began to build his industrial empire, Derbyshire gained a poor living from a declining mining industry and some domestic spinning and weaving. Cotton spinning produced an immediate increase in living standards, and within a generation wage rates had doubled.”
S. D. Chapman; The Transition to the Factory System in the Midlands Cotton-Spinning Industry; The Economic History Review, New Series, Vol. 18, No. 3 (1965), pp. 526-543; Economic History Society; http://www.jstor.org/stable/2592563; p. 543.
(The same phenomenon took place at the beginnings of the textile factories in New England in 1820 to 1840. The mill owners in Lowell sent wagons out to pick up the girls who wanted to work in the factories. These girls were generally farm girls, daughters of farmers, who did not have a great financial need, but wanted to earn money, often to help their brothers to study for a good career. The wages offered were the double of those in other occupations which might be open to them. The reasons for this difference were to compensate them for the distance from their families, and for the “bad reputation” in general of factory girls. The wages in Lowell were from US$ 2.50 to 3.00 or more a week, less US$ 1.25 for dormitory and food; the other possible occupations would only pay US$ 1.50, and in bad working conditions.)
(Lebergott, Stanley; Wage Trends 1800-1900, Chapter in Trends in the American Economy in the Nineteenth Century, National Bureau of Economic Research, published by Princeton University Press, 1960; www.nber.org/chapters/c2486.pdf; pp. 450-452;
The mill-owners in Lancashire were not absolutely fixed on the idea that they had to reduce their wage costs, and always pay the minimum contractual amount:
“In order to encourage my weavers to make a good article, I had given them one pound above their regular wages. I have paid thousands of pounds at various times in extra wages. I always told my workmen that I would give them from five shillings up to a pound extra, in proportion as they did them to my satisfaction, and I could always make the most profit on those goods which had cost the most for weaving. I therefore always took care not to leave my men dissatisfied with what I gave them. I held out every encouragement for them to make as good an article as possible. Had I not done so, it would have been a cause for them to have slackened in their endeavours. I had at this time [1818] two hundred and one weavers, who each averaged above a pound a-week, and a number of others who averaged above thirty shillings weekly. I have met many of them since, who have told me they could not get fifteen shillings for the same labour, as they got thirty shillings of me.”
(William Hirst, History of the Woollen Trade for the Last Sixty Years, S. Moody, Leeds, 1844; p. 25)
The “price lists” for each type of machine, agreed between owners and spinners, fixed a wage level for each quantity, calculated in such a way that if the spinner produced more, he could keep a part of the extra value of production. We have two examples below.
A spinner working in the first half of 1834 was working with a mule of 324 spindles, with which he produced sixteen pounds of yarn No. 200, in sixty nine hours. He was paid at a rate of 3s. 6d. a pound, which gives a total of 54s. gross. He had to pay 13s. for two assistants, which gives a net income of 41s. the week. But then his machines had their throughput doubled. He could thus produce thirty two pounds of the same yarn. His tariff was changed to 2s. 5d. a pound (i.e. it was not reduced to the half), and thus he received 77s. 4d. net. From this were deducted 27s. for the wages of 5 assistants, which gave 50s. 4d. net. His earnings were increased by more than 20 per cent, while the labour cost of the yarn was reduced by 13d. per pound.
(Factories Inquiry Commission, Supplementary Report, 1834, Mr. Cowell’s Preface to Tables, p. 119l; and see the complete exposition by Mr. Cowell, pp. 119e to 119n)
Before 1842 the spinner’s wages for the production of 20 lbs. of No. 70 yarn on a pair of mules of 400 spindles each were 4s. 7d. a pound, corresponding to 20s. net a week. In 1859, with a pair of mules with 800 spindles each, he could earn 30s. 10d. net per week, although the rate had been reduced from 4s. 7d. to 3s. 11d.
(Chadwick, 1860, pp. 5-6)
“At your factory are you obliged to get through a certain quantity of work in a day?” “Yes.”
“Is there any extra wages for the spinners getting through more than a certain quantity of work?” “Yes.”
“What are those extra wages?” “There is a clock on every wheel which we work by, to shew how many stretches we have done in a day; and after we have run such a quantity of hours we have a penny an hour for every one we do above.”
(House of Lords, Reasons in Favour of Sir Robert Peel’s Bill, 1819, Evidence of John Mellor, spinner, p. 33)
“How a rural, mostly self-employed labor force was enticed to work in mostly urban mills is one of the most interesting questions in the debate on the Industrial Revolution, and yet it has not received much attention in the literature produced by economists. One answer given, ironically, by the social historian Perkin is purely economic: «By and large, it was the prospect of higher wages which was the most effective means of overcoming the natural dislike for the monotony and quasi-imprisonment of the factory» (Perkin, 1969, p. 130). Pollard (1965) and Thompson (1967) suggest a variety of alternative ways in which the factory owners educated their workers in their own image, trying to imbue them with an ethic that made them more docile and diligent. Punctuality, respect for hierarchy, frugality, and temperance were the qualities that the value system tried to convey onto the younger generation. The factory owners used a combination of approaches; they relied first and foremost on semi-compulsory apprenticed child labor from workhouses (“pauper apprentices”) and on women driven out of their cottage industries by the rapid mechanization of spinning. Gradually, they created a more balanced labor force by a combination of higher pay and social control. An example is provided by the research of Huberman (1986; 1991; 1992; 1996). Huberman points out that although in the pre-1800 period the labor market in Lancashire worked in the classical fashion, with flexible wages equating supply and demand, employers soon found that they needed more than a labor force that was available. They needed a labor force that was loyal, reliable, and motivated. To ensure this they paid wages that soon became institutionalized as «fair wages» and lost their flexibility. The emergence of such wage rigidity in some industries meant that when demand fluctuated, the adjustments would take place through quantity adjustments: layoffs and short-time became commonplace.”
(Mokyr, 1999, p. 87; see also Pollard, 1965, whole article)
(Your author is not in agreement with the last sentence. When there was a decrease in sales volume, in a number of cases, the owners were able to make the men agree to take a 10 to 20 % wage cut. There were some strikes started by the workers, because when the situation returned to normal sales quantities, the owners refused to give back the 10 or 20 %.)
The conditions of housing and sanitation in the towns of Lancashire, particularly Manchester and Liverpool, were bad and very bad. But this does not mean that all the persons in the textile industry in Lancashire, Cheshire, and Derbyshire had horrible housing. There were a large number of mills in the hilly areas with cottages for the working population, good treatment by the employers, and schooling. An incomplete report gives 72 mill estates with 2983 cottages.
(Smith, 1976, Appendices A, B, C)
There is an information from the correspondent of the “Morning Chronicle” from 1849: “A “rural factory”! To how many will the phrase seem a contradiction in terms! In the minds of how many are even the best features of the cotton mill associated with the worst features of a squalid town. And yet, thickly sprinkled amid the oak-coppiced vales of Lancashire, with the white-washed cottages of the work-people gleaming through the branches and beside the rapid stream, or perched high on the breezy forehead of the hill, are to be seen hundreds on hundreds of busily working cotton mills. In the vicinity of these there are no foetid alleys, no grimy courts, no dark area or underground cellars. Even the smoke from the tall chimneys passes tolerably innocuously away – sometimes, perhaps, when the air is calm and heavy, dotting the grass and the leaves with copious showers of “blacks”, but never seriously smirching nor blighting the dewy freshness of the fields and hedgerows, through which the spinner and the weaver pass to their daily toil.”
(Morning Chronicle, Vol. 1, p. 33)
(It should be pointed out, that the rapporteurs of the Morning Chronicle were sent to out to report on the poverty in the working classes; when they found horrible poverty, they did not hesitate to give the facts)
The activities of these country mills, from 1790 to 1860, are not commented in contemporary books on the cotton industry or in government statistics, nor in modern history books or academic investigations.
Mr. Isaac Hodgson, owner of a mill with water power at Caton, in the North of Lancashire, gave the 1818 Lords Committees on the Preservation of the Health and Morals of Apprentices, some information about the operation in his mill. He has 137 persons, including 57 children.
Age. Number
9 1
10 to 11. 9
12 to 15 47
16 to 19 21
20 to 29 30
30 to 39 18
40 to 49 7
50 to 5 3
67 1
(p. 201)
Is the Nature of the Work required in the various Departments of Cotton Spinning such as to demand the Labour of Adults beyond a certain Age, or is it chiefly young Persons who are so employed?” “In all the Water Spinning, Spinning by Water Frames, whether turned by Steam or by Water, a very small Number of Adults are required; I have not Occasion, including Joiners and Smiths, for Eleven or Twelve Men altogether; the Remainder may be Children or young Women.” (p. 202)
“I have not any of those called Piecers, mine being water-spinning.” (p. 208)
“Do they draw out the Frames themselves?” “They do not draw out; the Water Frames are constantly going, and the Spindles are stationary” (p. 208).
A young person of 12 to 14 years would earn 3s. to 5s. A young woman of 18 or 20 would earn 7s. An adult woman of 18 years would earn 7s., but would have any increase in the following years. A child of 10 years would start with 18 pence a week for three quarters of a day, and then increase to 7s. in the following years, with more experience. A young person of 14 years earns from 4s. 6d. to 6s.
(p. 212)
The rapporteur of the General View of the Agriculture of Lancashire for 1815, received the following information from Mr. Hodgson. We see that the amount of food is considerable.
Mr. Strutt, owner of the Belper Mill in the Derwent Valley, sent a written report to the 1816 Commission:
“Average weekly earnings of each child under ten years old, 2s. 6d. The average size of the rooms is from 100 to 150 feet long, 30 feet wide, and 9 feet high, and the number of cubic feet of space for each person is 1,104.
Pure air, (warmed when necessary), is transmitted into every room constantly, at the rate of upwards of 100 gallons per minute for each person.
No apprentices, (except as mechanics) are employed, and they reside with their parents, and receive weekly wages.
The working hours are twelve, six before dinner, (which is from twelve to one), and six after; each of which six hours includes the time for breakfast and tea. This has been the invariable practice at the original silk mill at Derby, in this neigbourhood, for more than a hundred years.
In complexion and general appearance, the persons employed here are not at all inferior to those whose occupations are in the open air, being without the paleness which generally accompanies sedentary employments, better fed, better clothed, and accustomed to habits of much greater regularity than persons whose trades do not require attention at regular and stated periods, their health is more vigorous, and in consequence of the good conditions of their houses, and the invariable practice of white-washing them, infectious diseases rarely occur.
The number of children instructed at day schools at the expenses of the proprietors: 64.
The number of children instructed at Sunday schools at the expenses of the proprietors: 650.
The number of children instructed at day schools by their parents: 700.
The number of children who attend other Sunday schools: 700.
The proprietors of the works are now erecting Lancastrian schools for 500, which are nearly completed; after the establishment of which, it is their intention not to employ children that are unable to read.
It is well known in this neighbourhood, that before the establishment of these works the inhabitants were notorious for vice and immorality, and many of the children were maintained by begging; now their industry, decorous behaviour, attendance on public worship, and general good conduct, compared with the neighbouring villages, where no manufactures are established, is very conspicuous.”
(Mr. Jedediah Strutt, mill owner, Belper,Derbyshire, 1816, p. 217)
Two external inspectors certified the good conditions in Pappelwick Mill in Nottinghamshire:
“We, the undersigned, beg leave humbly to certify to the Honourable the Committee appointed by the House of Commons to take into consideration the state of the hands employed in the manufactories of the United Kingdom, that we have this day visited and carefully inspected the cotton mills of Messrs. James Robinson and Son, situate at Pappelwick in this County, and that we paid particular attention to the establishment, as to the general conduct observed towards the children. The rooms wherein the work is carried on we found spacious, airy, clean, and particularly calculated, by warm flues and ventilators, to ensure comfort in all seasons. The employment of the children is neither laborious nor sedentary, constant motion being requisite for working the machinery. The hours of work are twelve, beginning at six in the morning and ending at seven in the evening; out of which an hour is allowed for dinner, besides sufficient time for breakfast, as also for tea at five in the evening. Such of the children as were apprentices we particularly attended to; they were all well-clothed and clean, appeared cheerful, and professed to be perfectly contented with the usage they received in, every respect. The proficiency of the older boys in various branches of learning was far beyond what could have been expected of children in their situation; of the younger ones there were very few but could read well, and say the whole of the church catechism; every Sunday they attend church as well as a Sunday-school. We should feel it an intrusion to trouble the Committee further on this head, than merely to observe, that the whole of the establishment appears to us to be conducted with the utmost propriety and humanity; and that its rules and ordinances are highly calculated to inspire the lower orders with a spirit of industry and subordination.”
[Signed by the Acting Magistrate for the county, and the curate of the nearby town]
(1816, p. 221)
A number of the mill owners treated their employees well, for example, Messrs. Strutt, Belper and Milford; Messrs. Greg, Bollington and Quarry Bank; Mr. Grant, Bury; Messrs. Ashton, Hyde; Richard Arkwright Jr. at Cromford and Matlock; Messrs. Ashworth, Turton and Egerton; Akroyd, Copley; The Duke of Norfolk, Glossop.
The factory at Belper (founded 1804) had day schools for the small children, and evening and Sunday schools for those work during the day. Belper and Milford together had 609 cottages.
The mill at Quarry Bank (built 1784, taken over by the Gregs in 1832) at Styal, took generally apprentices (orphans or abandoned) from the poorhouse at Liverpool, started with young boys, but later only young girls. They were taught reading, writing, and arithmetic, and the girls had lessons in sewing. The working hours were 12 daily. There were about 50 workers’ cottages, with parlour, kitchen, two bedrooms, outside privy, and a small garden. The five Greg mills had about 2,000 employees.
(Report from the Select Committee on Manufactures, Commerce and Shipping, 1833, p. 675, pp. 680-682)
Styal village cottages in the nineteenth century (built from 1805 to 1830)
A recreated cottage interior, part of the housing at Quarry Bank Mill, Styal, built for mill workers. The housing was relatively good compared to those in industrial towns. Each cottage had an allotment garden to supplement the families’ basic diets.
Having built his mill in a place with a very scanty population Greg had to obtain the workers he required from other places. The labour imported into the mill was of three types: (a) apprentices taken from the workhouses (no children younger than nine years were ever employed at this mill) who were housed, clothed and fed, but who received no wages; (b) apprentices, who were engaged by a contract made with their parents, and who were housed and fed (but not clothed) and paid a small weekly wage ranging from 9d. to 1s. 6d.; (c) free labour, much of which was obtained through Cheshire overseers and taken from Buckinghamshire and Berkshire through the Poor Law Commissioners.
Greg had also to provide for the needs of the families he persuaded to settle at Styal. To do this he built cottages, or bought farms and made them into cottages, and opened a shop, which, judging from the bewildering variety of commodities stocked, was a forerunner of Harrods. As the colony increased in size, a farm was bought which supplied the workpeople with milk, butter and other farm produce. In 1822 a chapel was built – many of the operatives were Baptists – and a minister was engaged at a stipend of £80 a year. The following year an institution for lectures and social functions and a school were erected at Styal.
The shop accounts cover the period 1823-1828 and tell us the goods purchased for the shop, the general running expenses, the sales, and profits. The farm book contains the amounts of milk and butter sold to the villagers every day from 1825 to 1831. The Apprentices House accounts relate to the years 1823-1828 and give the cost of maintaining the apprentices.
There is little evidence as to the cost of living at Styal, but plenty of evidence as to the kind of food eaten by the workers’ families. Flour, meal, potatoes, bacon, a little fresh meat, cheese and large quantities of skimmed milk were the staple foodstuffs sold to the operatives and their families. The better-off families always had new milk (at 2d. a quart) and butter (at 1s. 4d. a pound), and nearly all families had at least half-a-pound of butter a week in days of prosperity; but in the hard times of the late ‘20s butter became a luxury beyond the means of all but men earning the highest wages; even the consumption of skimmed milk, at 1d. a quart, had to be cut down. Buttermilk, the demand for which remained fairly constant, was sold at ½ d. a quart.
The only articles for which prices are given are new, skimmed, and sour milk, cream and butter, which, as one would expect in an agricultural district, were sold at prices considerably below town prices. This would probably be the same in the case of all farm produce, such as bacon, cheese and vegetables. The prices paid for the other commodities would, of course, depend on the way in which the Gregs took advantage of their monopoly of sale.
The shop accounts afford us a glimpse of human nature which shows how quickly an increase of income is reflected in the attire of the women and girls. There are no wage books for the ‘20s, but it is probable that wages were increased through overtime. Before 1825 the shop stocked pattens, or clogs, and shawls for its women customers, but during 1825 hats and shoes figure in the accounts; £21 7s. 3d. was laid out on millinery, and “plate” hats were evidently fashionable in Styal. The boom in hats did not last long, for declining trade checked the spread of the new fashions; only about £10 was expended on hats in 1826, and still less in the next two years, and clogs once more became the principal footwear.
To be just to the women it must be added that they took advantage of the period of prosperity to replenish their household goods generally, and a brisk trade was done in blankets, calico, cambric, stockings, underclothing and clothing of all kinds. The shop laid out £318 16s. 9d. on these goods in 1824, £490 13s. 7d. in 1825, but only £314 3s. 6d. in 1827.”
(Collier, 1964, pp. 39-40; information taken from the account books of the enterprise)
The factory of Mr. Ashton at Hyde employed 1,500 persons (10,000 in total of 5 factories in different locations). The houses for the workers, were 300, in long streets, and were rented at three shillings a week. Each house had a sitting-room, a kitchen, a back-yard, and two or three bedrooms in the upper storey. The owner supplied the water and made the necessary repairs. There was a large schoolhouse, which also served as a chapel. From an official report in 1833, out of 1175 workers, 87 could neither read nor write, 512 could read, 576 could read and write well. The average wages were for men 24s. to 25s., women 12s., children 3s. to 5s. There were ten men who had saved up enough money to build 46 houses for renting.
(Journal of the Royal Statistical Society, Vol. 1, 1839, pp. 416-420)
“What time do you allow for meals?” “As to breakfast, it is very irregular. In the summer-time the bell rings for breakfast at half past eight; those who go to breakfast, which includes the workmen, but not the spinners, go and stay half an hour. There is a room called the dinner-house, in which there is a range of hot plates or stoves, much the same as in gentlemen’s kitchens; the mothers, or the younger sisters of the hands employed, bring the breakfasts into this room; they bring them probably a quarter of an hour before the bell rings. As soon as the bell rings, a number of boys, perhaps eight, carry those breakfasts into the different rooms in the factory; those who come first may receive their breakfasts probably in two minutes; those who come later may not receive it for a quarter of an hour; so that possibly some of the hands may have eight-and-twenty minutes at breakfast, others cannot have more than fifteen, they cannot have less. In the afternoon the bell rings at four, and they are served in like manner; but very few have their refreshment, probably not more than one in five, I should think.”
(Select Committee on the State of Children …, 1816, Sir Richard Arkwright, son, mill-owner at Cromford, water-spinning, p. 277)
The children are not taken into work under ten years old, this with the intention that they have learnt to read when they start employment.
The two factories of the brothers Ashworth employed 500 workers of both sexes, but married women were not allowed to work in the factories, but given tasks to be done in their houses. The houses were rented for ten pounds a year.
The houses of the workers of the factory of the Duke of Norfolk in Glossop, were built of stone walls, slate roofs, and stone flagging on the floors; they were about 30 feet by 15 feet, and 7 feet 9 inches high. They had a supply of water, privies, area for a pigsty and allotment.
(Poor Law Commissioners, Local Reports on the Sanitary Condition, 17. Lancashire, Cheshire, Derbyshire, Staffordshire; p 248-250)
(See laudatory comments on a number of owners: Faucher, Études sur l’Angleterre, 1845, Tome I, La Manufacture Rurale, pp. 377-441; and Chadwick, 1842, Employers’ influence on the Health of Workpeople by means of improved Habitations, pp. 233-253)
Those mills that were outside the towns, and not near to other settlements, as is reasonable, had a community life (leaving aside the “apprentice” mills in the early years):
“In 1806 we purchased the print works belonging to Sir Robert Peel, &c., situated at Ramsbottom. In 1812 we purchased the Nuttal factory. In consequence of the death of Mr. Alsop, the workpeople had been long short of employment, and were very destitute. We ordered the manager to get new machinery of the first-rate construction, and greatly extended the building; and before we began to spin or manufacture we clothed the whole of the hands at our own expense, prepared an entertainment for them, and observed that the interests of masters and servants are bound together, that there are reciprocal duties to perform, that no general or admiral could be brave unless he was supported by his men, that we know how to reward merit, and would give constant employment and liberal wages to all faithful servants; and I am happy to say that they, as well as those at our printing establishments, with very few exceptions, have conducted themselves with great propriety.”
(Letter of William Grant, mill-owner, in 1837, quoted in Collier, 1964, p. 14)
We have an exceptional case of a “chain of evidence”:
“One old lady of 80, the daughter of an apprentice, gave, in answer to our enquiries [Mr. Unwin was writing in 1924], a graphic account of her mother’s journey from the Duke of York’s Orphanage at Chelsea, in a stage coach, and her life in the ‘prentice house. According to her account the children worked long hours, but every day went through exercises in the meadows in front of their house, which kept them in good health. On Sundays they went to church in the morning and evening, by a private road to Marple Church made by Oldknow [the mill owner] for this purpose. They were dressed in their best clothes and were accompanied by their employer. Their food was the best that could be procured. They had porridge and bacon for breakfast, meat every day for dinner, puddings or pies on alternate days, and when pigs were killed were regaled with meat pies which were full of meat and had a short crust, such as, the inquirer was solemnly informed, cannot be produced in these days. All the fruit in the orchard was eaten by the children.”
(Unwin, 1924, p. 174)
“Oldknow died at Mellor Lodge on September 18th, 1828, and he was buried on September 24that Marple Church. “Few men,” says the Gentleman’s Magazine of November 1828, “who have of late quitted this transitory scene have led a life of greater industry and more active benevolence, or died more universally lamented than this individual … How he was loved and honoured is perhaps best told by the spontaneous feeling of all classes of society on that occasion. From an early hour the people began to assemble, and lined the way from his house to the Church, closing as the procession moved along. On its arrival at the gateway a line was formed by the children from the Military Asylum, each dressed in a scarlet spencer, and a black band around the arm … The funeral service was read by the Rev. Mr. Litler, The Reverend Gentleman himself was much affected and hundreds gave free vent to their feelings of real sorrow. … Probably the number assembled was not less than 3,000. As it was the general wish to see where the body was deposited, several hours elapsed before the vault was clear.””
(Unwin, 1924, pp. 234-235)
But we cannot, at this distance of time, know what proportion of the mill owners treated the children well, and what proportion treated them badly.
“The law was not passed for such mills as those of Messrs. Greg and Co., at Bollington, Messrs. Ashworths, at Turton, and Mr. Thomas Ashton, at Hyde; had all factories been conducted as theirs are, and as many other I could name are, there would probably have been no legislative interference at any time. But there are very many mill-owners whose standard of morality is low, whose feelings are very obtuse, whose governing principle is to make money, and who care not a straw for the children, so as they turn them well to money account. These men cannot be controlled by any other force but the strong arm of the law; …..”
(Nassau Senior, Letter from Mr. Horner to Mr. Senior, 23 May 1837, Letters on the Factory Act, B.Fellowes, London, 1837)
(Mr. Horner was the Chief Inspector of Factories)
But possibly the good mill owners were in the majority:
“When I entered a factory, I am bound to remark that I experienced much readiness on the part of the proprietors and of their overlookers in procuring for me ample means of making an impartial inquiry. If I am able to confide in my own observation, and in the accounts furnished to me by workpeople of every age in private conversations frequently repeated, I must arrive at the conclusion, that the proprietors are generally anxious to promote the convenience and comfort of their dependents as far as the system admits; that they usually endeavour to prevent acts of harshness and of immorality; that if such cases arise, it is mainly owing to their absence, or to their neglect of personal superintendence; and that there are not a few among them who really act a paternal part, and receive the recompense of respect and gratitude. Their situation is a difficult one; but the more closely they assume the character of the observant master of a great family, and the more narrowly they investigate, appreciate, and purify the composition of their family, the more likely is every factory to become respectable and happy.”
(Factories Inquiry Commission, Second Report, 1833, Medical Reports by Dr. Hawkins, General Report respecting the Counties of Lancashire, Cheshire, and Derbyshire, D.3., p. 5)
But apart from these more “magnificent” mill villages in the lowlands, there were a large number of small and medium-size mills in the valleys of the Pennines, which used the water power of the streams. We know very little about them, as they were not included in the recipients of the questionnaires of the Factories Inquiry Commission in 1834. The Commissioners sent out questionnaires to all the areas of Great Britain, but with respect to Lancashire sent the letters to practically only the Greater Manchester area:
Manchester, Salford, Chorlton-upon-Medlock
93
Blackburn
8
Bolton and Little Bolton
10
Wigan
11
Other Towns
19
Total Lancashire
141
Factories Inquiry Commission, Supplementary Report, 1834, Part II, Section D. 1., List of Manufacturers
But Mr. Baines, in his “History of the Cotton Manufacture” informs us that he privately received complete data from the Commissioners, which showed that the number of mills in Lancashire was 657:
Mills
Workers
Manchester
101
32,709
Bolton
56
11,301
Wigan
21
4,831
Blackburn
13
4,537
Preston
31
6,665
Rochdale
38
4,296
Rochdale, Todmorden
63
12,990
Oldham
89
18,352
Other Localities
276
46,208
Total
657
137,352
(Baines, 1835, extracted from the table on p. 386)
Reported
141
Not Reported
516
Total
657
Thus we have a majority of mills in Lancashire which are not reported, and which are probably outside Manchester and the large towns. It may be 200 to 300 units. A visual inspection of the Ordnance Survey maps of 1844-1847 for Lancashire gives 180 “cotton mills” and “cotton factories” outside the urban areas. Probably there were 100 to 200 workers for each mill. These workers did not have excellent wages, but they had the advantages of living in the countryside, without the horrible conditions of sanitation, bad housing, and smoke contamination of the cities. In many cases they lived in rows of cottages, with a privy attached, built by the factory owners.
In the sum of the large well-known rural mills and the smaller ones in the countryside, there were possibly 50,000 to 60,000 workers in these establishments. This additional number of textile workers is very important when we make a “moral evaluation” of the Industrial Revolution in the North of England. We cannot say “the majority of the workers had a bad life because they worked in the mills in insanitary towns, & etc.”, but rather we have to build an average, possibly 70/30, between the conditions in the urban factories and the conditions in the country mills.
The wages in Styal were not high per person, but the advantage was that the whole family was contracted (often the wife and children worked at spinning in the factory and the father worked at weaving, or as a carpenter or as a labourer on the associated farm), and thus the total income was more than sufficient:
Family Bailey (9 persons, 1831): man, two youths, four women, two children; odd hand, two saddlers, two spinners, carder, reeler, two winders; total income L 2 16 s. 4 p.
Family Venables (6 persons, 1831): man, two women, two youths, boy; mechanic, maker up, picker, two spinners, winder, carding room; total income L 1 15s. 11d.
Family Pepper (4 persons, 1831): two men, two women; mechanic, carder, spinner, reeler; total income L 1 19s. 1d.
It appears that the weekly amounts did not increase much from 1792 to 1851
(Collier, 1965, Appendix A, p. 54)
In Egerton (Mr. Ashton) in 1835, the earnings were:
Family Shepherd (6 persons plus 2 small children): one man, wife dead, four youths, one girl; total income L 2 1s. 6d.
Family Stevens (10 persons): man, wife non-earning, 3 youths, 1 girl, 4 small children; total income 28s. 6d.
(First Annual Report of the Poor Law Commissioners, 1835, pp. 316-330)
Limited working hours for apprentice children in textile mills to 12 hours a day excluding breaks, and prohibited night work for them. But the owners did not apply it to “free” children.
Cotton Mills and Factories Act 1819 (only applied to cotton industry)
No children under 9 to be employed in factories; children 9 to 16 to be employed not more than 12 hrs. per day, plus ½ hr. breakfast, 1 hr. lunch.
Mills and Factories Act 1833 (“Althorp’s Act”)
Children under 9 could not be employed in textile manufacture (only in silk mills), children under 18 could not work at night (8.30 pm – 5.30 am), children aged 9 to 13 could not work more than 8 hrs. per day plus 1 hr. lunch break, young persons 14 to 18 could not work more than 12 hrs. plus 1 hr. lunch.
Provided for routine official inspections; employers had to have an age certificate for the children. The children should have two hours schooling per day.
Labour in Factories Act 1844 (“Graham’s Factory Act”)
Children 9 to 13 could only work 6 ½ hrs. plus 1 hr. lunch, women and young people could only work 12 hrs. + 1 ½ hrs. meals, women could not work in the night. Children’s work to be only in the morning, or only in the afternoon; the other half of the day to be free for education and recreation (“half-timers”).
Ages and health of children to be certified by doctors.
Accidental deaths to be notified to a surgeon, and investigated.
The workers must take their meals together, and not in the workplace.
All moving parts of machinery to be securely fenced, children and women not to clean moving machinery.
Women and young people (under 18) could only work 10 hours each weekday and 8 hours on Saturdays. In general, this meant that the men would not work more than 10 hours, because they needed the auxiliary functions of the women and children
.
The grave problems that the children experienced in the cotton industry (and, in some cases, even worse in the flax, worsted, and silk industries) were the bad treatment and excessive hours of work, and the fact that they were being employed at early ages. These problems existed from 1780 to 1833. By 1833, when the minimum age for working in textile factorieswas set at 9 years old, less than 1 % of the workers were children under 9. This had been decreasing informally since the 1819 Act.
The idea of employing children, and often very small children, started from the factories that were established in the foothills of the Pennines, where there was a supply of fast-running water from the rivers, which was used to power the water mills. These were in parts of the country away from the towns, and thus it was difficult to find workers. One solution was to “import” a number of families to the place, and build a small “village”. The women and children worked in the spinning functions in the mill, and the men worked in their cottages in the village, weaving. The other solution was to “import” orphans, or other children in care of a local authority, from towns in Lancashire and adjoining counties, and from London. In this phase, probably 50 % of the workers were children under 15, and half of these were the orphans, generally called “apprentices” (Redford, 1926, pp. 23-27).The occupation of the children at this time was to be a “scavenger” (pick up the small pieces of cotton, that had fallen from the machine), or a “piecer” (join parts of thread in the machine, which had broken), or to generally assist the girl or woman with the spinning machine.
When the steam engine was applied to the spinning machines, it was not necessary to have the mills near the rivers, but they could now be in the towns. The men were not required, except for some of the heavier machines, the women in general were in charge of the machines, the small children continued as “scavengers” and “piecers”, and the children from 10 to 15 years old carried out the “support functions”, like changing the bobbins, inserting the cotton in the machines, and carrying the yarn from one machine to another.
The first reason for using a large proportion of children was that they were small and nimble, and could carry out the tasks of scavenger and piecer. Another, not unimportant, motive was that they cost less than one quarter of the wages of an adult man (although obviously they could not do the heavy work). The third reason had to do with the adult men: a great number of these did not want to work in a factory, and be subject to discipline and exact working hours; also, the mill owners did not want to have the men, because they would have a lot of trouble and insubordination from them.
In Manchester and the immediate neighbourhood, 24,000 persons were employed in cotton factories in 1819, of which five-twelfths were under 16 years of age.
“The employment of young children in any labour is wrong. The term of physical growth ought not to be a term of physical exertion. Light and varied motions should be the only effort,- motions excited by the will, not by the task-master,- the run and leap of a bouyant and unshackled spirit. How different the scene in a manufacturing district! No man of humanity can reflect without distress on the state of thousands of children, many from six to seven years of age, roused from their beds at an early hour, hurried to the mills, and kept there, with the interval of only 40 minutes, till a late hour at night; kept, moreover, in an atmosphere impure, not only as the air of a town, not only as defective in ventilation, but as loaded also with noxious dust. Health! cleanliness! mental improvement! How are they regarded? Recreation is out of the question. There is scarcely time for meals. The very period of sleep, so necessary for the young, is too often abridged. Nay, children are sometimes worked even in the night.”
(Thackrah, 1832, p. 80)
“In the Report of the Manchester Board of Health, published in 1805, the committee remark that, “They have still to lament the untimely and protracted labour of the children employed in some of the mills, which tends to diminish future expectations, as to the general sum of life and industry, by impairing the strength, and destroying the vital stamina of the rising generation; at the same time that, in too many instances, it gives encouragement to idleness, extravagance, and profligacy in the parents, who, perverting the order of nature, subsist by the oppression of their offspring.” This evil has since been remedied by a law, which applies, however, only to the cotton-mills.”
(Thackrah, 1832, p. 80, footnote)
The employment of children in such large numbers, was due to the need of the parents for income additional to their own wages, to the requirement of the local authorities that adults put their children to work before they could receive Poor Law payments (rather like the Means Test in the 1930’s), to the ease of the work which they did, i.e. it was not useful or possible for adult men to carry out these processes, and obviously of the interest of the mill owners in paying low wages to the children.
Many of the families who sent their children to the mills really were in need in the money. These were poor families with only the father working, and for low wages, and possibly not finding work every week.
In one large spinning establishment, at least 17 families were supported exclusively by the wages of the children. These children were aged from 9 to 15 years old, generally there were 3 in each family working, the total size of the family from 5 to 11 persons, and the total income per family was 12 to 20 shillings.
(Table in: Factories Inquiry Commission, Supplementary Report Part 1, 1833, p. 280)
Mr. Marshall, M. P., and owner of the largest flax mill in the country, told the Parliamentary Committee, how he came to increase the minimum age for contracting children for his mills:
“…. The circumstances which occasioned our employment of two sets in the day, of young hands between the age of nine and eleven, are these: our attention was drawn to the subject of legislating on the ages of children in factories in 1830. On the consideration that we then gave to the subject, we thought that nine years old was too young to admit children into the mill to work full time. In January, 1831, we ordered that no children under ten years old should be admitted into the mill; and on the 1st January 1832, we again raised the limit to eleven years old. During the year 1832, our head overlookers frequently mentioned to us that the parents were much dissatisfied with this restriction on the labour of their children; many of them, whose entire families were working with us then, and had been doing so for many years, complained, and stated that they would not keep them unemployed, but would take their young children (under eleven years old) to work elsewhere, though they should do so reluctantly. We at once acknowledged the correctness of their complaint, and saw that we were causing considerable inconvenience to them by our restrictions.” The solution was to give the employment to the children of nine and ten years old, for half a day (i.e. work in two relays), and the other half day would be spent in the company’s school.
(Quoted in: Wing, The Evils of the Factory System, 1837, p. 349)
There were often cases of a widow with a very low own income, and who desperately needed the children to go out to work:
“…. Then there was another matter which ought to be considered. There were many cases where widows were left with large families, and he did not see how it would be possible for them to get along if their children were not allowed to work until they were 11 years of age, while, on the other hand, if they were allowed to begin at 8 or 9, and to work half a day and go to school the other half, they would be contributing towards their support, and be protected from the evils they were at present subject to.”
(Children’s Employment Commission, First Report, 1862, The Pottery Manufacture, Mr. F. Bishop, manufacturer, p. xliv)
(The tension between poverty and hunger in the family on the one hand, and the rights of the child to not work at too young an age on the other hand, still exist in some very poor countries, such as Bolivia: see nbcnews, “Bolivia wrestles with protecting child workers as young as 10, Jan. 26, 2018”.)
Following is an interesting conversation with the man responsible for Poor Law payments in Manchester:
“Did you ever know the Cotton Industry in a more flourishing state than it is now?” “No, I cannot say that I did.”
“As Overseer of the place you require the children to work, do you not?” “Certainly we do.”
“And you consider that the more wages that they can obtain for their work the better?” “Of course it must reduce the Town’s pay.”
“You do not take into your calculation the injury their health would receive?” “I cannot say that was ever a matter of calculation; they were always required to find full employment for their children as early as possible, to relieve the payment of the town.”
“And to relieve the Town as much as they could, by working the children as much as they could?” “Certainly.”
“You have said that children are employed in the Factories, which children were not fit for more laborious employments?” “Certainly.”
“Do you not mean by the term laborious employments, such employments as require strength?” “Certainly.”
…….
“The children look pale, do not they?” “They do in general.”
…….
“Supposing a family having children of an age such as to have been accustomed to be sent to the Cotton Factories were to decline sending their children, should you not stop their pay?” “I believe we should.”
“You have told me before, that so far as you can, you are anxious that the children should be employed?” “Certainly.”
(Observations as to the ages of persons employed, …. 1819, evidence of William Welsby, assistant Overseer of the township of Manchester, pp. 70-72)
There is an idea often presented in books on the period, to the tone that “yes, it is true that the children in the first years of the Industrial Revolution were worked very hard, and for very long hours, were badly fed, and were physically punished. But this happened in nearly the same magnitude in the previous generation, with their families, working on the farm or helping with the work on the loom. But these facts were not publicised.” The comparison is not valid. The children on the farm did not work 12 hours a day, they did not work all this time without a minute’s rest, they were not forced to get up at five o’clock in the morning to walk to their place of work, and they were given sufficient food. We have a description of the suffering of some children, presented by factory workers in Warrington in 1819.
“The principal Cotton Mills in this Town & neighbourhood work from half past five in the morning till half past Eight at night so that the poor Children are called out of Bed at 5 in the Morning and it is nine at night when they get Home Some of them being under Six many under Eight years of age We feel exquisitely for these in Winter time Coming out of the warm Bed Cloathed in Rags or half naked through the Cold frost & snow winds & Rain many of them barefoot into the Hot Room were no Air is permitted to enter that can be prevented as it is Injurious in the Manufacturing especially in the Spinning of Cotton We could mention Several Instances of both Males & females now in our Employ above 16 years of age who are not four foot high and whose pallid looks and emaciated frame would almost affect the callous Heart of the arrogant Mr. Philips ….”
(quoted in Paterson, 1995, pp. 152-153)
(The transcription is exact)
The men who wrote this epistle would have been children in 1790 to 1800, and would have had a normal upbringing with their parents. If this had not been the case, they would not have been so hurt by what they were seeing.
We have three evidences which were given many years later, by people who had seen scenes of this sort; since they were published after all the political and social movements had subsided, we may assume that they were written without any political interest.
“Since the passing of the Factory Act [1833] the change in the condition of factory operatives is wonderful. Previously, cripples among them were very common, and the mortality great, arising from the excessive hours of labour. What also now contributes to their health is the necessity for the factory children appearing at School cleanly.”
(James, 1857, p. 549 footnote)
“In some large factories, from one-fourth to one-fifth of the children were either crippled or otherwise deformed, or permanently injured by excessive toil, sometimes by brutal abuse. The younger children seldom held out more than three or four years without serious illness, often ending in death.”
(Robert Dale Owen, son of Robert Owen, Threading my Way, Carlton, New York, 1874, p. 126; referring to visits to mills about 1815)
“The other is the old, the often-repeated, and as often-refuted, argument that the work is light. Light! Why, no doubt, much of it is light, if measured by the endurance of some three or four minutes. But what say you, my Lords, to a continuity of toil, in a standing posture, in a poisonous atmosphere, during 13 hours, with 15 minutes of rest? Why, the stoutest man in England, were he made, in such a condition of things, to do nothing during the whole of that time but be erect on his feet and stick pins in a pincushion, would sink under the burden. What say you, then, of children – children of the tenderest years? Why, they become stunted, crippled, deformed, useless. I speak what I know – I state what I have seen. When I visited Bradford, in Yorkshire, in 1838, being desirous to see the condition of the children – for I knew that they were employed at very early ages in the worsted business …. I asked for a collection of cripples and deformities. In a short time more than 80 were gathered in a large courtyard. They were mere samples of the entire mass. I assert without exaggeration that no power of language could describe the varieties, and I may say, the cruelties, in all these degradations of the human form. They stood or squatted before me in all the shapes of the letters of the alphabet. This was the effect of prolonged toil on the tender frames of children at early ages. When I visited Bradford, under the limitation of hours some years afterwards, I called for a similar exhibition of cripples; but, God be praised! there was not one to be found in that vast city. Yet the work of these poor sufferers had been light, if measured by minutes, but terrific when measured by hours.”
(Earl of Shaftesbury, Hansard’s Parliamentary Debates. 3rd Series, CCXLV (4 April 1879), Earl of Shaftesbury, pp. 355-56)
The paragraphs above which list all the bad experiences, are generalizations. The worst factories were the small ones, and some that were outside the towns. All the points mentioned were demonstrated to the Parliamentary Commissioners and in the House of Commons. There were however a certain number of owners of mills, who did not allow beatings or gross language, worked hours not above 12 for the children, gave nutritive meals, and even paid for visits to the doctor. There is no academic investigation, as to how many factory owners were “good”, and how many were “bad”; neither for Lancashire, nor for Yorkshire.
But there is a report from a local magistrate to the House of Lords Committee, referring to 29 cotton mills in the region of Bolton, visited in 1819. This shows us that out of 29 mills, in 12 cases the children were dirty, clothed in rags, puny and sickly, and “no human beings can be more wretched”. But in 17 cases, the children were healthy, well clothed, happy, clean, with instruction, and in some mills they attended divine service on Sundays.
The strange point here is that it was possible that the children would work 12 to 15 hours a day, and they could still be happy, clean, healthy, and well clothed.
(House of Lords, Reasons in Favour of Sir Robert Peel’s Bill, 1819, pp. 42-43)
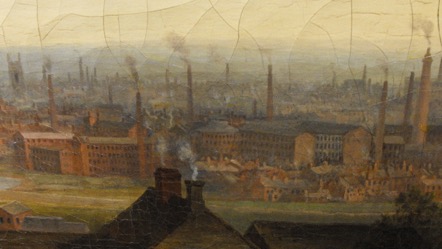
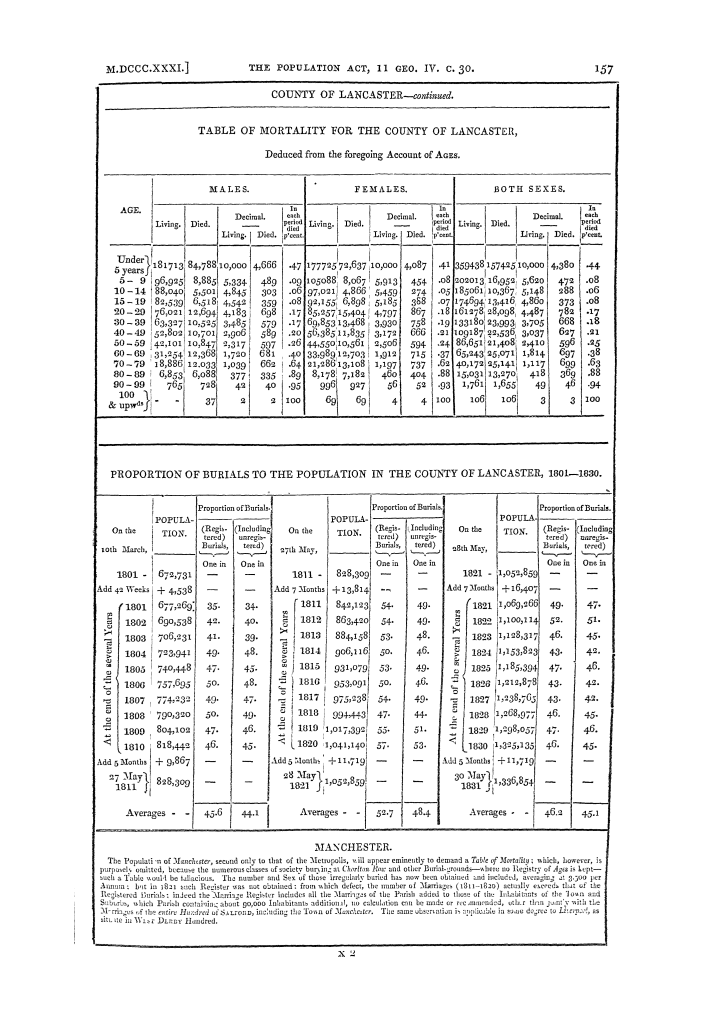

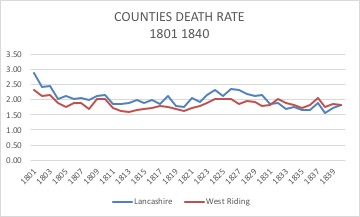


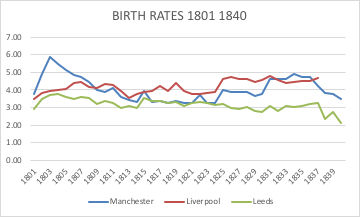

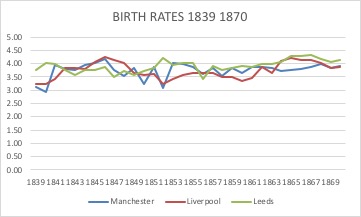
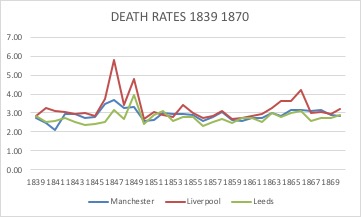


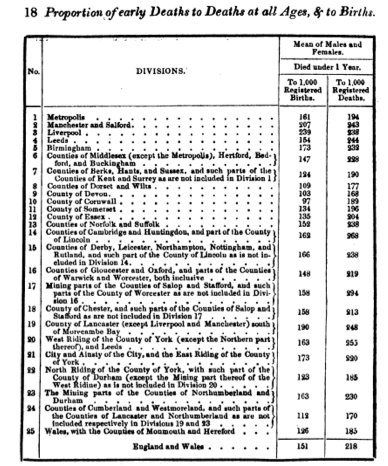
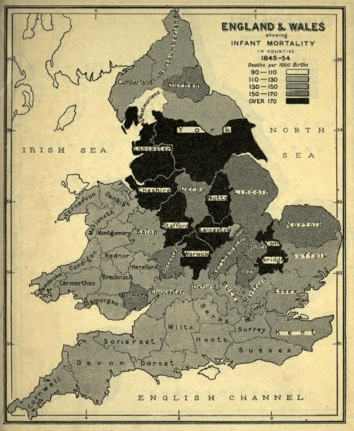

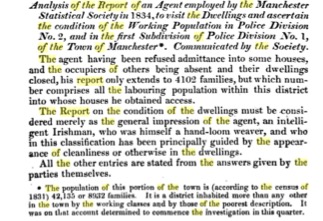
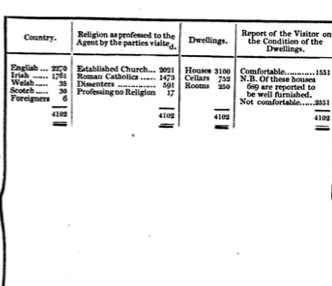

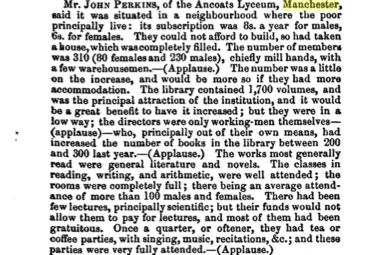

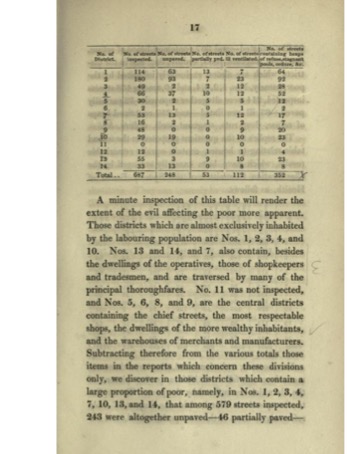
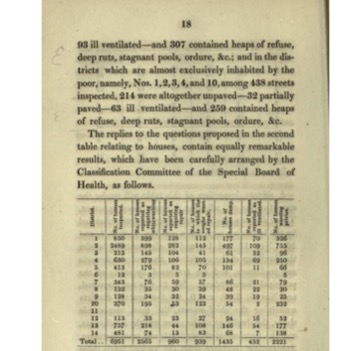
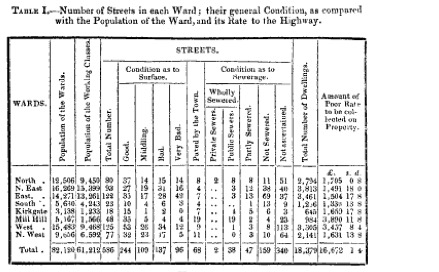
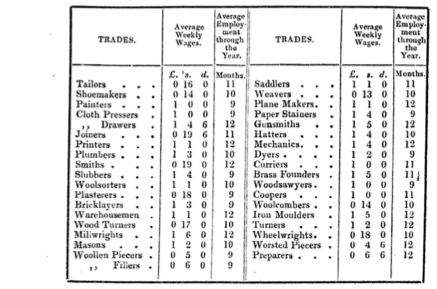


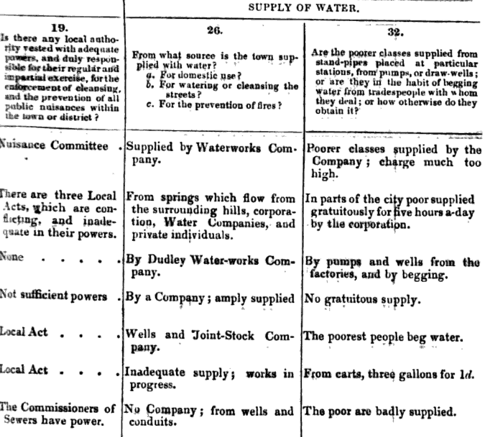


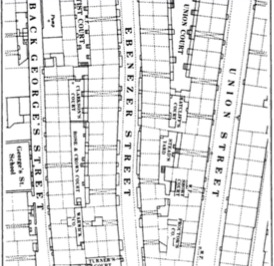


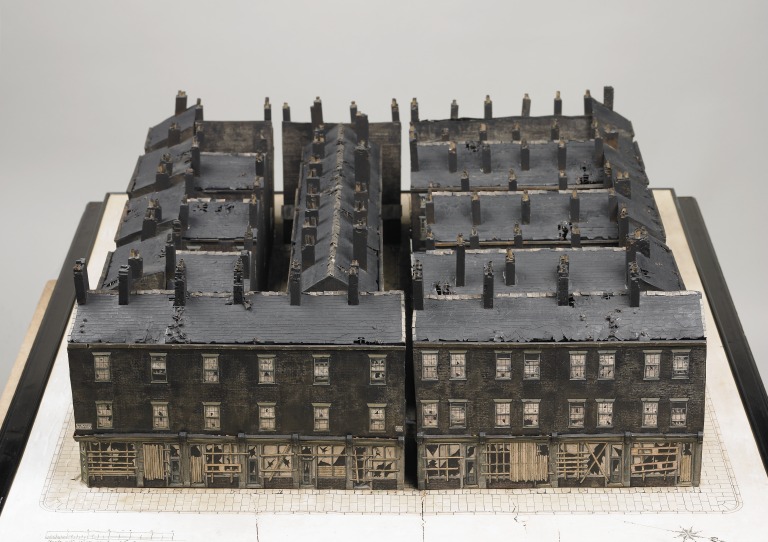
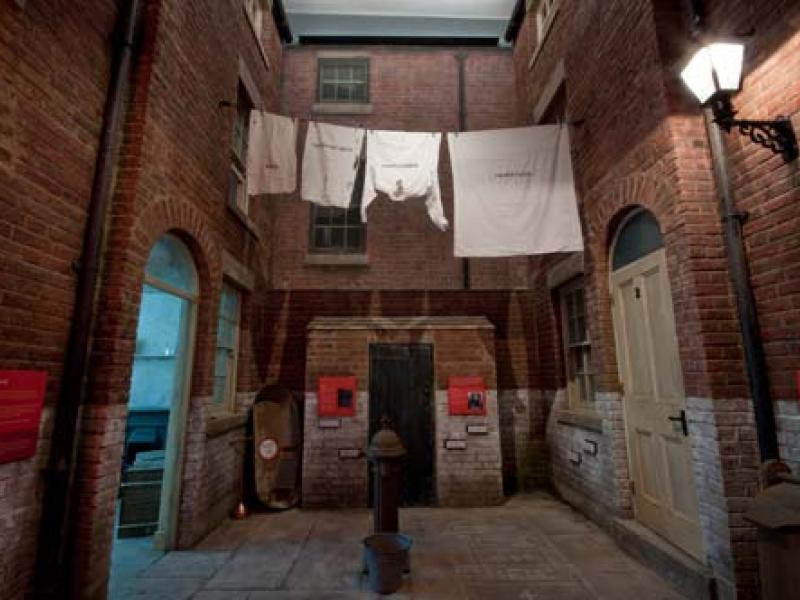
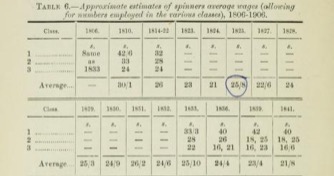


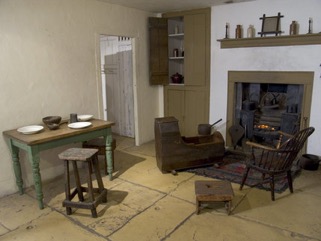
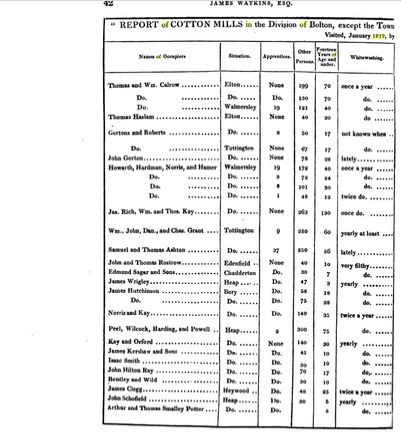

