In order to investigate if there was an increase in mortality – and thus a decrease in life expectancy – due to the Industrial Revolution, we have to collect population, birth and death data for the years up to e.g. 1830, and compare these with those of 1830 to 1860. The Census data were collected for 1801, 1811, …, and are reliable. As to the births and deaths, for the years 1801 to 1841 we have “Parish-Register” numbers with a detail level per Township or per Hundred; starting from 1837 we have the numbers collected by the new procedures of the Registrar-General with a detail per Registration District.
The challenge is to “knit together” the births/deaths from up to 1841 with those starting in 1837, as they may well have been collected with different premises.
The totals per every ten years for England and Wales are the following:
| Year | Population England and Wales | Baptisms/ Births | Burials/ Deaths | Birth Rate % | Death Rate % | Population Per Burial | |||
| 1760 | 6,736,000 | 187,000 | 156,000 | 2.77 | 2.32 | 43.1 | |||
| 1770 | 7,428,000 | 207,000 | 174,000 | 2.78 | 2.34 | 42.6 | |||
| 1780 | 7,953,000 | 222,000 | 192,000 | 2.79 | 2.41 | 41.4 | |||
| 1790 | 8,675,000 | 249,000 | 179,000 | 2.87 | 2.06 | 48.5 | |||
| 1801 | 8,873,000 | 237,000 | 204,000 | 2.67 | 2.30 | 43.5 | |||
| 1811 | 10,150,000 | 304,000 | 189,000 | 3.00 | 1.86 | 53.7 | |||
| 1821 | 11,979,000 | 355,000 | 212,000 | 2.96 | 1.77 | 56.5 | |||
| 1831 | 13,897,000 | 382,000 | 254,000 | 2.75 | 1.83 | 54.7 | |||
| 1841 | 15,856,000 | 520,000 | 343,000 | 3.28 | 2.16 | 46.2 | |||
| 1851 | 17,982,000 | 615,000 | 395,000 | 3.42 | 2.20 | 45.5 | |||
| 1861 | 20,061,000 | 696,000 | 435,000 | 3.47 | 2.17 | 46.1 | |||
| 1871 | 22,712,000 | 797,000 | 515,000 | 3.51 | 2.27 | 44.1 |
The figures for 1760 to 1790 are “best estimates” in 1760-1800, Marshall, 1832, p. 61 (Baptisms and Burials). The figures of Population are taken from the Census of each prescribed year, and the Births and Deaths from Parish Register Returns and from Annual Reports of the Registrar-General.
The improvement in the “value of life” (population divided by burials) from 1760/1801 to 1811/1831 was known and accepted at the time. “Showing in this respect a continually diminishing mortality. This effect, so strongly indicative of amendment in the condition of the people, must be attributed to the concurrence of various causes. Among these may be mentioned, the less crowded state of our dwellings; the command of better kinds of food and medical assistance; the superiority and cheapness of clothing; and probably also, more temperate habits and greater personal cleanliness. One influential cause of the diminished mortality will be found in the introduction of vaccination, which has had so powerful an effect in diminishing the rate of mortality among children; besides which, the extensive surface drainage which has been going forward in those parts of the country which, owing to the presence of stagnant waters, were once productive of intermittent fever, has added to the general healthiness of the country.”
(George Porter, Head of the Statistical Department at the Board of Trade, Progress of the Nation, 1836, Vol. 1. Section 1, Population, p. 19)
We see that there is a large “jump” from 1831 to 1841; actually this took place from 1836 to 1838. The “jump” is not real. One problem was that the children who died before baptism were not registered in the local church as “born” and also not as “died”. The second situation was that before 1837 the “Non-Parochial Registers” (births and deaths), which were in general of non-conformist persons, were not all included in the Anglican Parish reports (the majority were included), and thus the number reported was too low. In 1837 the Marriage and Registration Act was passed to regulate all the information about marriages, births and deaths under the supervision of a Registrar-General. The third exception was that of military or civil persons who died abroad or at sea. From 1837, the only missing data of marriages, births and deaths were those of individual persons who decided not to inform the authorities.
Mr. Rickman (of the Census) and Dr. Farr (of the Public Records Office) were conscious of the problem of under-registration before 1837. There is a calculation made in 1835 by a Mr. Edmonds, statistician, using data from the Population Returns of 1831, in which he estimates a missing amount of 40 % in births and 20 % in deaths (Edmonds, T. R.; On the Mortality of the People of England; The Lancet, Volume 24, Issue 614, June 06, 1835, pp. 310-316; https://doi.org/10.1016/S0140-6736(02)97790-1). Mr. Finlaison, the Actuary in the National Debt Office, calculated in 1839 that, based on the real numbers in the two systems, that the Parish-Register numbers for births and deaths should be increased by 18 % (Porter, 1846, p. 29).
If we increase the official figures for births and deaths before 1837 by 18 %, we have the following corrected figures:
| Year | Population England and Wales | Baptisms/ Births | Burials/ Deaths | Birth Rate % | Death Rate % | Population Per Burial | |||
| 1760 | 6,736,000 | 221,000 | 184,000 | 3.28 | 2.73 | 36.6 | |||
| 1770 | 7,428,000 | 244,000 | 205,000 | 3.28 | 2.76 | 36.2 | |||
| 1780 | 7,953,000 | 262,000 | 227,000 | 3.29 | 2.85 | 35.0 | |||
| 1790 | 8,675,000 | 294,000 | 211,000 | 3.39 | 2.43 | 41.1 | |||
| 1801 | 8,873,000 | 322,000 | 216,000 | 3.62 | 2.43 | 41.1 | |||
| 1811 | 10,150,000 | 359,000 | 223,000 | 3.54 | 2.20 | 45.5 | |||
| 1821 | 11,979,000 | 419,000 | 250,000 | 3.50 | 2.09 | 47.9 | |||
| 1831 | 13,897,000 | 451,000 | 300,000 | 3.24 | 2.16 | 46.3 | |||
| 1841 | 15,856,000 | 520,000 | 343,000 | 3.28 | 2.16 | 46.2 | |||
| 1851 | 17,982,000 | 615,000 | 395,000 | 3.42 | 2.20 | 45.5 | |||
| 1861 | 20,061,000 | 696,000 | 435,000 | 3.47 | 2.17 | 46.1 | |||
| 1871 | 22,712,000 | 797,000 | 515,000 | 3.51 | 2.27 | 44.1 |
With these assumptions (for example), there is practically no movement from 1831 to 1841.
Thus, as a general statement, the Industrial Revolution in its wider sense did not increase the per cent death rate in England and Wales from 1801 to 1861.
Death Rates in Industrial Towns 1800-1820 and 1820-1840
There is a hypothesis, that after an improvement in the death rate of the northern industrial towns in 1800-1820 against previous decades, these towns suffered a mortality crisis in 1820-1840.
Luckily, we have some tables from the 1830 Census and Parish Returns, which answer this doubt with considerable accuracy. The data show us the value of life, that is number of the population divided by the burials (i.e. the reciprocal of our “death rate”) for each year from 1801 to 1830, for the total of the county of Lancashire and for the total of the county of the West Riding, and which thus include all of the industrializing towns:
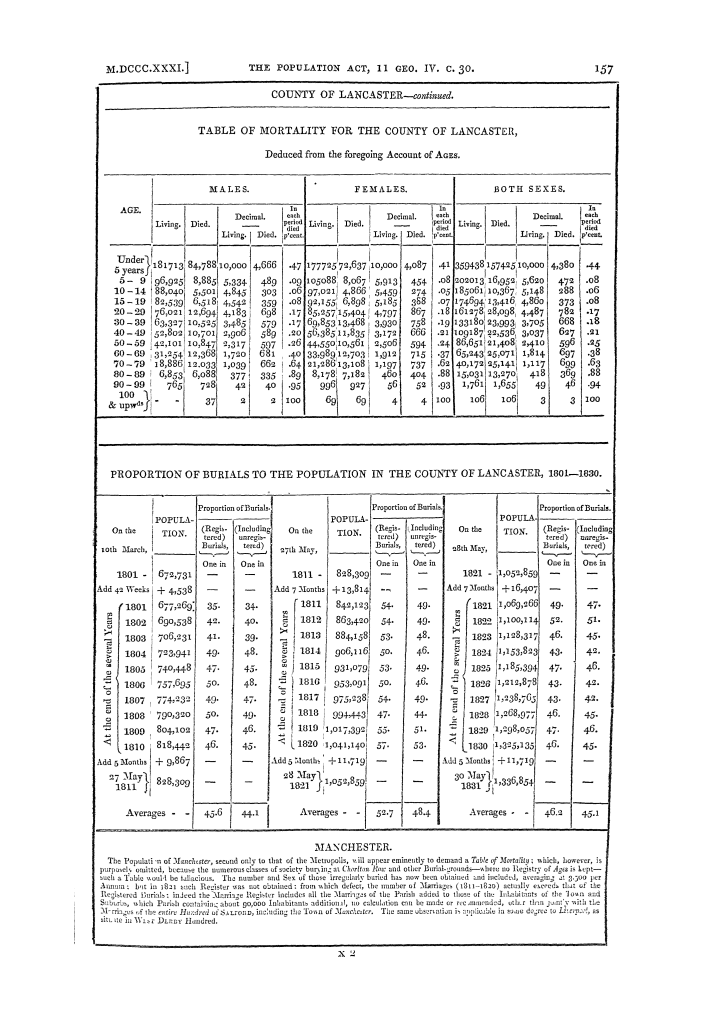

(Census 1831, Answers and Returns, Parish Register Abstract, p. 157 and p. 408)
It was also possible to find the data of burials for each year from 1831 to 1840 from the Census and Abstract of 1841.
The burials are under-registered by about 18 %, and show an average of the industralised regions and the rural regions. Although they are not correct in absolute terms, they are consistent in the definitions.
Now we convert the numbers to “death rates” as a percentage, and express them as a graph:
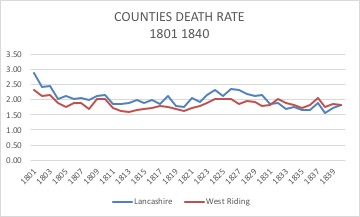
By way of interpretation, a movement of from e.g. 1.50 % to 1.60 % would correspond to an increase in yearly deaths in Lancashire from 15,600 to 16,600. It is highly probable that the increase in Lancashire in the period 1822 to 1830 – but not in the West Riding – shows deaths among the domestic hand-loom weavers (the worst-hit were in the rural North of Lancashire).
We also have evidence of the yearly burials in the decade of the 1830’s in: Preston, Rochdale, Bury, Bolton, Wigan, Prescott, Warrington, Sheffield, Wakefield, Huddersfield, Halifax, Bradford. In no case was the increase from 1831 to 1840 more than 25 %; all the towns were growing. The death rate of e.g. Wigan was 2.48 % in 1831 and 2.67 % in 1840. (We do not have figures from earlier decades, as the reports were made out for larger geographical regions).

(HISTPOP.ORG – Browse > Parish register abstract, England and Wales, 1841, Page 109)

(HISTPOP.ORG – Browse > Parish register abstract, England and Wales, 1841, Page 114)
The editors of the report on “Great Towns” made an approximate calculation of the “cost” of urbanization. They compared the real number of deaths in the large industrial towns with a theoretical number on the basis of an “ideal” death rate of 2.0 % (the normal rate for agricultural counties). The “penalty” was 60,000 excess deaths in the whole country in the 3 years 1841-1843 (p. xlviii, see last number, below, right).
For large towns in the period 1801 to 1841, your author has been able to find yearly data of births and deaths in the “Abstracts of Parish Registers” for 1811, 1821, 1831, and 1841. The following population numbers are from the Census of 1801, 1811, 1821, 1831, and 1841, with interpolations per year by this author. The editors of the data inform that they have collected a large number of documents of “Dissenters”.
Manchester, Township
| Persons | Births | Burials | Birth Rate % | Burial Rate % | |
| 1801 | 70,000 | 2,655 | 2,528 Insuff. Harvest | 3.79 | 3.61 |
| 1802 | 70,900 | 3,484 | 2,146 Insuff. Harvest | 4.91 | 3.40 |
| 1803 | 71,800 | 4,210 | 1,914 | 5.86 | 2.66 |
| 1804 | 72,700 | 3,996 | 1,451 | 5.49 | 2.00 |
| 1805 | 73,600 | 3,763 | 1,697 | 5.11 | 2.30 |
| 1806 | 74,500 | 3,605 | 1,591 | 4.83 | 2.13 |
| 1807 | 75,400 | 3,566 | 1,503 | 4.73 | 1.99 |
| 1808 | 76,300 | 3,376 | 1,245 | 4.42 | 1.63 |
| 1809 | 77,200 | 3,096 | 1,473 | 4.01 | 1.91 |
| 1810 | 78,100 | 3,015 | 1,320 | 3.86 | 1.69 |
| 1811 | 79,000 | 3,238 | 1,183 | 4.10 | 1.50 |
| 1812 | 81,500 | 2,925 | 1,493 | 3.59 | 1.83 |
| 1813 | 84,000 | 2,901 | 1,569 | 3.45 | 1.87 |
| 1814 | 86,500 | 2,887 | 1,539 | 3.33 | 1.78 |
| 1815 | 88,000 | 3,442 | 1,431 | 3.91 | 1.63 |
| 1816 | 91,000 | 3,020 | 1,690 | 3.32 | 1.86 |
| 1817 | 94,000 | 3,155 | 1,815 | 3.36 | 1.93 |
| 1818 | 97,500 | 3,181 | 2,450 | 3.26 | 2.51 |
| 1819 | 101,000 | 3,376 | 1,878 | 3.34 | 1.85 |
| 1820 | 104,500 | 3,405 | 1,815 | 3.25 | 1.74 |
| 1821 | 108,000 | 3,453 | 3,327 | 3.26 | 3.08 |
| 1822 | 111,000 | 4,136 | 3,378 | 3.72 | 3.04 |
| 1823 | 114,000 | 3,736 | 4,809 | 3.27 | 4.22 |
| 1824 | 117,000 | 3,835 | 4,713 | 3.27 | 4.03 |
| 1825 | 120,000 | 4,788 | 4,969 | 3.99 | 4.14 |
| 1826 | 123,000 | 4,791 | 5,515 | 3.89 | 4.48 |
| 1827 | 126,000 | 4,901 | 4,888 | 3.89 | 3.88 |
| 1828 | 130,000 | 5,056 | 5,780 | 3.89 | 4.44 |
| 1829 | 134,000 | 4,931 | 5,231 | 3.67 | 3.90 |
| 1830 | 138,000 | 5,209 | 6,016 | 3.77 | 4.35 |
| 1831 | 142,000 | 6,573 | N/A | 4.63 | |
| 1832 | 146,000 | 6,748 | N/A | 4.62 | |
| 1833 | 150,000 | 6,958 | N/A | 4.64 | |
| 1834 | 154,000 | 7,583 | N/A | 4.92 | |
| 1835 | 159,000 | 7,505 | N/A | 4.72 | |
| 1836 | 164,000 | 7,757 | N/A | 4.73 | |
| 1837 | 169,000 | N/A | N/A | ||
| 1838 | 175,000 | 6,668 | N/A | 3.81 | |
| 1839 | 181,000 | 6,779 | N/A | 3.74 | |
| 1840 | 186,000 | 6,443 | N/A | 3.46 | |
| 1841 | 192,000 |
The figures of burials for 1831 to 1840 given in the Parish Register data are clearly too low; the persons were buried in “overflow” cemeteries, and not correctly registered in the parish church (Collegiate Church). This had happened in the 1810’s, and was later corrected; although apparently not in the figures shown above. (Census 1831, Parish Register Abstract, County of Lancaster, Proportion of Burials to the Population 1801-1830, p. 157)
Liverpool, parish only
| Year | Persons | Births | Burials | Birth Rate % | Death Rate % | |
| 1801 | 75,000 | 2,625 | 3,464 Insuff. Harvest | 3.50 | 4.62 | |
| 1802 | 78,000 | 2,975 | 2,287 Insuff. Harvest | 3.81 | 2.93 | |
| 1803 | 79,500 | 3,114 | 2,209 | 3.92 | 2.78 | |
| 1804 | 81,000 | 3,246 | 2,178 | 4.01 | 2.69 | |
| 1805 | 82,500 | 3,342 | 2,580 | 4.05 | 3.13 | |
| 1806 | 84,000 | 3,692 | 2,173 | 4.39 | 2.59 | |
| 1807 | 85,000 | 3,788 | 2,509 | 4.46 | 2.95 | |
| 1808 | 86,500 | 3,591 | 2,447 | 4.15 | 2.82 | |
| 1809 | 88,000 | 3,609 | 2,452 | 4.10 | 2.79 | |
| 1810 | 90,000 | 3,894 | 3,132 | 4.33 | 3.48 | |
| 1811 | 92,000 | 3,965 | 2,822 | 4.30 | 3.07 | |
| 1812 | 94,000 | 3,719 | 2,340 | 3.96 | 2.49 | |
| 1813 | 96,000 | 3,380 | 2,352 | 3.52 | 2.45 | |
| 1814 | 98,000 | 3,690 | 2,465 | 3.76 | 2.52 | |
| 1815 | 100,000 | 3,891 | 3,030 | 3.89 | 3.05 | |
| 1816 | 103,000 | 4,083 | 2,812 | 3.96 | 2.73 | |
| 1817 | 106,000 | 4,499 | 2,489 | 4.24 | 2.35 | |
| 1818 | 109,000 | 4,290 | 3,416 | 3.94 | 3.13 | |
| 1819 | 112,000 | 4,932 | 3,011 | 4.40 | 2.69 | |
| 1820 | 115,000 | 4,540 | 2,944 | 3.95 | 2.56 | |
| 1821 | 119,000 | 4,490 | 3,267 | 3.77 | 2.74 | |
| 1822 | 123,000 | 4,614 | 3,187 | 3.75 | 2.59 | |
| 1823 | 127,000 | 4,851 | 3,358 | 3.82 | 2.64 | |
| 1824 | 131,000 | 5,112 | 3,933 | 3.90 | 3.00 | |
| 1825 | 135,000 | 6,226 | 3,745 | 4.61 | 2.77 | |
| 1826 | 139,000 | 6,589 | 4,555 | 4.74 | 3.28 | |
| 1827 | 144,000 | 6,612 | 4,202 | 4.59 | 2.92 | |
| 1828 | 149,000 | 6,878 | 3,787 | 4.62 | 2.54 | |
| 1829 | 154,000 | 6,838 | 3,728 | 4.44 | 2.42 | |
| 1830 | 160,000 | 7,280 | 3,620 | 4.55 | 2.26 | |
| 1831 | 165,000 | 7,867 | 5,044 | 4.77 | 3.06 | |
| 1832 | 171,000 | 7,767 | 5,866 Cholera | 4.54 | 3.43 | |
| 1833 | 177,000 | 7,756 | 5,225 | 4.38 | 2.95 | |
| 1834 | 183,000 | 8,145 | 5,881 | 4.45 | 3.21 | |
| 1835 | 189,000 | 8,556 | 4,740 | 4.52 | 2.50 | |
| 1836 | 195,000 | 8,759 | 5,296 | 4.49 | 2.72 | |
| 1837 | 201,000 | 9,388 | 6,875 | 4.67 | 3.42 | |
| 1841 | 224,000 |
(The data for 1832 to 1837 are taken from the Bills of Mortality in “The Stranger in Liverpool», which are very close to the Parish-Registers for the years before 1832)
Leeds, town and out-townships
| Persons | Births | Burials | Birth Rate % | Death Rate % | |
| 1801 | 53,200 | 1,544 | 1,622 Insuff. Harvest | 2.90 | 3.04 |
| 1802 | 54,100 | 1,886 | 1,393 | 3.48 | 2.57 |
| 1803 | 55,000 | 2,046 | 1,759 | 3.72 | 3.20 |
| 1804 | 55,900 | 2,094 | 1,186 | 3.74 | 2.12 |
| 1805 | 56,800 | 2,041 | 1,348 | 3.59 | 2.37 |
| 1806 | 57,700 | 1,996 | 1,745 | 3.46 | 3.02 |
| 1807 | 58,600 | 2,121 | 1,274 | 3.62 | 2.17 |
| 1808 | 59,700 | 2,124 | 1,225 | 3.55 | 2.05 |
| 1809 | 60,700 | 1,954 | 1,249 | 3.21 | 2.06 |
| 1810 | 61,700 | 2,077 | 1,571 | 3.36 | 2.54 |
| 1811 | 62,700 | 2,051 | 1,217 | 3.27 | 1.94 |
| 1812 | 64,200 | 1,918 | 1,331 | 2.99 | 2.07 |
| 1813 | 65,700 | 2,033 | 1,375 | 3.09 | 2.09 |
| 1814 | 67,200 | 2,001 | 1,442 | 2.98 | 2.14 |
| 1815 | 69,400 | 2,454 | 1,481 | 3.53 | 2.13 |
| 1816 | 71,400 | 2,386 | 1,360 | 3.34 | 1.90 |
| 1817 | 73,400 | 2,467 | 1,757 | 3.36 | 2.39 |
| 1818 | 75,400 | 2,462 | 2,012 | 3.26 | 2.66 |
| 1819 | 77,400 | 2,582 | 1,653 | 3.33 | 2.13 |
| 1820 | 80,400 | 2,491 | 1,546 | 3.10 | 1.92 |
| 1821 | 83,900 | 2,741 | 1,741 | 3.26 | 2.08 |
| 1822 | 87,900 | 2,905 | 1,933 | 3.30 | 2.20 |
| 1823 | 92,000 | 3,021 | 2,326 | 3.28 | 2.53 |
| 1824 | 96,000 | 3,001 | 2,081 | 3.12 | 2.17 |
| 1825 | 100,000 | 3,178 | 2,471 | 3.18 | 2.47 |
| 1826 | 104,000 | 3,101 | 2,897 | 2.98 | 2.78 |
| 1827 | 108,000 | 3,182 | 1,949 | 2.94 | 1.80 |
| 1828 | 111,500 | 3,397 | 2,946 | 3.05 | 2.64 |
| 1829 | 115,500 | 3,225 | 2,425 | 2.79 | 2.10 |
| 1830 | 119,500 | 3,266 | 2,530 | 2.73 | 2.11 |
| 1831 | 123,500 | 3,776 | 3,494 | 3.06 | 2.83 |
| 1832 | 127,500 | 3,591 | 3,701 | 2.82 | 2.90 |
| 1833 | 131,500 | 4,022 | 3,284 | 3.06 | 2.50 |
| 1834 | 135,000 | 4,059 | 3,387 | 3.00 | 2.51 |
| 1835 | 139,500 | 4,308 | 3,054 | 3.09 | 2.19 |
| 1836 | 143,500 | 4,593 | 3,375 | 3.20 | 2.35 |
| 1837 | 148,000 | 4,855 | 3,912 | 3.28 | 2.64 |
| 1838 | 153,000 | 3,569 | 3,387 | 2.33 | 2.21 |
| 1839 | 158,000 | 3,593 | 3,327 | 2.27 | 2.10 |
| 1840 | 163,000 | 3,420 | 3,404 | 2.09 | 2.09 |
| 1841 | 168,000 |
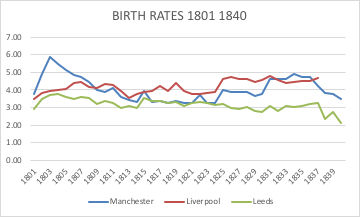

Although the birth and death rates may be too low in absolute terms, as explained at the beginning of this chapter, in relative terms there is no sign of an abnormal increase in deaths in the period. We cannot find a possible negative effect from industrialization or from worsening of sanitation/housing. The numbers at the end of the period are around 3.5 % p.a. for births and 2.5 % p.a. for deaths.
We now give the numbers of births and deaths collected with the new system of the Registrar-General, starting in July 1837.
These numbers below refer to the whole conurbation in each case. Particularly in the case of Manchester, we know that the better class of workers from 1825 moved to new housing areas in Hulme and Chorlton. It would not be correct to use only Manchester Township, and thus have birth/death data from only the poorer workers.
We need to show that the 1837 data are consistent in their values from those of 1831, and we do have reasonable evidence:
- We see that the absolute numbers from the years up to 1831 are 3.5 % p.a. for births and 2.5 % p.a. for deaths; the numbers for the first years from 1837 are 3.5 % to 4.0 % for births and 2.5 % to 3.0 % for deaths.
- For Liverpool, we do have a direct connection in the year 1837: the parish registers give around 4.5 % and 3.0 %, and the Registrar-General gives around 3.5 % and 3.0 %.
- Mr. George Porter compares the yearly statistics of deaths from 1801 to 1831 from the Parish Registrars, with an annual average for 1831 to 1841 calculated by the Census Commissioners, and finds them to be practically equal; that is, the real facts did not change from year to year (Porter, 1847, Population, p. 29).
Manchester, Salford, Chorlton
| Persons | Births | Burials | Birth Rate % | Death Rate % | |
| 1838- 1839 (+) | 340,000 | 10,700 | 9,276 | 3.14 | 2.73 |
| 1839- 1840 (+) | 348,000 | 10,192 | 8,667 | 2.93 | 2.49 |
| 1841 | 356,000 | 14,051 | 10,378 | 3.94 | 2.91 |
| 1842 | 365,000 | 13,857 | 10,748 | 3.80 | 2.94 |
| 1843 | 374,000 | 14,109 | 11,057 | 3.77 | 2.96 |
| 1844 | 383,000 | 15,194 | 10,470 | 3.96 | 2.73 |
| 1845 | 393,000 | 15,802 | 10,898 | 4.02 | 2.77 |
| 1846 | 403,000 | 16,758 | 14,095 Typhus | 4.16 | 3.50 |
| 1847 | 413,000 | 15,482 | 15,114 Typhus | 3.75 | 3.66 |
| 1848 | 423,000 | 14,949 | 13,841 | 3.53 | 3.27 |
| 1849 | 433,000 | 16,686 | 14,426 | 3.85 | 3.33 |
| 1850 | 443,000 | 14,403 | 11,383 | 3.25 | 2.56 |
| 1851 | 453,000 | 17,570 | 11,855 | 3.88 | 2.62 |
| 1852 | 459,000 | 14,268 | 13,828 | 3.10 | 3.01 |
| 1853 | 465,000 | 18,644 | 13,821 | 4.01 | 2.97 |
| 1854 | 471,000 | 18,862 | 13,953 | 4.00 | 2.96 |
| 1855 | 477,000 | 18,508 | 13,803 | 3.88 | 2.89 |
| 1856 | 482,000 | 17,357 | 12,356 | 3.60 | 2.56 |
| 1857 | 487,000 | 18,697 | 13,643 | 3.83 | 2.80 |
| 1858 | 492,000 | 17,398 | 14,947 | 3.53 | 3.04 |
| 1859 | 497,000 | 19,093 | 13,136 | 3.84 | 2.64 |
| 1860 | 504,000 | 18,442 | 12,993 | 3.66 | 2.58 |
| 1861 | 512,000 | 19,923 | 13,858 | 3.89 | 2.71 |
| 1862 | 518,000 | 20,122 | 14,187 | 3.88 | 2.74 |
| 1863 | 524,000 | 20,165 | 15,785 | 3.84 | 3.01 |
| 1864 | 530,000 | 19,768 | 15,100 | 3.73 | 2.85 |
| 1865 | 537,000 | 20,275 | 17,041 | 3.78 | 3.17 |
| 1866 | 544,000 | 20,702 | 17,218 Cholera | 3.80 | 3.16 |
| 1867 | 552,000 | 21,453 | 17,016 Scarlatina | 3.88 | 3.08 |
| 1868 | 560,000 | 22,298 | 17,784 Scarlatina | 3.98 | 3.17 |
| 1869 | 568,000 | 21,835 | 16,363 | 3.84 | 2.88 |
| 1870 | 576,000 | 22,480 | 16,226 | 3.90 | 2.82 |
| 1871 | 585,000 |
(+) Only Manchester plus Salford
Liverpool and West Derby
| Persons | Births | Burials | Birth Rate % | Death Rate % | |
| 1838- 1839 | 298,000 | 9,603 | 8,467 | 3.22 | 2.84 |
| 1839- 1840 | 306,000 | 9,925 | 9,990 | 3.24 | 3.26 |
| 1841 | 314,000 | 10,805 | 9,758 | 3.44 | 3.10 |
| 1842 | 323,000 | 12,428 | 9,785 | 3.84 | 3.03 |
| 1843 | 332,000 | 12,756 | 9,767 | 3.84 | 2.94 |
| 1844 | 342,000 | 13,057 | 10,200 | 3.81 | 2.98 |
| 1845 | 352,000 | 14,273 | 9,929 | 4.05 | 2.82 |
| 1846 | 362,000 | 15,440 | 13,537 Typhus | 4.26 | 3.73 |
| 1847 | 372,000 | 15,469 | 21,570 Typhus + Irish | 4.15 | 5.79 |
| 1848 | 382,000 | 15,456 | 13,163 | 4.04 | 3.44 |
| 1849 | 392,000 | 14,237 | 18,700 Cholera | 3.63 | 4.77 |
| 1850 | 402,000 | 14,441 | 10,822 | 3.59 | 2.69 |
| 1851 | 412,000 | 14,815 | 12,550 | 3.60 | 3.04 |
| 1852 | 420,000 | 13,676 | 12,067 | 3.25 | 2.87 |
| 1853 | 428,000 | 14,333 | 11,852 | 3.34 | 2.77 |
| 1854 | 436,000 | 15,666 | 14,797 Cholera | 3.59 | 3.43 |
| 1855 | 444,000 | 15,994 | 13,271 Cholera | 3.66 | 2.99 |
| 1856 | 452,000 | 16,539 | 12,363 | 3.65 | 2.73 |
| 1857 | 460,000 | 16,790 | 13,138 | 3.65 | 2.86 |
| 1858 | 478,000 | 16,734 | 14,781 | 3.50 | 3.10 |
| 1859 | 476,000 | 16,682 | 12,718 | 3.50 | 2.67 |
| 1860 | 483,000 | 16,246 | 13,206 | 3.36 | 2.73 |
| 1861 | 490,000 | 16,989 | 13,964 | 3.46 | 2.85 |
| 1862 | 498,000 | 19,222 | 14,747 | 3.86 | 2.96 |
| 1863 | 506,000 | 18,430 | 16,536 | 3.64 | 3.26 |
| 1864 | 512,000 | 21,029 | 18,562 | 4.10 | 3.63 |
| 1865 | 521,000 | 21,689 | 18,895 | 4.20 | 3.63 |
| 1866 | 530,000 | 21,585 | 22,250 Cholera | 4.12 | 4.20 |
| 1867 | 539,000 | 22,366 | 16,260 | 4.15 | 3.02 |
| 1868 | 549,000 | 22,192 | 16,785 | 4.04 | 3.06 |
| 1869 | 560,000 | 21,481 | 16,652 | 3.83 | 2.97 |
| 1870 | 570,000 | 22,052 | 18,386 | 3.87 | 3.22 |
| 1871 | 581,000 |
Leeds, town and out-townships
| Persons | Births | Burials | Birth Rate % | Death Rate % | |
| 1838-1839 | 164,000 | 6,175 | 4,690 | 3.76 | 2.86 |
| 1839-1840 | 166,000 | 6,664 | 4,209 | 4.01 | 2.53 |
| 1841 | 168,000 | 6,696 | 4,361 | 3.99 | 2.60 |
| 1842 | 170,000 | 6,376 | 4,612 | 3.75 | 2.71 |
| 1843 | 172,000 | 6,126 | 4,335 | 3.56 | 2.52 |
| 1844 | 174,000 | 6,584 | 4,124 | 3.78 | 2.37 |
| 1845 | 176,000 | 6,653 | 4,239 | 3.78 | 2.40 |
| 1846 | 178,000 | 6,882 | 4,529 | 3.86 | 2.54 |
| 1847 (*) | 180,000 | 6,325 | 5,693 | 3.51 | 3.16 |
| 1848 | 182,000 | 6,760 | 4,860 | 3.71 | 2.67 |
| 1849 | 184,000 | 6,612 | 7,274 Cholera | 3.59 | 3.95 |
| 1850 | 186,000 | 6,936 | 4,530 | 3.73 | 2.43 |
| 1851 | 189,000 | 7,232 | 5,477 | 3.82 | 2.90 |
| 1852 | 192,000 | 8,072 | 5,950 | 4.20 | 3.10 |
| 1853 | 195,000 | 7,686 | 5,009 | 3.94 | 2.57 |
| 1854 | 198,000 | 8,011 | 5,544 | 4.04 | 2.80 |
| 1855 | 202,000 | 8,114 | 5,594 | 4.02 | 2.77 |
| 1856 | 206,000 | 7,049 | 4,924 | 3.42 | 2.39 |
| 1857 | 210,000 | 8,208 | 5,360 | 3.91 | 2.55 |
| 1858 | 214,000 | 8,088 | 5,760 | 3.78 | 2.69 |
| 1859 | 218,000 | 8,366 | 5,401 | 3.83 | 2.48 |
| 1860 | 222,000 | 8,704 | 6,008 | 3.92 | 2.71 |
| 1861 | 226,000 | 8,733 | 6,217 | 3.86 | 2.75 |
| 1862 | 230,000 | 9,138 | 5,882 | 3.97 | 2.55 |
| 1863 | 234,000 | 9,350 | 7,052 | 3.99 | 3.01 |
| 1864 | 238,000 | 9,702 | 6,595 | 4.07 | 2.77 |
| 1865 | 243,000 | 10,418 | 7,314 | 4.29 | 3.01 |
| 1866 | 248,000 | 10,647 | 7,757 | 4.29 | 3.12 |
| 1867 | 253,000 | 10,981 | 6,571 | 4.34 | 2.60 |
| 1868 | 259,000 | 10,839 | 7,110 | 4.18 | 2.74 |
| 1869 | 265,000 | 10,774 | 7,309 | 4.06 | 2.75 |
| 1870 | 270,000 | 11,134 | 7,750 | 4.12 | 2.87 |
| 1871 | 275,000 |
(*) District divided into: Leeds, Hunsley
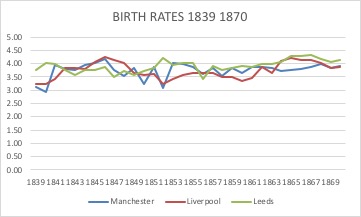
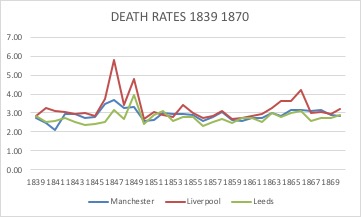
Also here, we see that there is no clear increase or decrease in birth/death rates. This gives us the surprising conclusion that industrialization and the undeniable worsening of housing and sanitation, did not have any effect on the quantity of deaths. The probable explanation is that these changes made life very difficult, but did not kill people.
The case of Leeds is clear. In 1821, the town was “livable”, and the Township had 48,000 inhabitants. In 1841, the town had extreme housing overcrowding, inexistent sanitary arrangements in the working-class areas (as described in the Report on Large Towns), and the Township population had nearly doubled to 88,000. Death rate for years around 1821 = 2.20, but with 18 % adjustment gives 2.60; death rate for years around 1841 = 2.60.
We also do not see any decrement in the deaths in Liverpool in the years 1860-1870, which we might have expected due to the considerable public works of 1850-1870 in cleaning the sanitary installations, and removing people from cellar dwellings.
The case of the movement of the better class of workers, shopkeepers, and mechanics from the Township of Manchester to the new suburb of Hulme in 1825 to 1860 is also illustrative. Hulme was laid out on a rectangular plan, the streets were wide, the houses were new and had an own privy in the back-yard, there were no inhabited cellars, the inhabitants were of decent occupations, and the suburb did not have any factories – with coal smoke – nearby. But in 1842, when the Manchester death rate was 3.35 %, the death rate in Hulme was only slightly less at 2.96 (Second Report on the State of Large Towns, 1845, Appendix, pp. 106-116).
Average age of persons living
The widely quoted phrase “the average worker in Liverpool lived only 15 years” seem to give the idea that if we walk along the street or visit a place of work in Liverpool in 1844, we would see only teenagers. This is/was not true. The real distribution by age of persons in the population is given by the following tables. We see that of those persons who are above 10 years of age, they are fairly equally distributed from the age of 10 to the age of 50.
Comparison of proportions of ages of persons living, Census 1821 and Census 1841:
| Age | 1821 | 1821 | 1841 | 1841 |
| Persons | Per cent | Persons | Per cent | |
| < 5 | 1,782,000 | 14.9 | 2,099,000 | 13.2 |
| 5-9 | 1,565,000 | 13.1 | 1,898,000 | 12.0 |
| 10-14 | 1,334,000 | 11.1 | 1,726,000 | 10.9 |
| 15-19 | 1,189,000 | 10.0 | 1,581,000 | 10.0 |
| 20-29 | 1,886,000 | 15.7 | 2,822,000 | 17.7 |
| 30-39 | 1,415,000 | 11.8 | 2,043,000 | 12.9 |
| 40-49 | 1,119,000 | 9.3 | 1,520,000 | 9.6 |
| 50-59 | 790,000 | 6.6 | 1,022,000 | 6.5 |
| 60-69 | 547,000 | 4.6 | 697,000 | 4.4 |
| 70-79 | 273,000 | 2.3 | 342,000 | 2.2 |
| 80-89 | 75,000 | 0.6 | 94,000 | 0.6 |
| 90-99 | 6,000 | 0.0 | 7,000 | 0.0 |
| 11,981,000 | 100.0 | 15,907,000 | 100.0 |
(1821: Porter, 1844; 1841: Accounts and Papers of the House of Commons, Volume 56, Table No. 255, pp. 280-283)
Living persons, Liverpool, Census 1821:
| Age | Persons | Per cent |
| < 5 | 17,900 | 14.7 |
| 5-9 | 16,800 | 14.1 |
| 10-14 | 13,200 | 11.2 |
| 15-19 | 11,200 | 9.4 |
| 20-29 | 18,000 | 15.2 |
| 30-39 | 16,500 | 14.0 |
| 40-49 | 12,600 | 10.7 |
| 50-59 | 7,000 | 5.9 |
| 60-69 | 3,800 | 3.2 |
| 70-79 | 1,500 | 1.3 |
| 80-89 | 380 | 0.3 |
| 90-99 | 40 | 0.0 |
| Total | 118,920 | 100.0 |
(Kaye, 1833, p. 68)
Comparison of proportions of ages of persons living, counties, Census 1841:
| Lancashire | West Riding | Wiltshire | ||||
| Persons | Per cent | Persons | Per cent | Persons | Per cent | |
| < 5 | 230,000 | 13.8 | 165,000 | 14.3 | 33,000 | 12.8 |
| 5-9 | 196,000 | 11.8 | 145,000 | 12.6 | 32,000 | 12.4 |
| 10-14 | 182,000 | 10.9 | 133,000 | 11.6 | 30,000 | 11.6 |
| 15-19 | 175,000 | 10.5 | 122,000 | 10.6 | 26,000 | 10.1 |
| 20-29 | 320,000 | 19.2 | 202,000 | 17.6 | 42,000 | 16.3 |
| 30-39 | 232,000 | 13.9 | 144,000 | 12.6 | 31,000 | 12.0 |
| 40-49 | 153,000 | 9.3 | 104,000 | 9.0 | 25,000 | 9.7 |
| 50-59 | 94,000 | 5.6 | 69,000 | 6.0 | 18,000 | 7.0 |
| 60-69 | 57,000 | 3.4 | 42,000 | 3.6 | 13,000 | 5.0 |
| 70-79 | 22,000 | 1.3 | 19,000 | 1.7 | 6,000 | 2.3 |
| 80-89 | 5,000 | 0.3 | 5,000 | 0.4 | 2,000 | 0.8 |
| 90-99 | 0 | 0.0 | 0 | 0.0 | 0 | 0.0 |
| Total | 1,666,000 | 100.0 | 1,150,000 | 100.0 | 258,000 | 100.0 |
(1841: Accounts and Papers of the House of Commons, Volume 56, Table No. 255, pp. 280-283)

(Edwin Chadwick, Report on the Sanitary Condition of the Labouring Population…, 1842, Comparative Chances of Life in different Classes of the Community, pp. 158-159)
The next point is that, as we see above, the “15 years” applies only to “labourers, mechanics, and servants”; the “tradesmen and their families” have an average age of 22 years, and the “gentry and professional persons” have an average age of 35 years.
But the most important point is that we have an incorrect conflation of the terms “average age at death” and “life expectancy”. The average age at death is a function of persons who were born in previous years, and who die in the present year; the life expectancy is a function of the persons who are born in the present year, and their possibility of dying in each future year. According to Mr. Chadwick, “In Liverpool – where the investigations into the condition of the resident cellar population certainly show an increase in the causes of death, – over crowding, defective ventilation, bad supplies of water, and increased filth, – the average age of death is, for the whole town, 17 or 18 years only, whilst the average age of the living population, as far as it can be made out from the mode in which the census is prepared, is 25 years. …. In Manchester, the average age of the living is 25 years, while the average age of the dying is only 18. In Leeds, the average age of the living is also 25 years, but the average age of the dying is only 21” (Chadwick, 1844, pp. 13-14).
Chadwick gives some arithmetical bases to show that the difference between average age at death and life expectancy, is greatest in those towns – or districts of towns – where the life expectancy is lowest. Further he states that these differences are exaggerated when the growth of population is high (which is the case that we are observing).
But actually, Chadwick does not give figures about the future. In his 1842 Report and in his 1844 Paper to the Statistical Society, he does not use the phrase “life expectancy”. On two occasions he uses the term “probabilities of life”, which is the probable duration of a life beginning now. “The probabilities of life at infancy for the whole population of Liverpool, as deduced from the actual ages at death of the whole population, would be 17 years; …” (1842, p. 219). “The probabilities of life at different periods on which insurance companies act, are determined by tables of a different construction. To form a table of the probabilities of life at given periods, in 1000 cases say, the date of the birth in each case is ascertained, and observations are made of how many remain alive at the end of each year at the different periods of life. …. More than half the children of the working classes die, and only one-fifth of the children die, before the fifth year of age; and after having attained that age, the probabilities of life of the labourer’s child might be greater than that of the child of the person of the superior classes; …” (1842, p. 167).
A further point of definition is that we do not here have a population such as exists today in England, where only a few persons die before the age of 50. This is a society in which about 35 % of the human beings who are born, die before their fifth birthday. We shall see later, that in the projection of deaths for persons (the cohort born in 1840) in future years, starting from the date of birth the average life expectancy is 38, but the average life expectancy for those who pass their fifth birthday is 52 additional years, or 57 years in total. So it is not useful to say that “the life expectancy is 38 years”; we should say that “35 percent of the persons die before their fifth birthday” in conjunction with “65 percent of the persons have a life expectancy of 57 years”. It is important to track these two parameters, because the two groups have different causes of their deaths.
We have a map of real “ages of the living” in England and Wales in 1861:

(Cambridge Group for the History of Population and Social Structure, PopulationsPast.org)
The average age in England and Wales at the Census of 1821 was 25.3 years, and at the Census of 1841 was 26.7 years. The average age in Great Britainin 1851, 1861, 1871, remained without movement at 26.4 years.
Life Expectancy per Person
Edwin Chadwick reported figures that showed an impressive difference in average life expectancy between the workers in manufacturing areas, and the labourers in agricultural counties (Chadwick, 1842, Section IV, Comparative Chances of Life in Different Classes of the Community). There was obviously a difference, but not exactly in the way he presents it. His figures correspond approximately to the following tables, which are taken from another source.
Distribution of ages at death for Manchester and for Dorset and Wiltshire in July 1839 to June 1840
| Manchester | Dorset and Wiltshire | |||||
| Deaths | 8,667 | 7,676 | ||||
| Births | 10,192 | 12,415 | ||||
| % of Deaths | % of Births | % of Deaths | % of Births | |||
| 0-1 | 2,116 | 24.4 | 20.7 | 1,357 | 17.7 | 10.9 |
| 1 | 1,099 | 12.7 | 10.7 | 424 | 5.5 | 3.4 |
| 2 | 568 | 6.6 | 5.6 | 264 | 3.4 | 2.1 |
| 3 | 443 | 5.1 | 4.3 | 174 | 2.3 | 1.4 |
| 4 | 332 | 3.8 | 3.2 | 139 | 1.8 | 1.1 |
| 5-9 | 537 | 6.2 | 5.3 | 357 | 4.7 | 2.9 |
| 10-14 | 188 | 2.2 | 1.8 | 238 | 3.1 | 1.9 |
| 15-19 | 238 | 2.7 | 2.3 | 326 | 4.2 | 2.6 |
| 20-29 | 573 | 6.6 | 5.6 | 662 | 8.6 | 5.3 |
| 30-39 | 589 | 6.8 | 5.8 | 465 | 6.1 | 3.7 |
| 40-49 | 567 | 6.5 | 5.6 | 449 | 5.8 | 3.6 |
| 50-59 | 461 | 5.3 | 4.5 | 515 | 6.7 | 4.1 |
| 60-69 | 469 | 5.4 | 4.6 | 715 | 9.3 | 5.8 |
| 70-79 | 352 | 4.1 | 3.4 | 907 | 11.8 | 7.3 |
| 80-89 | 99 | 1.1 | 1.0 | 576 | 7.5 | 4.6 |
| 90-100 | 22 | 0.3 | 0.2 | 90 | 1.1 | 0.1 |
| >100 | 2 | 0.0 | 0.0 | 16 | 0.2 | 0.0 |
(extracted from: Registrar-General, Annual Report of Births, Deaths, and Marriages, 1841, p. 35, p. 41)
(The above data were taken from the Registrar-General’s report, and not from Dr. Chadwick’s report, as the latter does not give enough precision, just the expression for example “1 in 1 ½ “. Thus, the present data refer to the totality of the urban area of Manchester and to the counties of Dorset and Wiltshire, and are not restricted to the working classes in each case.)
But it is not necessarily true to say “the manufacturing workers had a much lower life expectancy than the agricultural labourers”. The calculation is affected greatly by the high figures of child mortality (50 % deaths before 5 years in Manchester); i.e. the child deaths should not affect our judgement as to what happened to the adult workers.
If we calculate from the basis of those persons who were able to survive until their fifth birthday, the figures come much closer together:
Distribution of ages at death for Manchester and for Dorset and Wiltshire in July 1839 to June 1840, as a percentage of births (only those persons who had passed their fifth birthday).
| Manchester | Dorset and Wiltshire | |||
| Births | 5,634 | 10,057 | ||
| 5-9 | 537 | 9.5 | 357 | 3.5 |
| 10-14 | 188 | 3.3 | 238 | 2.4 |
| 15-19 | 238 | 4.2 | 326 | 3.2 |
| 20-29 | 573 | 10.1 | 662 | 6.6 |
| 30-39 | 589 | 10.4 | 465 | 4.6 |
| 40-49 | 567 | 10.0 | 449 | 4.5 |
| 50-59 | 461 | 8.2 | 515 | 5.1 |
| 60-69 | 469 | 8.3 | 715 | 7.1 |
| 70-79 | 352 | 6.2 | 907 | 9.0 |
| 80-89 | 99 | 1.8 | 576 | 5.7 |
| 90-100 | 22 | 0.4 | 90 | 0.9 |
| >100 | 2 | 0.0 | 16 | 0.0 |
And here we have a median life span of 40 for people in Manchester, and 53 for people in Dorset and Wiltshire.
But we also have to take into account that the Registrar-General’s figures refer to the past and not to the future. They show the number of persons born in e.g. one year of 1800-1809 who died in 1839/40, whereas we would really like to know how many people born in 1839/40 will die in one year of 1870-1879. This effect is multiplied by the extremely rapid growth (2.3 times) of the population of Manchester in the preceding 40 years. This means that the “universe” of people in 1800-1809, who might die in 1839/40, was small. If there had been 2.3 times more people in Manchester in 1800-1809, then the figure of deaths for 30-39 years old in 1839/40 would have been not 589 but about 1450. Wiltshire and Dorset grew more slowly (+ 45 %).
Distribution of ages at death for Total of England and Wales, in July 1839 to June 1840:
| England and Wales | |||
| Deaths | 350,100 | ||
| Births | 501,600 | ||
| % of Deaths | % of Births | ||
| 0-1 | 76,300 | 21.8 | 15.2 |
| 1 | 29,800 | 8.5 | 5.9 |
| 2 | 15,900 | 4.5 | 3.2 |
| 3 | 11,400 | 3.2 | 2.3 |
| 4 | 8,200 | 2.3 | 1.6 |
| 5-9 | 18,500 | 5.3 | 3.7 |
| 10-14 | 9,500 | 2.7 | 1.9 |
| 15-19 | 12,300 | 3.5 | 2.5 |
| 20-29 | 26,700 | 7.7 | 5.3 |
| 30-39 | 23,000 | 6.7 | 4.6 |
| 40-49 | 20,900 | 6.0 | 4.2 |
| 50-59 | 20,800 | 5.9 | 4.2 |
| 60-69 | 26,800 | 7.6 | 5.3 |
| 70-79 | 29,600 | 8.6 | 5.9 |
| 80-89 | 17,200 | 4.9 | 3.4 |
| 90-100 | 2,800 | 0.8 | 0.6 |
| >100 | 100 | 0.0 | 0.0 |
(extracted from: Registrar-General, Annual Report of Births, Deaths, and Marriages, 1841, p. 59)
In 1773, the actual enumeration of the town of Liverpool was found to be 32,400; dividing this by 1,191, the number of burials, we have a “value of life” of 1 in 27. “Liverpool, notwithstanding the crowded manner in which the inhabitants lived at that era, was then considered a healthy place; but a most marked improvement in the health and salubrity of the town has taken place since 1773.” In the year 1828 the deaths were 1,822, which, compared with a population of 150,000, gives a ratio of 1 in 40. “If there be no error in the calculation, or inaccuracy in the bills of mortality, Liverpool with its environs, is amongst the most healthy and salubrious spots in the country.”
(Kaye, 1833, p. 70)
“It is remarkable, that this superior value of life in Great Britain is not confined to any particular districts, or classes of individuals. To whatever point we turn our view, the advantage is still the same: the man of affluence, the pauper-patient of the hospital, the sailor and the soldier on active service, the prisoner of war, the inmate of a goal, all enjoy a better tenure of existence from this country than from any other of which we have been able to consult the records.”
(Hawkins, 1829, p. 30)
Although the life expectancy in the manufacturing regions was low, caused principally by the high mortality of the children, there were counties with a relatively large number of old persons. In Cornwall, Devon, Wiltshire, Dorset, and the extreme North of Lancashire, more than 20 % of the people were over 70 years old.
(Third Annual Report of the Registrar-General, 1841, p. 19)
The following table from the Annual Report of the Registrar-General for 1876 gives us the number of deaths (male) for England and Wales, by date of death and age at death. This means that we can have the numbers (real persons): died in 1840 at age 0, therefore were born in 1840; died in 1841 at age 1, therefore were born in 1840; died in 1842 at age 2, therefore were born in 1840; etc.
So we can construct a table of males born in 1840: how many died in 1840 at age 0; how many died in 1841 at age 1; how many died in 1842 at age 2; etc. This takes us up to those people who died in 1875, at age 35.
For the deaths from 1876 onwards, we use the data in the table 19 on page xxviii of the 1876 Report, which shows what percentage of the people who were living in 1876 (*), and were of the age of e.g. 35 to 45, died in the year 1876, and thus we can estimate the deaths of persons born in 1840 and who died in 1876-1885; and consecutively for the following ten-year periods. (*) (The figures for 1848-72 were similar)
(Thirty-Ninth Annual Report of the Registrar-General of births, deaths, and marriages, 1876; p. lxviii)
The resulting table can give us the number of persons who died in each calendar year (or quinquennium, or decade), which then permits us to calculate the life expectancy for the cohort “born in 1840”. The life expectancy from birth is 37.3 years, and the expectancy for those who survived to 5 years of age was 52.1 additional years.
| 1840 | MALES | |||||
| Born | Died | Number Died | Surviving at end of Period | Age at Death | Per cent | Weighted |
| 1840 | 257,400 | |||||
| 1840 | 1840 | 43,900 | 213,500 | 0.5 | 17.1 | 21,900 |
| 1840 | 1841 | 14,000 | 199,500 | 1 | 5.4 | 14,000 |
| 1840 | 1842 | 7,500 | 192,000 | 2 | 2.9 | 15,000 |
| 1840 | 1843 | 4,700 | 187,300 | 3 | 1.8 | 14,100 |
| 1840 | 1844 | 3,700 | 183,600 | 4 | 1.4 | 14,800 |
| 1840 | 1845-1849 | 9,460 | 174,140 | 7 | 3.7 | 66,220 |
| 1840 | 1850-1854 | 4,940 | 169,200 | 12 | 1.9 | 59,280 |
| 1840 | 1855-1859 | 5,960 | 163,240 | 17 | 2.3 | 101,320 |
| 1840 | 1860-1864 | 7,380 | 155,860 | 22 | 2.9 | 162,360 |
| 1840 | 1865-1874 | 15,840 | 140,020 | 30 | 6.2 | 475,200 |
| 45.6 | ||||||
| 1840 | 1875-1884 | 19,600 | 120,420 | 40 | 7.6 | 784,000 |
| 1840 | 1885-1894 | 23,400 | 97,020 | 50 | 9.1 | 1,170,000 |
| 1840 | 1895-1904 | 33,400 | 63,620 | 60 | 13.0 | 2,004,000 |
| 1840 | 1905-1914 | 42,200 | 21,420 | 70 | 16.4 | 2,954,000 |
| 1840 | 1915-1924 | 19,300 | 2,120 | 80 | 7.3 | 1,544,000 |
| 1840 | 1925-1940 | 2,120 | 0 | 90 | 1.0 | 190,800 |
| 54.4 | ||||||
| e (0) | ||||||
| 37.3 | ||||||
| 2.7 % p.a. | ||||||
| e (5) | ||||||
| 52.1 |
From a similar report about Females, we can construct a table of deaths in each year. The life expectancy from birth was 40.1 years, and the life expectancy of those who survived to 5 years was 56.3 additional years.
| 1840 | FEMALES | |||||
| Born | Died | Number Died | Surviving at end of Period | Age at Death | Per cent | Weighted |
| 1840 | 244,800 | |||||
| 1840 | 1840 | 33,900 | 210,900 | 0.5 | 13.8 | 16,950 |
| 1840 | 1841 | 13,200 | 197,700 | 1 | 5.4 | 13,200 |
| 1840 | 1842 | 7,300 | 190,400 | 2 | 3.0 | 14,600 |
| 1840 | 1843 | 4,800 | 185,600 | 3 | 2.0 | 14,400 |
| 1840 | 1844 | 3,500 | 182,100 | 4 | 1.4 | 14,000 |
| 1840 | 1845-1849 | 9,200 | 172,900 | 7 | 3.8 | 64,400 |
| 1840 | 1850-1854 | 5,080 | 167,820 | 12 | 2.1 | 60,960 |
| 1840 | 1855-1859 | 6,720 | 161,100 | 17 | 2.7 | 114,240 |
| 1840 | 1860-1864 | 7,380 | 153,720 | 22 | 3.0 | 162,360 |
| 1840 | 1865-1874 | 16,350 | 137,370 | 30 | 6.7 | 490,500 |
| 43.9 | ||||||
| 1840 | 1875-1884 | 16,070 | 121,300 | 40 | 6.6 | 642,800 |
| 1840 | 1885-1894 | 18,440 | 102,860 | 50 | 7.5 | 922,000 |
| 1840 | 1895-1904 | 29,100 | 73,760 | 60 | 11.9 | 1,746,000 |
| 1840 | 1905-1914 | 43,080 | 30,680 | 70 | 17.6 | 3,015,600 |
| 1840 | 1915-1924 | 24,500 | 6,180 | 80 | 10.0 | 1,960,000 |
| 1840 | 1925-1940 | 6,180 | 0 | 90 | 2.5 | 556,200 |
| 56.1 | ||||||
| e (0) | ||||||
| 40.1 | ||||||
| 2.5 % p.a. | ||||||
| e (5) | ||||||
| 56.3 |
Average of males and females was 38.7 years and 54.2 additional years.
The life expectancies for males and for females born in July 1840 – June 1841, according to the calculation in the Registrar-General’s Report for 1841, pp. 19-25, were 40.19 yearsand 42.18 years. The calculation here presented is closer to the reality, as it includes persons who actually died in the years 1840 to 1875.
Following, we have the “Life Table” for England and Wales for persons born in 1840, and which is very close to the numbers calculated in this chapter. In any case, we see that the males and females who survived their first five years, had about a 65 % of reaching the age of 65.
(Fifth Annual Report of the Registrar-General of births, deaths, and marriages, 1841; p. 23)
