Following we have the mortality rates for different types of town, at the end of the eighteenth century and the beginning of the nineteenth century, taken from an earlier chapter.
| Town type | Under the age of 1 | Between 1 and 2 | Between 2 and 5 | Between 5 and 10 | Total under 10 | |
| London | 169 | 82 | 77 | 30 | 358 | |
| Large towns | 186 | 99 | 93 | 34 | 458 | |
| Smaller towns | 167 | 83 | 88 | 32 | 371 | |
| Village parishes | 216 | 57 | 52 | 27 | 352 | |
| Agricultural Parishes | 132 | 52 | 58 | 33 | 275 |
We shall see that the correct statement is not “the Industrial Revolution increased the death rate for infants and children against previous periods”, but “there was a decrease in the death rate in the agricultural counties and in London, and an increase in the industrial counties”.
The first quantitative data which can help us to understand the probabilities of death for small children of the working class, come from reports which were required by the Lords Committee on the State of Children employed in Manufactories in 1819. This gave the total list of the heads of family in each mill or street, with names, noting the number of children living, dead, and born.
| Place | Number of Families | Number of Years married (average) | Children Living | Children Dead | Children Born |
| Cotton Mills in Holywell and Greenfield, Wirral | 101 | 13 | 352 | 138 (28 %) | 490 |
| Other Occupations in Holywell and Greenfield, Wirral | 101 | 17 | 290 | 171 (37 %) | 461 |
| Cotton Mill of Messrs. Peter Ewart, Manchester | 41 | 6 | 72 | 60 (45 %) | 132 |
| M’Connel and Kennedy’s Factories, Manchester | 108 | 14 | 307 | 217 (41 %) | 524 |
| Spinners, Adam and George Murray, Manchester | 133 | 12 | 339 | 252 (43 %) | 591 |
| Factory of William Douglas and Co., Pendleton | 205 | 12 | 266 | 192 (42 %) | 458 |
| Families, where no part of the Family works in Factories, Manchester | 361 | 14 | 906 | 747 (45 %) | 1,653 |
| Families, where Children only Work in Factories, and not the Parents, Manchester | 171 | 20 | 687 | 488 (41 %) | 1,175 |
| Families, where the Heads of Families work in Factories, Manchester | 292 | 15 | 830 | 563 (40 %) | 1,393 |
| Families of Persons in various Employments, Manchester | 156 | 17 | 494 | 435 (47 %) | 929 |
| Parent employed in Cotton Spinning, Preston | 56 | 12 | 196 | 72 (27 %) | 268 |
| Parent employed in any Occupation, and some or any of the Children working in Cotton Mills, Preston | 58 | 18 | 281 | 134 (32 %) | 415 |
| Parent employed in any Occupation, and none of the Children working in Cotton Mills, Preston | 54 | 16 | 193 | 125 (39 %) | 318 |
| James Heginbottom and Co.’s Cotton Mill, Ashton-under-Line | 40 | – | 140 | 50 (26 %) | 190 |
| Catrine Cotton Works, Ayr | 276 | 24 | 1439 | 599 (29 %) | 2038 |
| Village of Mauchline, Ayr | 240 | 19 | 827 | 404 (33 %) | 1231 |
| Agricultural District of the Parish of Mauchline, Ayr | 110 | 21 | 543 | 114 (32 %) | 657 |
| Wool Factory in the Agricultural District of Mauchline Parish | 7 | 15 | 26 | 16 (38 %) | 42 |
| Village of Sorn, Ayr | 70 | 20 | 274 | 101 (27 %) | 375 |
| Agricultural District of the Parish of Sorn | 163 | 21 | 742 | 204 (22 %) | 946 |
| Families now or formerly employed at the Deanston Cotton Works, Kilmadock, Perth | 52 | 21 | 283 | 75 (21 %) | 358 |
| All the married families in the Parish of Lescropt, Stirling | 73 | 21 | 301 | 87 (22 %) | 388 |
(Lords Committee on the State of Children …., 1819, Appendix, Tables 10 to 29)
From the number of years married in each case, we can suppose that the children (living or dead) were born in the years from about 1805 to 1819. Probably the average age of the children (or the theoretical age, had they lived) at the time of the reports would be about 10 years old. So we have a death rate up to 10 years of 40-45 % in the case of families living in Manchester, and of 20-33 % in the case of families living in villages in the Scottish Lowlands. This gives us the well-known differentiation between manufacturing regions and agricultural regions. What we do not know, is if the death rate in Manchester in the previous generation was also 40-45 % (i.e. towns had always been at this level), or had been 35 % (i.e. there were more deaths due to the more difficult environment). We note that the proportion in Manchester was 40-45 %, even for those groups of families, that did not work in the factories.
In any case, it is not pleasant to lose a number of children. In one of the lists, we find at the first position on the page, a couple married for 24 years, who had had 17 children, of whom 12 had died.
There was no worsening of the infant and child mortality rates from 1800 to 1835, we have some comments from specialists, and a calculation from Mr. George Porter of the Board of Trade.
“That the actual mortality under the age of ten is universally less than it was 25 years ago, …. there are convincing proofs, which depend on the acknowledged fact of the mortality, compared with the population, being everywhere diminished.”
(Dr. John Roberton, Observations on the Mortality and Physical Management of Children, 1827, Section V, On the Comparative Mortality of Children before and since the Commencement of the Present Century, pp. 46-47)
mortality under the age of ten universally less than it was twenty-five years ago.” [The contents of the section are not visible in Internet].
(Dr. John Roberton, Observations on the Mortality and Physical Management of Children, 1827)
“The very great diminution of the mortality of infants in England is one of the most remarkable phenomena of modern times”
(T. R. Edmonds, Mortality of Infants in England, The Lancet, Vol. 1, 1835-36, p. 690)
“The effect of those better habits has been the prolongation of the average period of life among the working classes?” “Yes; cleanliness, their better nursing, and their better feeding of their children, better training in every particular, have produced this effect.”
“There are more children reared than there used to be?” “To a very great extent. From the best inquiries I have been able to make of everybody likely to posess information, and especially some connected with Life Insurance Offices, I have the most satisfactory assurance that more children are reared, and the term of life is prolonged very considerably. I mean that this is so independently of the extermination to a great extent of the small-pox and the autumnal fever.”
(Mr. Francis Place, political and educational reformer, Evidence to the Select Committee on Education in England and Wales, 1835, p. 74)
Mr. Porter gives us a comparison between 1813, 1818-1824, and 1830, of the proportions of ages at death; we see that the percentage of “From Birth to 10 Ten Years old” practically does not change.
| Age at which the Deaths have occurred | 1813 Per Cent | 1818-1824 (average) Per Cent | 1830 Per Cent |
| From Birth to 10 Years old | 39.75 | 39.60 | 38.56 |
| “ 11 “ 20 “ | 5.87 | 6.33 | 6.63 |
| “ 21 “ 30 “ | 7.47 | 7.09 | 8.06 |
| “ 31 “ 40 “ | 6.77 | 6.69 | 6.77 |
| “ 41 “ 50 “ | 6.51 | 6.61 | 6.42 |
| “ 51 “ 60 “ | 7.46 | 7.14 | 7.35 |
| “ 61 “ 70 “ | 9.75 | 9.44 | 9.27 |
| “ 71 “ 80 “ | 10.34 | 10.25 | 10.55 |
| “ 81 “ 90 “ | 5.37 | 5.57 | 5.74 |
| “ 91 “ 100 “ | 0.67 | 0.65 | 0.04 |
| Above 100 | 0.04 | 0.03 | 0.02 |
(Porter, 1836, Vol. 1, Population, p. 30)
To extend this to 1840, we can take the report of Comparative Mortality from the 1841 Census, which gives the “under 5 years” for the average 1813-1830 at 34.5 percent and for the average 1831-1840 at 35.4; for “5 to 9 years” the figures are 4.2 and 4.9 (Parish Register Abstract, England and Wales, 1841, Preface, p. xxi).
The quantitative investigation that we have to carry out, is to see if the percentage figures for infant mortality (0-11 months) and for child mortality (12-59 months) increase during the period 1800-1860. We do not have data from the same administrative sources, or with the same quality, for the whole period. For the births and deaths, from 1801 to 1831, we have collections of “Parish Registers”; from 1837 to 1860, we have the birth and death forms as organized by the Registrar-General in the terms of the Marriage and Registration Act. The incoming data for 1801 to 1831 are not complete, particularly because they do not include births and deaths of children who died before they were baptized. The data for years from 1837, are absolutely reliable.
In the following sub-chapter on “Life Expectancy”, we will see that it is possible to demonstrate a continuity (adjusting the earlier figures with + 18 %) from the numbers up to 1831, with those starting from 1837, and that the birth rates and death rates do not change in an important amount in the period 1801 to 1860.
Here we have to go through the same processes as for the birth and death rates, but for the percentages of infant mortality and child mortality. First we shall inspect some data from the period of 1801-1831, then we shall attempt to construct a “bridge” between the earlier and later series, and then we shall copy figures from the Registrar-General’s Annual Reports, and show that these do not have increases during the period 1837-1860.
There is only one source which gives us numbers as to infant and child mortality for the years before 1837. It comes from a government compilation of information from the year 1834. The original pages give the number of persons “buried and registered” by each year of age, and for every calendar year from 1813 to 1830, but with only the total for England and Wales. Thus we can copy figures of the deaths at age “Under 1 Year”, “1 Year”, etc.
| Births | Deaths | Under 1 Year | 1 Year | 2 Years | 3 Years | 4 Years | Total under 5 Years | |
| 1813 | 314.4 | 186.4 | 36.2 | 11.9 | 7.4 | 4.7 | 3.3 | 63.5 |
| 1814 | 318.9 | 206.4 | 39.1 | 12.6 | 7.9 | 4.9 | 3.5 | 67.7 |
| 1815 | 314.9 | 197.4 | 40.3 | 12.3 | 7.2 | 4.9 | 3.3 | 68.0 |
| 1816 | 330.2 | 205.9 | 40.3 | 12.9 | 7.3 | 4.5 | 3.3 | 68.3 |
| 1817 | 331.6 | 199.3 | 39.0 | 14.0 | 7.9 | 4.7 | 3.2 | 68.8 |
| 1818- 1824 av. | 378.4 | 221.3 | 42.7 | 14.7 | 8.5 | 5.1 | 3.6 | 74.6 |
| 1825 | 375.0 | 255.0 | 49.1 | 16.6 | 9.5 | 5.4 | 3.8 | 84.4 |
| 1826 | 380.4 | 268.2 | 49.1 | 16.9 | 9.9 | 5.8 | 4.0 | 85.7 |
| 1827 | 374.2 | 251.9 | 46.3 | 16.3 | 9.2 | 5.7 | 3.9 | 81.4 |
| 1828 | 392.4 | 255.3 | 49.6 | 17.0 | 9.5 | 5.7 | 3.9 | 85.7 |
| 1829 | 380.2 | 264.2 | 46.5 | 16.6 | 9.6 | 6.1 | 4.4 | 83.2 |
| 1830 | 382.1 | 254.0 | 43.8 | 16.3 | 9.2 | 5.6 | 4.1 | 79.0 |
(figures in thousands of persons)
(Tables of the Revenue, Population, Commerce &c. of the United Kingdom, 1834, Part 3; Table 400 – An Account of the Ages of Males and Females Buried and Registered in England and Wales in each Year, from 1813 to 1830, inclusive, p. 455)
We can convert this table to rates per birth, presented in per 1000:
| Under 1 Year | 1 Year | 2 Years | 3 Years | 4 Years | Total under 5 Years | |
| 1813 | 115 | 38 | 23 | 15 | 10 | 201 |
| 1814 | 122 | 40 | 25 | 16 | 10 | 212 |
| 1815 | 128 | 37 | 23 | 16 | 11 | 216 |
| 1816 | 122 | 39 | 22 | 14 | 10 | 205 |
| 1817 | 118 | 42 | 24 | 14 | 10 | 208 |
| 1818- 1824 av. | 113 | 39 | 22 | 14 | 10 | 197 |
| 1825 | 131 | 44 | 25 | 14 | 10 | 225 |
| 1826 | 129 | 44 | 26 | 15 | 11 | 226 |
| 1827 | 123 | 43 | 25 | 15 | 10 | 218 |
| 1828 | 127 | 43 | 24 | 15 | 10 | 219 |
| 1829 | 122 | 44 | 25 | 16 | 12 | 219 |
| 1830 | 115 | 43 | 24 | 15 | 11 | 206 |
(figures in per 1000 of births)
But the numbers of births and deaths from the system of collection of data of the years before 1837 (“Abstracts of Parish-Registers”) do not include all the births and deaths, as they do not have the children who died without being baptized, some reports from churches of the non-conformist Protestant are missing, and those persons who died abroad or at sea are not included. See the first pages of the next sub-chapter “Life Expectancy”, the letter of Mr. J. Finlayson, Actuary of the General Debt Office, February 2nd 1839, to the Registrar-General in the First Annual Report of the Registrar-General, pp. 82-86, and Porter, 1847, Population, p. 49.
Based on Mr. Finlayson’s calculations, we should a) divide the death rates by 1.18, as this is the proportion missing from the absolute numbers of births (denominator), b) add 10 percentage points to the totality of the death rates for the first five years, as this represents the children who died before being baptized (nearly all should be in the first 12 months of life).
This gives us:
| Under 1 Year | 1 Year | 2 Years | 3 Years | 4 Years | Total under 5 Years | |
| Average of the above table | 119 | 41 | 24 | 15 | 11 | 210 |
| Adjust divide 1.18 | 101 | 34 | 21 | 12 | 9 | 177 |
| Adjust add 100 p mil | 178 | 44 | 26 | 16 | 13 | 277 |
So that the real facts based on the original data were: infant mortality 178 / 1000, child mortality 99 / 1000, total 277 / 1000.
Mr. Porter, in a presentation to the Statistical Society of London in 1841, commented the basic figures of the Census taken in early 1841. One point that he showed was the proportions of deaths at different ages, as a comparison between 1838-1841 and 1813-1830, which appeared to show a worsening of the parameter of “deaths under five years”. But he said that this was against the general judgment that the per cent child mortality had decreased, and that the reason for the apparent increase was the under-registration before 1838.
“In the table given in the Appendix will be found the number of deaths registered at different ages during each of the three years ending 30th June, 1838, 1839, and 1840 as returned to the Registrar-General; the aggregate of these three years; the number of deaths at different ages recorded in the parish registers during the 18 years from 1813 to 1830, and the proportions of those deaths in each 10,000 that occurred at different ages.
From this table it would appear, that the proportional number of deaths under five years of age has been very materially greater during the three years ending June, 1840, than it was during the 18 years ending with 1830. This result is contrary to the general and probably well founded opinion that a larger proportion of infants are reared now than were reared in the earlier years of this century, though the general adoption of vaccination, and the spread of more rational treating the diseases of infancy. It is contrary also to the evidence afforded by the comparative ages of persons now living, as already has been sufficiently pointed out.
It is evident that the returns of deaths from the parish registers for the 18 years from 1813 to 1830 were very greatly deficient in the numbers registered. The population has increased since 1821 (about midway between 1813 and 1830) only 33 per cent. while the yearly burials as returned to the Registrar-General are 55 per cent. greater than those recorded in the 18 years. May we not conjecture that an unduly small proportion of infants were buried in consecrated grounds? If so, this would account for the discrepancy that has been noted, but we are not possessed of any data by which to certify the error.”
(Porter, An Examination of some Facts obtained at the recent Enumeration…,1841)
(Underline by this author)
Here following, a simplified presentation of these data, in another publication by Mr. Porter.
Proportions of Deaths in 10,000 at different Ages
| 1838 | 1839 | 1840 | 1841 | 1842 | Five Years 1838- 1842 | Eighteen Years 1813- 1830 | |
| Under 5 years | 3,911 | 3,959 | 4,056 | 3,892 | 3,962 | 3,967 | 3,451 |
| 5 to 10 “ | 460 | 476 | 538 | 520 | 490 | 505 | 424 |
| 10 “ 15 “ | 259 | 272 | 271 | 265 | 259 | 268 | 265 |
| 15 “ 20 “ | 342 | 354 | 353 | 351 | 339 | 347 | 343 |
| 20 “ 30 “ | 787 | 796 | 765 | 780 | 753 | 772 | 781 |
| 30 “ 40 “ | 685 | 677 | 658 | 658 | 649 | 660 | 672 |
| 40 “ 50 “ | 644 | 629 | 597 | 605 | 596 | 611 | 660 |
| 50 “ 60 “ | 640 | 630 | 596 | 622 | 620 | 619 | 700 |
| 60 “ 70 “ | 820 | 806 | 768 | 812 | 814 | 802 | 917 |
| 70 “ 80 “ | 858 | 837 | 829 | 877 | 881 | 855 | 1,049 |
| 80 “ 90 “ | 515 | 437 | 496 | 531 | 526 | 511 | 642 |
| 90 “ 100 “ 100 & upwards | 79 | 77 | 77 | 83 | 88 | 83 | 96 |
(Porter, 1847, Vol. 1, Population, p. 17)
We have comments in two books, which are general guides to Manchester and to Liverpool, which may not be in accordance with our ideas as to children’s deaths. It appears that the idea was that the large proportion of children dying, did not enter into a judgement of the healthiness of the places; it was “acceptable”.
“Notwithstanding its low situation, Manchester is a healthy place, if we are to judge by the longevity of its inhabitants, and the bills of mortality, which exhibit a far greater number of births than burials.” (Aston, 1828, p. 3)
“…. render Liverpool one of the healthiest places in the kingdom, in proportion to the number of inhabitants.” (Kaye, 1833, p. 65)
“If there be no error in the calculation, or inaccuracy in the bills of mortality, Liverpool with its environs, is amongst the most healthy and salubrious spots in the country.” (Kaye, 1833, p. 70)
The only town, for which we have figures of child deaths from 1800 to 1840, is Liverpool; the yearly Bills of Mortality do include «age at death».
Bills of Mortality, Liverpool (parish only)
| Year | Persons | Births | Burials | Died under 2 years | Died between 2 and 5 Years | Per 1000 | Per 1000 | |
| 1802 | 78,000 | 3,123 | 2,480 | 837 | 344 | 268 | 110 | |
| 1811 | 92,000 | 4,183 | 3,078 | 987 | 278 | 236 | 66 | |
| 1812 | 94,000 | 3,889 | 2,546 | 797 | 254 | 204 | 65 | |
| 1813 | 96,000 | 3,535 | 2,534 | 908 | 304 | 256 | 86 | |
| 1814 | 98,000 | 3,851 | 2,677 | 722 | 291 | 172 | 69 | |
| 1815 | 100,000 | 4,068 | 3,298 | 1,210 | 426 | 297 | 103 | |
| 1816 | 103,000 | 4,153 | 3,033 | 959 | 341 | 231 | 82 | |
| 1817 | 106,000 | 4,315 | 3,372 | 1,117 | 365 | 259 | 84 | |
| 1818 | 109,000 | 4,432 | 3,652 | 1,136 | 446 | 256 | 100 | |
| 1819 | 112,000 | 4,548 | 3,728 | 1,236 | 430 | 272 | 95 | |
| 1820 | 115,000 | 4,718 | 3,157 | 991 | 303 | 210 | 64 | |
| 1821 | 119,000 | 4,629 | 3,497 | 1,232 | 411 | 266 | 89 | |
| 1822 | 123,000 | 4,734 | 3,379 | 1,164 | 359 | 245 | 75 | |
| 1823 | 127,000 | 5,029 | ||||||
| 1824 | 131,000 | 5,305 | 4,132 | 1,432 | 467 | 270 | 88 | |
| 1825 | 135,000 | 6,527 | 4,143 | 1,448 | 422 | 310 | 64 | |
| 1826 | 139,000 | 6,579 | 4,485 | 1,592 | 589 | 242 | 89 | |
| 1837 | 201,000 | 9,388 | 6,875 | 2,483 | 822 | 264 | 87 |
(General Bills of Mortality, Churchwardens, Liverpool; The Stranger’s Guide to Liverpool, different years)
The challenge is to “knit together” the births/deaths from 1831 with those of 1837, as they may well have been collected with different premises.
We need to show that the 1837 data are consistent in their values from those of 1831, and we do have reasonable evidence:
- We have found that the infant mortality rate and child mortality rate from the years up to 1831 are 178 / 1000 and 98 / 1000, giving a total of 277 / 1000; we shall see that the numbers for the first years from 1837 for the total of the country, are 150 / 1000 and 120 / 1000, giving a total of 270 / 1000.
- For Liverpool, we do have a direct connection in the year 1837: the parish registers give 264 / 1000 and 87 / 1000, giving a total of 351 / 1000; if we adjust with + 10 percentage points, we have 344 / 1000 and 107 / 1000, giving a total of 451 / 1000; the Registrar-General has 243 / 1000 and 213 / 1000, giving a total of 454 / 1000.
- Mr. George Porter compares the yearly statistics of deaths from 1801 to 1831 from the Parish Registrars, with an annual average for 1831 to 1841 calculated by the Census Commissioners, and finds them to be practically equal; that is, the real facts did not change in this transition period.
The numbers below for 1838 to 1870 are taken from the Annual Reports of the Registrar-General: the pages of Deaths at Different Ages, given per Registration District.
The numbers below for Manchester, Liverpool, Leeds, refer to the whole conurbation in each case. Particularly in the case of Manchester, we know that the better class of workers from 1825 moved to new housing areas in Hulme and Chorlton. It would not be correct to use only Manchester Township, and thus have birth/death data from only the poorer workers.
Total England and Wales
| Births | Deaths | Under 1 Year | 1 to 4 Years | Per 1000 | Per 1000 | |
| 1838- 1839 | 480,000 | 331,000 | 72,304 | 58,390 | 151 | 122 |
| 1839- 1840 | 501,000 | 350,000 | 76,328 | 65,419 | 152 | 131 |
| 1840- 1841 | 504,000 | 355,000 | 75,507 | 64,582 | 150 | 128 |
| 1842 | 517,000 | 349,000 | 78,704 | 60,331 | 152 | 117 |
| 1843 | 527,000 | 346,000 | 79,253 | 58,370 | 150 | 111 |
| 1844 | 540,000 | 356,000 | 80,716 | 59,918 | 149 | 111 |
| 1845 | 543,000 | 349,000 | 77,426 | 58,151 | 142 | 107 |
| 1846 | 572,000 | 390,000 | 93,644 Cholera | 66,975 | 163 | 117 |
| 1847 | 539,000 | 423,000 | 88,508 Cholera | 69,863 | 164 | 130 |
| 1848 | 563,000 | 400,000 | 86,437 | 69,698 | 153 | 123 |
| 1849 | 578,000 | 440,000 | 92,171 Cholera | 68,839 | 159 | 119 |
| 1850 | 593,000 | 368,000 | 86,302 | 58,359 | 145 | 98 |
| 1851 | 616,000 | 395,000 | 96,753 | 65,197 | 157 | 105 |
| 1852 | 624,000 | 407,000 | 98,660 | 67,454 | 158 | 108 |
| 1853 | 612,000 | 421,000 | 101,501 | 63,577 | 165 | 103 |
| 1854 | 634,000 | 438,000 | 99,299 Cholera | 78,886 | 157 | 124 |
| 1855 | 635,000 | 425,000 | 97,503 | 68,240 | 153 | 107 |
| 1856 | 657,000 | 390,000 | 94,407 | 62,660 | 144 | 95 |
| 1857 | 663,000 | 419,000 | 103,928 | 70,056 | 157 | 105 |
| 1858 | 655,000 | 449,000 | 103,837 | 83,092 | 158 | 127 |
| 1859 | 689,000 | 441,000 | 105,629 | 77,715 | 153 | 112 |
| 1860 | 684,000 | 422,000 | 100,984 | 65,800 | 147 | 96 |
| 1861 | 696,000 | 435,000 | 106,428 | 74,701 | 152 | 107 |
| 1862 | 712,000 | 436,000 | 101,173 | 77,140 | 142 | 108 |
| 1863 | 727,000 | 473,000 | 108,089 | 93,921 | 149 | 129 |
| 1864 | 740,000 | 495,000 | 112,935 | 86,668 | 153 | 117 |
| 1865 | 748,000 | 491,000 | 119,810 | 80,035 | 160 | 107 |
| 1866 | 754,000 | 501,000 | 120,299 | 82,720 | 159 | 110 |
| 1867 | 768,000 | 471,000 | 117,261 | 71,337 | 152 | 92 |
| 1868 | 786,000 | 480,000 | 122,075 | 81,054 | 155 | 103 |
| 1869 | 773,000 | 494,000 | 120,274 | 83,288 | 155 | 107 |
| 1870 | 792,000 | 515,000 | 126,638 | 84,957 | 160 | 107 |
This result was unexpected, it shows that the average over the different regions of the country for deaths under 12 months was in a small range from 145 to 158 / 1000 (leaving out years with epidemic illnesses). This can only be explained if we suppose that these deaths were not in a function of the financial situation of the family nor of the work situation (industrialization); rather they were caused by the difficulty of the mothers to look after their babies, which remained unchanged through these years.
Equally the average for 1 to 4 years was in the range from 110 to 130 / 1000.
Manchester, Salford, Chorlton
| Births | Burials | Under 1 Year | 1 to 4 Years | Per 1000 | Per 1000 | |
| 1838- 1839 (+) | 10,700 | 9,276 | 2,045 | 2,214 | 191 | 207 |
| 1839- 1840 (+) | 10,192 | 8,667 | 2,116 | 2,442 | 207 | 240 |
| 1841 | 14,051 | 10,378 | 2,651 | 2,546 | 188 | 181 |
| 1842 | 13,857 | 10,748 | 3,029 | 2,566 | 218 | 185 |
| 1843 | 14,109 | 11,057 | N/A | N/A | ||
| 1844 | 15,194 | 10,470 | N/A | N/A | ||
| 1845 | 15,802 | 10,898 | 2,944 | 2,470 | 186 | 156 |
| 1846 | 16,758 | 14,095 Typhus | 4,225 | 3,508 | 252 | 209 |
| 1847 | 15,482 | 15,114 Typhus | 3,413 | 3,441 | 222 | 222 |
| 1848 | 14,949 | 13,841 | 3,281 | 3,585 | 219 | 240 |
| 1849 | 16,686 | 14,426 | 3,631 | 2,876 | 217 | 172 |
| 1850 | 14,403 | 11,383 | 3,364 | 2,463 | 233 | 171 |
| 1851 | 17,570 | 11,855 | 3,418 | 2,173 | 194 | 123 |
| 1852 | 14,268 | 13,828 Epidemic diarrhea | 4,144 | 3,289 | 290 | 230 |
| 1853 | 18,644 | 13,821 | 3,804 | 2,982 | 204 | 160 |
| 1854 | 18,862 | 13,953 | 3,807 | 3,335 | 202 | 177 |
| 1855 | 18,508 | 13,803 | 3,828 | 3,150 | 206 | 170 |
| 1856 | 17,357 | 12,356 | 3,414 | 2,648 | 197 | 152 |
| 1857 | 18,697 | 13,643 | 3,876 | 2,829 | 207 | 151 |
| 1858 | 17,398 | 14,947 | 3,606 | 3,972 | 207 | 228 |
| 1859 | 19,093 | 13,136 | 3,439 | 2,693 | 180 | 141 |
| 1860 | 18,442 | 12,993 | 3,241 | 2,390 | 176 | 129 |
| 1861 | 19,923 | 13,858 | 3,640 | 3,035 | 183 | 152 |
| 1862 | 20,122 | 14,187 | 3,429 | 3,514 | 170 | 174 |
| 1863 | 20,165 | 15,785 | 3,727 | 4,242 Scarlatina | 184 | 210 |
| 1864 | 19,768 | 15,100 | 3,520 | 3,208 | 178 | 162 |
| 1865 | 20,275 | 17,041 | 4,322 | 3,448 | 213 | 170 |
| 1866 | 20,702 | 17,215 Cholera | 4,252 | 3,175 | 205 | 153 |
| 1867 | 21,453 | 17,016 | 4,366 | 3,696 Scarlatina | 204 | 172 |
| 1868 | 22,298 | 17,874 | 4,549 | 4,070 Scarlatina | 204 | 182 |
| 1869 | 21,835 | 16,363 | 4,165 | 3,269 | 191 | 149 |
| 1870 | 22,480 | 16,226 | 4,461 | 2,881 | 198 | 128 |
(+) Only Manchester plus Salford
Liverpool and West Derby
| Births | Burials | Under 1 Year | 1 to 4 Years | Per 1000 | Per 1000 | |
| 1838-1839 | 9,683 | 8,476 | 2,045 | 2,214 | 211 | 228 |
| 1839-1840 | 9,925 | 9,990 | 2,376 | 2,927 | 239 | 294 |
| 1841 | 10,805 | 9,758 | 2,449 | 2,528 | 226 | 234 |
| 1842 | 12,428 | 9,785 | 2,546 | 2,631 | 205 | 212 |
| 1843 | 12,756 | 9,767 | N/A | N/A | ||
| 1844 | 13,057 | 10,200 | N/A | N/A | ||
| 1845 | 14,273 | 9,929 | 2,607 | 2,407 | 182 | 168 |
| 1846 | 15,440 | 13,537 Typhus | 3,751 | 3,563 | 243 | 230 |
| 1847 | 15,469 | 21,570 Typhus | 3,628 | 4,048 | 234 | 261 |
| 1848 | 15,456 | 13,163 | 2,545 | 3,286 | 164 | 212 |
| 1849 | 14,237 | 18,700 Cholera | 3,458 | 3,960 | 242 | 278 |
| 1850 | 14,441 | 10,822 | 2,806 | 2,621 | 194 | 181 |
| 1851 | 14,815 | 12,550 | 3,107 | 3,217 | 210 | 217 |
| 1852 | 13,676 | 12,067 Epidemic Diarrhea | 3,282 | 3,167 | 240 | 231 |
| 1853 | 14,333 | 11,852 | 2,985 | 2,622 | 208 | 182 |
| 1854 | 15,666 | 14,797 Cholera | 3,539 | 3,952 | 226 | 252 |
| 1855 | 15,994 | 13,271 Cholera | 3,236 | 3,276 | 202 | 204 |
| 1856 | 16,539 | 12,363 | 3,192 | 3,114 | 192 | 188 |
| 1857 | 16,790 | 13,138 | 3,618 | 3,471 | 215 | 207 |
| 1858 | 16,734 | 14,781 | 3,605 | 3,489 | 215 | 208 |
| 1859 | 16,682 | 12,718 | 3,259 | 2,850 | 195 | 171 |
| 1860 | 16,246 | 13,206 | 2,896 | 2,377 | 178 | 146 |
| 1861 | 16,989 | 13,964 | 3,459 | 3,455 | 203 | 203 |
| 1862 | 19,222 | 14,747 | 3,413 | 3,867 | 178 | 201 |
| 1863 | 18,430 | 16,536 | 3,770 | 3,994 Scarlatina | 204 | 216 |
| 1864 | 21,029 | 18,562 | 4,545 | 3,648 | 216 | 173 |
| 1865 | 21,869 | 18,895 | 4,504 | 3,630 | 206 | 166 |
| 1866 | 21,585 | 22,250 Cholera | 4,892 | 5,341 | 226 | 244 |
| 1867 | 22,366 | 16,260 | 4,135 | 3,499 | 184 | 156 |
| 1868 | 22,192 | 16,785 | 4,521 | 3,573 | 203 | 161 |
| 1869 | 21,481 | 16,652 | 4,066 | 3,673 | 189 | 171 |
| 1870 | 22,052 | 18,386 | 4,636 | 4,150 | 210 | 189 |
The numbers of infant and child deaths below 5 years, shown here for 1838 to 1842, are somewhat higher than the figures for 1830 to 1837 shown above from the Bills of Mortality. The explanation is that the earlier figures do not include the babies who died before being baptised, and were not registered; the necessary adjustment was estimated at about 18 %.
Leeds, town and out-townships
| Births | Burials | Under 1 Year | 1 to 4 Years | Per 1000 | Per 1000 | |
| 1838- 1839 | 6,175 | 4,690 | 1,124 | 1,351 | 182 | 219 |
| 1839- 1840 | 6,664 | 4,203 | 1,029 | 1,006 | 154 | 151 |
| 1841 | 6,696 | 4,361 | 1,125 | 917 | 168 | 137 |
| 1842 | 6,376 | 4,612 | 1,254 | 1,055 | 197 | 165 |
| 1843 | 6,126 | 4,335 | N/A | N/A | ||
| 1844 | 6,584 | 4,124 | N/A | N/A | ||
| 1845 | 6,653 | 4,239 | 1,071 | 1,032 | 161 | 155 |
| 1846 | 6,882 | 4,529 | 1,376 | 958 | 199 | 139 |
| 1847 (*) | 6,325 | 5,693 Typhus | 1,343 | 1,404 | 212 | 222 |
| 1848 | 6,760 | 4,860 | 1,308 | 1,100 | 193 | 162 |
| 1849 | 6,612 | 7,274 Cholera | 1,387 | 1,221 | 209 | 184 |
| 1850 | 6,936 | 4,530 | 1,277 | 742 | 184 | 107 |
| 1851 | 7,232 | 5,477 | 1,511 | 1,126 | 214 | 156 |
| 1852 | 8,072 | 5,950 | 1,656 | 1,471 | 205 | 182 |
| 1853 | 7,686 | 5,009 | 1,450 | 783 | 189 | 101 |
| 1854 | 8,011 | 5,544 | 1,831 | 1,062 | 228 | 132 |
| 1855 | 8,114 | 5,594 | 1,343 | 1,168 | 165 | 144 |
| 1856 | 7,049 | 4,924 | 1,492 | 867 | 211 | 123 |
| 1857 | 8,208 | 5,360 | 1,528 | 1,035 | 186 | 126 |
| 1858 | 8,088 | 5,760 | 1,596 | 1,287 | 197 | 159 |
| 1859 | 8,366 | 5,401 | 1,483 | 1,106 | 177 | 132 |
| 1860 | 8,704 | 6,008 | 1,657 | 1,409 | 190 | 161 |
| 1861 | 8,733 | 6,217 | 1,569 | 1,035 | 180 | 119 |
| 1862 | 9,138 | 5,882 | 1,610 | 1,328 | 176 | 145 |
| 1863 | 9,350 | 7,052 | 1,873 | 1,697 Scarlatina | 200 | 181 |
| 1864 | 9,702 | 6,595 | 1,813 | 1,377 | 187 | 142 |
| 1865 | 10,418 | 7,314 | 2,117 | 1,613 | 203 | 154 |
| 1866 | 10,647 | 7,757 | 2,266 | 1,556 | 213 | 146 |
| 1867 | 10,981 | 6,571 | 2,053 | 1,097 | 187 | 100 |
| 1868 | 10,839 | 7,110 | 2,204 | 1,474 | 203 | 136 |
| 1869 | 10,774 | 7,309 | 2,134 | 1,289 | 198 | 120 |
| 1870 | 11,134 | 7,750 | 2,350 | 1,578 | 211 | 141 |


In the Manchester, Liverpool, and Leeds conurbations, we do not see any particular movement upwards or downwards (leaving out years of epidemic illnesses), which might reflect the worsening of the housing and sanitary situations.
The figures of infant mortality in England as an average were much lower than in other countries during the 19th century. The figures for Manchester and Liverpool, i.e. the worst cases in England, were about 210 in 1840, and decreased to about 175 in 1900. This means that the average in Germany was higher than Manchester and Liverpool throughout the nineteenth century. The data shown for each country are averages of rural and urban areas; since industrialization did not start until 1830 on the European mainland, we can suppose that the figures correspond in a large proportion to agricultural communities and small towns. Thus the high figures (from our point of view) from industrial towns in England, are lower than those from agricultural areas in all the other countries.

(Gehrmann, 2011, pp. 839-869, Graph 3
We have data for each county from 1841:
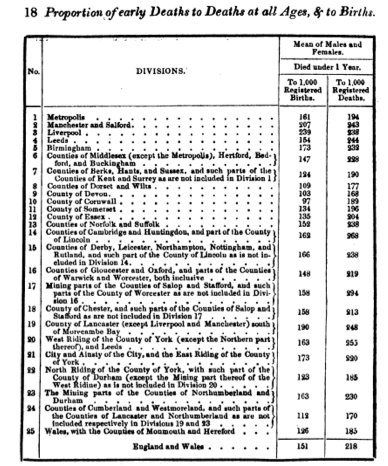
(Registrar-General, Annual Report of Marriages, Births and Deaths, 1841, p. 18)
Clearly the industrial counties had a higher rate of infant mortality than the agricultural counties (data referring to 1845-54):
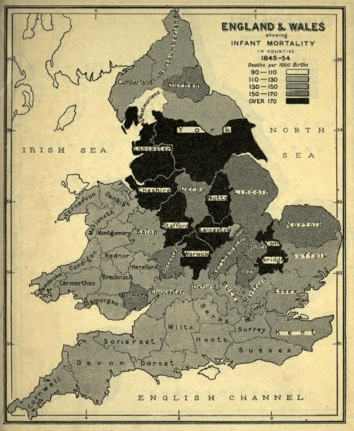
(Newman, 1902, p. 23)
A large part of the high figure for industrial towns was due to the impossibility of the working mothers to care for their children, or to give them milk or enough other food. The causes given in the death certificates, or in general information from doctors, were “diarrhea, convulsions, atrophy, measles”, but as Dr. Farr comments, these illnesses were “inseparable from bad nursing and feeding”.
The employment of women in industrial work, and particularly in the textile factories, had a number of bad effects on the care of their small children:
- The women, who worked ten hours a day in the factories, in general in a standing position, left their work only 15 days before the birth, and took it up again about 30 days after the birth; this obviously was a great stress on the body of the woman, and of the baby;
- As the women worked 10 days a day, they were only a few hours in the house, where they could look after the baby, and give it breast milk;
- The little children were often given to small daughters of the mother, or to minders, to look after the children;
- The food given to the babies was of bad quality;
- A number of small children were given calming liquids with an opiate base (“Godfrey’s Cordial” was the favourite), which in some cases caused the death of the child;
- The mothers often did not know how to look after children, or indeed how to do household work, as their own mothers – who had passed through these experiences – were not able to give them advice.
“The great mortality among children under 2 years of age is not directly chargeable to the factory system. The mortality between 1 and 2 is greater in Birmingham than in Manchester, for those are the two places especially contrasted. To what cause, therefore, may it be attributed? To no one in particular. The manners and habits of the people have much to do with it. That some localities are less healthy than others there can be no doubt. The most plausible reason which I can find is, not that the youths die in factories, but that the very young children are, under the existing system, not sufficiently taken care of by the mothers – both as regards themselves during gestation, and their offspring during childbirth. The women, during pregnancy, continue as long as possible at their work, and after child-birth return to it sooner than they ought, leaving their infants to the care of ill-paid and unsuitable persons. Nor ought we to omit, that soothing drugs, such as the well-known nostrum, Godfrey’s Cordial, are often had recourse to, with a view to ease the pains and to quiet the restlessness of infants; and it is perhaps to this improper use of narcotics that the frequent deaths from convulsions may be attributed. However desirable it may be, on other grounds, to regulate the labour of youths in factories, it is still more expedient, that mothers should not, if possible, be abstracted from attention to their helpless infants, particularly during the periods of lactation and teething.»
(Johns, 1840, pp. 195-6)
“Factory women soon return to labour after their confinement. The longest time mentioned as the average period of the absence from work in consequence of child-bearing was five or six weeks; many women among the highest class of operatives in Birmingham acknowledged to having generally returned to their work at the expiration of a month (*). And it was stated that the factory women even sometimes return to work as early as eight or ten days or a fortnight after confinement. The mother’s health suffers in consequence of this early return to labour, especially if, as is often the case, it is carried on in a standing position; and the influence on the health and mortality of children is most baneful … Mothers employed in factories are, save during the dinner hours, absent from home all day long, and the care of their infants is entrusted either to young children, to hired nurse-girls, sometimes not more than eight or ten years of age, or perhaps more commonly to elderly women, who eke out a livelihood by taking infants to nurse. Young girls, aged seven or eight years, are frequently removed from school for the purpose of taking charge of younger children while the mother is absent at work, and are sometimes said to return, on the death of the child, evidently rather pleased that the event has released them from their toil …. Pap, made of bread and water, and sweetened with sugar or treacle, is the sort of nourishment usually given during the mother’s absence, even to infants of a very tender age: and in several instances little children not more than six or seven years old were seen preparing and feeding babies with this food, which in such cases consisted only of lumps of bread floating in sweetened water …. Illness is the natural consequence of this unnatural mode of feeding infants ….. Children who are healthy at birth rapidly dwindle under the system of mismanagement, fall into bad health, and become uneasy, restless, and fractious. To remedy the illness caused by mismanagement various domestic medicines are administered, more particularly some kind of opiate such as Godfrey’s cordial or laudanum. Wine, gin, peppermint, and other stimulants are often given, for the purpose, it is alleged, of relieving flatulence, the actual effect being, however, rather to stupefy the child. The quantity of opiates sold for the purpose of being administered to infants in some of the manufacturing towns is very large … Indeed, there seems to be no doubt that the habitual administering of opiates to infants must be included among the causes of a high infantile mortality in certain manufacturing towns, not only on account of an overdose being given, but also because infants kept in a state of continued narcotism will be thereby rendered disinclined for food and be but imperfectly nourished. …. Parents who thus entrust the management of their children so largely to strangers become more or less careless and indifferent about them, and as many of these children die, the mothers become familiarized with the fact, and speak of the deaths of their children with a degree of nonchalance rarely met with among women who devote themselves to the care of their offspring … Abundant proof of the large mortality among the children of female factory operatives was obtained during the enquiry. An operative of the better class in Birmingham reported that he collects money for the expenses attendant on the deaths of children among the workers in a factory where 150 women are employed, and that he believed that ten out of every twelve children born to the married women in this factory died within a few months after birth. Many married women were questioned, as opportunity served, in the several factories visited, regarding their families, the number of children they had borne, the number that survived, and the manner in which they were brought up. The evidence of those women tallied exactly with that of other persons …. It was frequently found that two-thirds or three-quarters of the children borne to those women had died in infancy.”
(Sir John Simon, Fourth Report of the Medical Officer of the Privy Council, 1861, pp. 187-196; quoted in Newman, 1907, pp. 95-96)
(*) The wives in the better paid class of workers, in Birmingham, in 1861, could not interrupt their earnings for more than 6 weeks. This gives a different point of view as to the apparently good financial position of the families where both the father and the mother worked.
Dr. Newman shows in a number of pages that the infant mortality rate is highest in the manufacturing towns with the highest percentage of adult women working in the mills (see the whole chapter “The Occupation of Women” in his book). There was also an effect in some agricultural regions, when the adult women took up hard manual work in the fields; there was an identifiable increase in infant mortality in parts of East Riding, Cambridgeshire, and Norfolk, exactly due to this cause. The same differentiation between factory employment and rural employment was observed by the German health authorities in the later years of the nineteenth century.
The effect of mothers’ employment in the mills is shown in a rather gruesome manner by the effects of the Lancashire Cotton Famine of 1862-65, in which the death rates for adults increased, but the death rates for children decreased, exactly because the mothers had time to look after their children in the house.
“…. At the crisis of the famine the mills in Lancashire were not working more than half time, and in December, 1862, 247,000 cotton operatives were out of employment, and 165,000 others only partially employed. Twenty-four per cent. of the total population in the affected districts were in receipt of charitable relief. The result of the privation existing was an increase in the general death rate, whereas the infant mortality declined. In Lancashire in 1861 the infant death rate was 184, but in 1862 it fell to 168, rising gradually again to 200 in 1866. In England and Wales in the same period it fell to 142 (in 1862), rising again to 160 in 1865-66. For Coventry, too, owing to trade depression, in 1861 there was a decline in infant mortality, which led the Registrar-General to remark that “the care of the mothers of Coventry has, it would seem, counteracted some of the effects of privation, so that neglect of their homes by mothers at work in factories is apparently more fatal than starvation.” A somewhat similar condition of things has been found to prevail at Macclesfield when the silk mills are closed or working part time. During the siege of Paris (1870-71) also it is alleged that while the general mortality was doubled, the infant mortality fell 40 per cent. The interpretation of these facts is believed to be that in times of trade depression the women stop at home, and tend and suckle their infants more than in times of prosperity.”
(Newman, 1907, p. 227)
“Cotton Famine and mortality in Lancashire 1862. A few of the registrars witnessing a reduction of the mortality with the distress that prevailed in their districts at the same time have been tempted to speculate on the facts, and as those officers are in frequent communication with the labouring classes their opinions may be quoted. The registrar of Wigan states that more freedom to breathe the fresh air, inability to indulge in spirituous liquors, and better nursing of children, are believed to have improved the public health. The registrar of Little Bolton holds that the decrease of deaths is mainly due to a greater amount of domestic superintendence. The registrar of Hulme thinks that the even temperature of the weather and increased attention paid to young children have caused the decrease. The registrar of Knott Lanes (Ashton) attributes the result to absence of epidemics, mildness of the weather out-door exercise, maternal care; also to parish relief and charitable contributions, by means of which food has been obtained not sufficient for health but enough to mitigate distress and prevent hitherto an increase of mortality. The registrar of Preston sub-district also refers to the good effect of fresh air, nursing, and mildness of the weather, and he adds: “In the weeks ending August 2nd, 9th, 16th, 23rd, and 30th, I registered 30, 25, 29, 24, and 37 deaths, but in the corresponding weeks in 1861 when work was more plentiful and people in better circumstances they were 50, 40, 50, 42, and 57. The peaceful and dignified conduct of the operatives entitles them to the warmest sympathy and support of all classes.” The registrar of Ancoats (Manchester) is convinced that the low rate of mortality in his sub-district was due to the coldness of the summer, in consequence of which diarrhea did not prevail.”
(Farr, 1885, p. 141)
Thus we are fairly clear that the lack of maternal care was the most important factor in infantile mortality in the manufacturing towns. Possibly the next most important cause would be the extremely bad sanitation. But the question is, what was the proportion caused by lack of maternal care? We can inspect the per mille rates for a number of counties:
Infant Mortality in England and Wales
| 1845-1854 | 1871-1880 | 1881-1890 | 1891-1900 | 1901-1905 | |
| Lancashire | 193 | 172 | 166 | 179 | 163 |
| West Riding | 174 | 166 | 156 | 164 | 154 |
| Staffordshire | 180 | 159 | 156 | 172 | 151 |
| Derby | 153 | 141 | 134 | 146 | 136 |
| London | 157 | 158 | 152 | 160 | 139 |
| Kent | 132 | 124 | 116 | 129 | 119 |
| Devon | 119 | 125 | 120 | 131 | 118 |
| Oxfordshire | 145 | 128 | 112 | 113 | 98 |
| Wiltshire | 128 | 110 | 103 | 102 | 91 |
(Newman, 1907, p. 21)
And then calculate the “manufacturing county penalty”, subtracting from the figure of each county, the figure for Wiltshire:
| 1845-1854 | 1871-1880 | 1881-1890 | 1891-1900 | 1901-1905 | |
| Lancashire | 65 | 62 | 63 | 77 | 72 |
| West Riding | 46 | 56 | 53 | 62 | 63 |
| Staffordshire | 52 | 49 | 53 | 62 | 60 |
| Derby | 25 | 31 | 33 | 44 | 45 |
| London | 29 | 48 | 49 | 58 | 48 |
| Kent | 4 | 14 | 13 | 27 | 28 |
| Devon | -9 | 15 | 17 | 29 | 27 |
| Oxfordshire | 17 | 18 | 9 | 11 | 7 |
| Wiltshire |
We see that the infant mortality decreases in practically all the counties; the “manufacturing county penalty” of, for example, Lancashire or the West Riding, increases a little, but this is due to the fact that Wiltshire improves by 10 points from 1881-1890 to 1901-1905. This would appear to suggest that the different factors continue. But this is not the case. It is not the case that the sanitation problem continued with the same intensity up to 1905.
The British Government, through the mechanism of the Public Works Loan Board, spent 62 million pounds from 1845 to 1876 on water supply and sewerage in the large towns of the country (Ian Webster, The Public Works Loan Board 1817-76 and the Financing of Public Infrastructure, Doctoral Thesis, Sheffield Hallam University, 2015, http://shura.shu.ac.uk/9939/1/Public_works_loan_board_1817-76.pdf. Chapter 5, Failure and then Success: Water Supply and Sewerage, 1848-76). This, as we see from the table above, did not have any effect on reducing the infant mortality.
But, more specifically, there was infrastructure investment in Lancashire. This was the Public Works (Manufacturing Districts Act) of 1864, which was passed in order to give work to the starving workers in Lancashire in the Cotton Famine of 1862-1865. Up to February 1865, 1,850,000 pounds were spent by the Government, with the following positive results:
“…. The larger portion of the expenditure was on sewerage and street improvement works, including the formation, paving and flagging, channeling and kerb stones of streets, and also the widening, re-forming, and improvement of highways in the rural districts. The length of sewerage works thus undertaken, exclusive of house drainage, would be 534,445 yards, or about 304 miles. The area of paving and other works of street and highway improvement, undertaken in respect of the above-mentioned sum, was 3,708,393 square yards, or about 766 acres. The total length of the streets and highways was 485,560 yards, or nearly 276 miles. The cubical contents of the reservoirs, forming the storage of the water-works undertaken in respect of the sum of £ 414,629, were about 1,480,000,675 gallons; equal to about three-days flow of the river Thames in dry weather.
…….
One important result would be that the cottages [town and rural houses] of the working men throughout Lancashire would be very materially improved, in regard to the comfort and health of the occupants.”
[the quantities in the original text are expressed in words]
(Watts, 1866, pp. 328-329)
These improvements in sanitation also did not reduce the rates of infant mortality in Lancashire. We must therefore suppose that practically all the infant mortality in the manufacturing counties, above the “base level” of the agricultural counties, was caused by deficiencies in maternal care, due to the absence of the mothers in the factories.
This certainly is a “human cost” of the Industrial Revolution.
According to a table in the Registrar-General’s Report for 1871, the mortality of persons having the age of 0 to 5 years, did not change from the average of 1838-54 to the average of 1838-71.
Annual Mortality per cent of Males and Females in England and Wales
| Ages | Males 1838-54 (17 Years) | Males 1838-71 (34 Years) | Females 1838-54 (17 Years) | Females 1838-71 (34 Years) |
| All Ages | 2.33 | 2.33 | 2.17 | 2.15 |
| 0 to 5 | 7.25 | 7.26 | 6.23 | 6.27 |
| 5 to 10 | 0.92 | 0.87 | 0.91 | 0.85 |
| 10 to 15 | 0.52 | 0.49 | 0.54 | 0.50 |
| 15 to 25 | 0.82 | 0.78 | 0.85 | 0.80 |
| 25 to 35 | 1.00 | 0.99 | 1.06 | 1.01 |
| 35 to 45 | 1.28 | 1.30 | 1.27 | 1.23 |
| 45 to 55 | 1.85 | 1.85 | 1.59 | 1.59 |
| 55 to 65 | 3.18 | 3.20 | 2.82 | 2.80 |
| 65 to 75 | 6.69 | 6.71 | 6.00 | 5.89 |
| 75 to 85 | 14.76 | 14.71 | 13.44 | 13.43 |
| 85 to 95 | 30.14 | 30.55 | 27.92 | 27.95 |
| 95 & upwards | 44.03 | 44.11 | 43.22 | 43.04 |
(Thirty Fourth Annual Report of the Registrar-General, 1871, p. vi)
(The number “7.25” at the top of the first column is a calculation for one year, and is to be understood that 36.25 persons in the total of the age range “0 to 5” died.)
