The situation of the working class cannot be measured only as a comparison of the incomes and the costs of daily living of the people. On the one hand, in many cases the people had enough money to spend, above and beyond food, clothing and rent. These expenses might be for innocent enjoyment, for cultural improvement, for savings clubs and unemployment insurance, or for drinking.
On the other hand, there were many improvements in the daily life of the people, but which did not affect their individual monetary incomes. These were gas lighting, postage stamps, transport by rail, easier working conditions. This shows that the improvement in “standard of living” is more complex than the figure measured by their earnings.
HEIGHTS IN ENGLAND IN THE LATE EIGHTEENTH AND THE NINETEENTH CENTURIES
“It is a capital mistake to theorize before one has data. Insensibly one begins to twist facts to suit theories, instead of theories to suit facts.”
Sherlock Holmes, A Scandal in Bohemia, Arthur Conan Doyle
By far the longest-running difference of opinion about a historical process has been the “Question of the Condition of England”, that is, whether the population of England had an improvement or a deterioration in their living standards in the period of the Industrial Revolution from about 1770 to 1860. The expression “living standards” is taken to include, or more exactly to be the net effect of: wages, food consumption, working conditions, health, mortality, sanitation, and housing. But we cannot calculate the net effect of these factors, because we do not have objective time series of any of these before 1840; particularly this is true of wages and food, for which we have a few figures, but we do not know how to form an average value for all the classes and types of employments.
On the other hand, even if we had these series of numbers for each factor, we would not be able to quantify the net effect of these on the body or on the feelings of the persons. However, we may reasonably suppose that this net effect would be shown by movements in the heights of the people. This is the idea behind “anthropometrics”.
It might appear that there would be a definite effect in this sense, as a certain proportion of people (men, women, children and young children) had physical afflictions, were affected in their growth, did not eat enough, or were weak. On the other hand the people in the industrial districts had a higher income and ate more. The data about movements in heights might well help us to understand what was the effect of the Industrial Revolution.
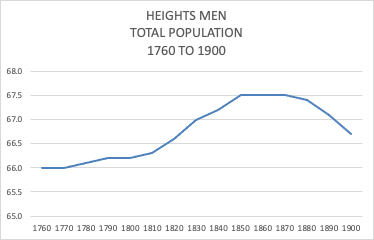
The main conclusions of this investigation are: – The average height of men in the period 1780-1820 was from 5 ft. 6.0 in. to 5 ft. 7.0 in., and in 1850-1880 was from 5 ft. 7.0 in. to 5 ft. 8.0 in.; – The men and women in the nineteenth century were not absolutely of low stature, but were of the same height as were adults at the time of the Second World War; – The yearly average heights of Army recruits in Great Britain cannot be used to estimate the heights of the general population, as they moved only as a function of war/peace situations, and of military-administrative decisions; – In the period of 1880 to 1900, there was a “slum class” with a stature of 4 inches less than the normal population, which may have reached 20 % of the city populations, and thus reduced the average height in the country by 0.8 inches.
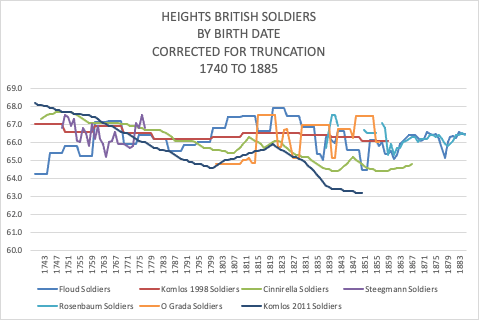
The general graph of male heights from 1760 to 1900 is as follows:
The detailed conclusions of this investigation are:
There was no “stunting” of men due to insufficient food or bad health conditions, but there were cases due to extreme work quantity in some occupations;
The first information about average heights of the working class (from 1882) states that the factory classes were about 1 ½ inches shorter than the average male, and that this was due to the fact that the machines did all the work, and thus the men had little physical exercise;
The average for women was from 5 ft. 2 in. to 5 ft. 3 in., also with little annual movement (but we have little data);
The boys and girls in the factories in the 1830’s were not stunted, but were of the same height as the children who did not work in factories, and the same height as those in Belgium (where there were few factories);
Skeletons from burial grounds from 1750 to 1850, and measured in archaeological excavations, have an average height per burial ground of 5 ft. 6 ½ in. to 5 ft. 7 ½ in.;
The average height for male convicts (incl. transportees to Australia) was from 5 ft. 5 in. to 5 ft. 6 in., with a minimum about 1830 to 1840 (birth year); the convicts were from 1 to 2 inches shorter than the general population, because they were typical of the working class;
The average height for women convicts was from 5 ft. 1 in. to 5 ft. 2 in., with the same minimum;
The men who went into the Army, were those who had problems of a personal sort, and were generally without hope of employment or food, that is, they were not “volunteers” in the usual sense of the term;
The Army usually had problems to find enough recruits in each year;
The average yearly heights of recruits in this period were from 5 ft. 5 in. to 5 ft. 8 in, but these were generally affected by one of: wars (high recruiting volume required, and thus abandonment of minimum height standards), movements in minimum height standards, payments of signing-on bonus, military budgets;
The average height for the totality of the “recruit-giving class” segment for the period 1800 to 1875 was close to 5 ft. 6 in., without any change over the years;
Data from the “Floud investigation” showing average heights of 5 ft. 8 in. to 5 ft. 10 in. for the years 1760 to 1800 are misleading and not useful, as they refer only to members of the Artillery, who were taller and stronger than the infantry;
In the years 1880 to 1899, the Army had great difficulty in finding recruits of the required height and strength, as they were receiving the majority of their recruits from slum areas.
A comparison with present height figures certainly is useful, as it does help to give an idea of the persons we would have seen «walking along the street». But if we wish to evaluate if the men were particularly short, due to their living and nutritional situation, we should use the year e.g. 1950 as a base point, and not 1990 or 2020. It is not the «fault» of the men of the 19th century, that there was a considerable improvement in nutrition and in health in the second half of the 20th century. The heights were/are: 1810 = 5 ft. 6 1/2 in., 1840-1880 = 5 ft. 7 1/2 in., 1950 = 5 ft. 7 in., 1990 = 5 ft. 8 in., 2020 = 5 ft. 9 1/2 in.
The definition of the World Health Organization for «stunting» is more than two standard deviations below the average of the general population at the given age». The only groups which might be in this case, would be the silk weavers in Spitalfields, the nail- and chain-makers in the Black Country, the framework knitters (hosiery) in the Midlands, and the slum dwellers in London and the Northern Industrial towns from the year 1880 onwards. The coal miners were short, but with a muscular torso.
It is important to note, when we are investigating if the bad living conditions in the country left a mark in the bodies of the people, that the Industrial Revolution did not start on a large scale in these terms, before 1800. Manchester had only 90,000 inhabitants, of which 13,000 worked in the cotton mills, and not all lived in bad accommodation. Leeds was still livable, there was little overcrowding; the population started increasing in 1820, and doubled by 1840. In Leeds, there was practically no spinning machinery before 1820. In Bradford, there was no spinning or weaving machinery before 1810, the year in which the first spinning frames were installed in buildings; the population of Bradford in 1811 was 60,000. In Birmingham, all the families lived each in a separate house, and there were no inhabited cellars.
Soldiers’ heights from regimental records, and analysis for anthropometric considerations.
There are academic investigations on the subject, but some of the conclusions have to be handled with care. The academic studies gather information about convicts and soldiers, as these were under the control of the authorities, and thus were long-term data about the heights. The registers of average annual heights taken from European armies give us dependable data for the average heights of the total male population, as practically the whole number of the population was called up each year; thus there was a continuity in the data as to stature which reflected changes in the real world in each country. In Great Britain, the recruits were “volunteers” (more exactly, they were usually unemployed men who needed a job that would give them food, bed, and guaranteed – although low – wages). They were only a small proportion of the population, and thus it is difficult to extrapolate to a figure for the whole population. Further, the number that applied each year, and the average height of these, was affected by the war/peace situation, and the state of the jobs market.
The other complication for the British Army recruits, is that the Army used “minimum height standards” to accept the men, and that these standards were changed from time to time. In Europe, these minima did not change much. Thus it is complicated to calculate consistent yearly average heights for the “recruit-giving class”, that is, the segment of the working class that would be interested in applying for the army, but including those above minimum heights and those below minimum heights, and those physically fit, and those not physically fit. As a final step, the adjusted heights for each year have to be regressed to the data of birth of each recruit, as the theory tells us, that the adult heights are a function of the wage, food, and sanitary conditions in early childhood.
The major study about British soldiers is that of Roderick Floud, Kenneth Wachter, and Annabel Gregory, published in 1990 (“Height, Health and History”), utilising a data base extracted from records of soldiers recruited to the British Army from 1760 to 1870. A great deal of work was expended on the collection and analysis of the registers. However, according to the analysis in the following pages, the yearly averages of statures at recruitment dates are strongly affected by decisions by the military authorities, and cannot be used to reconstruct the conditions at birth date.
The general intentions in using large data sources on soldiers’ heights, are to demonstrate the movements during a period, and investigate if the short periods of low stature correspond to times of hardship at the birth date, and if the long-term figures of heights show an increase or a decrease. The main data base used by the academics, is that of Floud, Wachter and Gregory, taken from the «description books»of soldiers enlisted in the British Army from 1760 to 1870.
The process was a) collect the soldiers by year of enlistment, b) correct the set of heights for truncation, caused by the minimum height standards, c) regress the data per soldier to his birth year, as we suppose that the factors that cause the differences in stature, come from the first years of life, d) calculate the average height of the men for each year of birth.
It is not possible to understand from the exposition in the 1990 book, how the basic recruitment data were transformed into the final numbers presented by the researchers:
the original real-world data, e.g. the average heights of the recruits per year and per age in the description books, were not exhibited; only the «processed» data after the correction for truncation, and assignation to the birth-year;
the average heights (after correction for truncation) were not exhibited per year, only per quinquennium or per decade;
the arithmetical process for truncation was not illustrated in examples;
there was no informations as to the differential effect of the correction, e.g. how much was the decrement in height, and how many figures of decades did not require the correction;
it was supposed that all the movements in the average heights were caused by the wages, food consumption, and sanitation and housing conditions in the childhood years of each recruit, and not by military decisions at the recruitment date;
it was supposed that the only necessary correction was that of compensation for the Minimum Height Standard, and not for peace/war conditions, urgency of recruitment, number of recruits required in the year, or bounty payments.
Unsurprisingly the academic investigations have not given consistent results:
SSTs
Floud Roderick Floud, Kenneth Wachter, Annabel Gregory; Height, Health and History, Nutritional Status in the United Kingdom, 1750-1980; 1990; Table 4.1, Mean heights of military recruits by age and date of birth, pp. 140-149 (includes Army and Royal Marines) (averages per quinquennium up to 1855) Here: age 22
Komlos 1998 John Komlos; Shrinking in a Growing Economy?, The Mystery of Physical Stature during the Industrial Revolution The Journal of Economic History, Vol. 58, No. 3(Sep. 1998), pp. 779-802; www.jstor.org/stable/2566624 Figure 2, Height of English Soldiers, 20-23 year olds, p. 781.
Cinnirella Francesco Cinnirella; Optimists or Pessimists?, a Reconsideration of Nutritional Status in Britain, 1740-1865; European Review of Economic History, December 2008 Figure 7, Average Height Trend in Britain, 1740-1865, p. 339, 18 year olds
Steegmann Theodore Steegmann; 18th Century Military Stature: Growth Cessation, Selective Recruiting, Secular Trends, Nutrition at Birth, Cold and Occupation; Human Biology, Vol. 57, No. 1, pp. 77-95 www.jstor.org/stable/41463634 Fig. 2, Mean stature for a cohort of mature men, according to year of birth, English and Irish soldiers of 21 years or older
Rosenbaum S. Rosenbaum and J. P. Crowdy; 100 Years of Heights and Weights, Journal of Research, Army Medical Corps, June 1992; www.jstor.org/stable/2982758 Table 1, Heights of Recruits (inches) 1860-1974, Age 20-24
Ó Grada Cormac Ó Grada and Joel Mokyr; Height and Health in the United Kingdom: Evidence from the East India Company Army, Working Papers 199407, School of Economics, University College Dublin, 1994
Komlos 2011 John Komlos and Helmut Küchenhoff; The Diminution of the Physical Stature of the English Male Population in the eighteenth Century; Cliometrica, 2012, 6; pp. 45-62 Fig. 5, Four estimates of the Height of Englishmen by Year of Birth, p. 54 (Average of Army and Royal Marines)
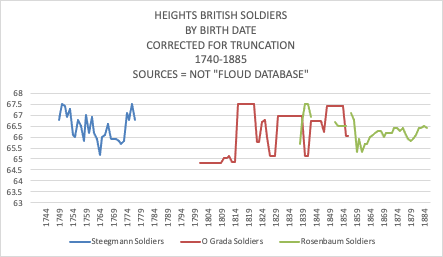
The “Floud”, “Komlos 1998”, “Cinderella”, and “Komlos 2011” lines all use the “Floud database”; the second and last reports come from the same investigator.
So we have to inspect the original data in the “Floud Database”.
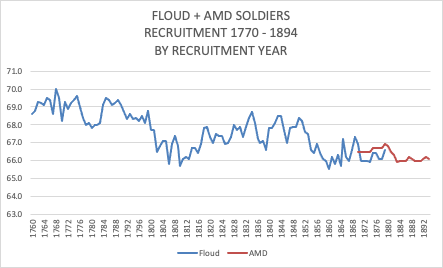
To attempt to understand how the four different graphs were formed out of the “Floud data”, it is necessary to present the original numbers from the collection of the “description books”. The following graph shows the totality of the registers referring to: British Army, not Irish born, not less than 18 years old. Total yearly numbers from the Army Medical Department reports for 1870 to 1894 are added.
We note average heights from 68 to 70 inches, for the period 1760 to 1799. They are doubtful for the following reasons:
a decrement of 2 inches in 40 years is considerable;
a fall of 2 inches from 1799 to 1802, in the heights of the men being enlisted, is not explicable, unless the laws had changed;
the heights given for the Royal Marines in the Floud data in this period, do not show this extreme movement;
there is no contemporary report, that the soldiers were extremely tall;
an investigation of heights of British-born soldiers in the War of American Independence (Komlos), gives 65.5 inches;
this is not congruent with the minimum height requirement of 64 inches from 1779;
male convicts had an average height of 66 inches in this period;
the only contemporary report of heights of a non-army group (Dorset Militia 1798/99) shows 66.5 inches.
Some academics consider that this large difference between “before 1800” and “after 1800”, demonstrates that the English population had sufficient food in the eighteenth century, but insufficient food in the first half of the nineteenth century.
The explanation appears to lie in the selection of the “description books” by Floud’s team.
The “description books” were bound pages, used by the administration of the British Army from 1760 to 1890, containing information – one page per soldier – with physical characteristics including the height at the date of enlistment. The books were the property of each regiment. They are now findable in the National Archives [although many are missing, or were never formulated]. For each decade, Floud’s team took the regiments that had description books for that decade, and took randomly one or some of the books, to transcribe the description to a computer system.
But in the National Archives, for the period 1760 to 1799, the only regiments with description books are those that are part of the Royal Artillery (revised in the “Search” function of the National Archives system, and kindly confirmed by the staff of the National Archives). So Floud’s team used only those description books (in Floud’s datafiles for those years, the column for the identification of the regiment has the value of “WO54”, which is the value in the organization of the National Archives for “Royal Artillery”).
But the root of the problem is that the soldiers in the Royal Artillery were “big guys”. Their job was to dismantle and rebuild the field guns, to transport them over difficult terrain, often without the help of horses, and to insert the shells into the mouth of the cannon. In the nineteenth century, their minimum height was 4 inches above that of the infantry, and the chest minimum was 2 inches above that of the infantry. “No minimum chest measurement was specified before 1860, when a minimum of 33 in. was given except in the case of the recruits for the Artillery whose minimum was fixed as high as 35 in. because the heavy work involved in manhandling pieces of ordnance was considered to require a greater vital capacity” (Lt. Col. Derek Levis, Royal Army Medical Corps, “The Progress in Public Health ….”, 1949, p. 133). “Ordnance Department: Recruits for this branch of the service ought to be powerful athletic men. The duties of the field, and even of the arsenal, are laborious and require great strength.” (Henry Marshall, Deputy Inspector-General of Army Hospitals, On the Enlisting …., 1840, pp. 52-53).
So we may assume that this is the reason that the data from 1760 to 1799 give much higher statures than for the following years.
How much was the difference? For the decades 1800’s and 1840’s, the Floud data files give the regiment key and the height in each case. In the 1800’s decade, the Artillery soldiers had an average height of 67.7 inches, and the non-Artillery had an average height of 66.1 inches. In the 1840’s decade, the Artillery soldiers had an average height of 69.1 inches, and the non-Artillery 67.5 inches. Thus we may suppose a difference of 1.5 inches.
So we recalculate the heights in the datafiles of 1760-1769, 1770-1779, 1780-1789, and 1790-1799, subtracting 1.5 inches from every position. For the datafile of 1800-1809, which has a mixture of Artillery and non-Artillery, we subtract 1.5 inches from only the Artillery positions.
This is the result:
REQUIRE TO EXPLAIN THE CONCEPT OF «TRUNCATION»
REQUIRE TO EXPLAIN THE ADJUSTMENT PROCEDURE
aaaa
We wish to use this information to have the best possible idea of what was the average height of that segment of the population, which decided to enlist as a soldier (or would have decided, if they had complied with the minimum height regulation). The clearest information is that of war years with large requirements for personnel, or with urgent needs for personnel, as in those circumstances the military authorities did not apply the minimum height regulations, and thus the men who were enlisted mirrored the distribution of heights in the totality of the working-class part of the population. Actually, we know that 20 % of the Army in the period 1800-1815 was under the minimum height.
From the graph above, we have the values of 66.0 inches in 1777-1782 (War of American Independence), 66.0 inches in 1791-1812 (Napoleonic Wars), 66.6 inches in 1837-1838 (Revolts in Upper Canada and in Lower Canada), and 66.0 inches in 1858 (end of the Crimean War plus the “Indian Mutiny”. We can suppose that the average in this segment of the population was 66 inches, continuously from 1776 to 1860. Note that this segment of the population was of those persons of the lower working class, who had some individual personal problem, which practically obliged them to join the Army.
The average statures in the period 1760-1775 were high, at 67 to 68 inches, as the minimum height requirement was 66.5 inches.
The period of the Revolts in Upper Canada and in Lower Canada in 1837-1838 illustrates the decrease in average heights of new recruits, when the military authorities urgently needed to increase the numbers of the military forces.
Year
Recruits (*)
Av. Height (**)
1834
3,700
68.7
1835
6,600
68.1
1836
6,900
67.2
1837
13,300
67.0
1838
22,000
67.1
1839
16,900
66.6
1840
14,800
67.8
1841
16,600
67.8
1842
13,000
68.1
ttt
(*) not including Artillery
(**) without correction for truncation
The statures in the 1840’s were high, because the authorities decided to recruit only a small number of soldiers, as they did not expect any wars. We know this, because they were taken by surprise by the outbreak of the Crimean War in 1853. There were nominally 70,000 soldiers in Britain, but this included soldiers in movement to and from overseas posting, infirm men, and untrained new recruits. It was with difficulty that 25,000 soldiers were found, who could be transported for action in the Black Sea area. Foreigners were found to fight as mercenaries, in the British German Legion, the British Italian Legion, and the British Swiss Legion (these were 14,000 men in total, but they did not actually engage in the hostilities). It was calculated at the beginning of the War, that 40,000 new recruits would be required. For this reason, the minimum height limits were disregarded, and the average heights of the new recruits decreased rapidly. The War ended in 1856.
This was then followed by the “Indian Mutiny” in 1857-59. This required a further increase in the “Establishment” (authorized total number of soldiers) of the Army. Thus the average heights of new recruits decreased further to 66 inches in 1859.
By an application of «Occam’s Razor», we see that it is not necessary to suppose that the heights of the men at their enlistment, was a function of the living conditions in their first few years of life.
Our first source is of the Dorset Militia Ballot List of 1798-99 (Jaadla et al., 2020). The Militia Ballot Lists collected the names, ages, heights, and family status of all adult males in each county. If the domestic Militia was made active – against a real risk of invasion from France – a ballot would be carried out to decide those men who would be enlisted.
The evidence that has survived in the case of Dorset, gives us all adult males 18 – 45 in half of the parishes. We have 6753 useful observations from 227 parishes; the total population of the county was about 95,000. The men who appear in the list are 3.0 % elite, 4.9 % lower middle class (clerks, merchants, dealers), 38.5 % skilled workers (makers, smiths, weavers), 8.8 % farmers and yeomen, 44.8 % unskilled workers (agricultural and general labourers).
The average height was 66.4 inches (168.7 cm.). The farmers were about 0.8 inch taller than the labourers. There is no reason to doubt that this sample is representative of the whole of England at that time.
(Jaadla, Hannaliis; Shaw-Taylor, Leigh; Davenport, Romola; Height and Health in late eighteenth-century England; Population Studies, A Journal of Demography, published online 29th September 2020)
Height
60
61
62
63
64
65
66
67
68
69
70
71
72
Total
Per cent
1.2
0.5
2.0
2.2
8.2
13.1
24.2
18.6
15.6
7.5
5.5
0.7
0.7
100.0
(The “inch column” for e.g. “64” shows the numbers of 63.5 inches to 64.5 inches)
AVERAGE HEIGHT 66.4 INS. (168.7 CMS.)
We now have some “innocent remarks”, which show that the “normal height” of men outside the manufacturing towns was 5 ft. 7 ins. to 5 ft. 8 ins.
“A recruiting officer testified that operatives were little adapted for military service, looked thin and nervous, and were frequently rejected by the surgeons. In Manchester he could hardly get men of 5 ft. 8 in.; they were usually only 5 ft. 6 in. to 7 in., whereas as in the agricultural districts, most of the recruits were 5 ft. 8 in.”
(Wing, Evils of the Factory System, 1837, p. cii; quoting the First Report of the Factories Inquiry Commission, 1833, Mr. Tufnell’s Evidence, p. 59)
“Their stature low – the average height of four hundred men, measured at different times, and at different places, being five feet six inches.”
(Gaskell, The Manufacturing Population of England, 1833, pp. 161-162)
Serjeant Buchan – Recruiting Serjeant: “The general height of men in this town [Birmingham] is 5 ft. 4 in. to 5 ft. 5 in. …. They are generally shorter than in any town he has known. … The countrymen from the neighbouring districts, are generally taller and stouter.”
(Children’s Employment Commission, Appendix to the Second Report of the Commissioners: Trades and Manufactures, 1843, part 1, p. f 170, interview 495)
In 1844, a Dr. John Hutchinson, who wished to test his new invention, a spirometer (for measuring the strength of the lungs), invited a number of people from different walks of life, to use the object. He registered their height and weight, as well as the measurement of the expulsion of the lungs.
(John Hutchinson, Surgeon, Lecture on Vital Statistics, The Lancet, Vol. 1, No. 19, June 1844, pp. 567-570)
The data as to heights were as follows:
Classes
less 5 0
5 0
5 1
5 2
5 3
5 4
5 5
5 6
5 7
5 8
5 9
5 10
5 11
6 0 more
Seamen
5
1
7
1
10
9
15
14
15
11
18
12
6
2
Fire Brigade
1
2
20
17
26
20
3
1
2
Metropolitan Police
4
33
46
22
13
12
11
Thames Police
1
6
9
9
15
17
10
5
3
Paupers
7
3
10
10
21
20
19
10
9
10
1
3
9
Mixed Class
1
1
5
5
17
16
20
20
28
16
14
7
9
14
Grenadier Guards
1
1
2
7
22
16
11
1
Compositors
3
2
5
6
7
5
8
6
3
Pressmen
1
2
8
3
7
1
4
2
Draymen
1
1
3
4
1
6
4
Gentlemen
1
1
7
9
14
10
18
16
8
12
5
5
Pugilists, &c.
1
2
1
4
3
3
1
2
3
5
2
Horse Guards (Blue)
30
26
Total
14
6
27
22
68
78
118
102
172
164
98
75
82
62
Average without Horse Guards, 5 ft. 7.3 in., average without Horse Guards, Metropolitan Police, Grenadier Guards, Gentlemen, 5 ft. 6.7 in.
Skeletons
The most objective evidence for the heights in the past, is that of skeletons, as they do not change in length, and are perfectly measurable (more exactly, the length of the femur is taken, and converted by a formula to the height of the person while alive).
We have a number of results from different Burial Grounds in England, from the second half of the eighteenth century and the first half of the nineteenth century.
The average stature for men from each case, ranges between 5 ft. 6 ½ in. to 5 ft. 7 ½ in. (leaving out two higher values from the “upper middle class” and “upper class”); for the women it is from 5 ft. 1 ½ in. to 5 ft. 3 in.
Church
Place
Period
Context
Social class
Adults number
Males height ins.
Males height cms.
Females height ins.
Females height cms.
N
Lancashire
19th Century
Urban
N
311
66.4
168.7
62.2
158
(Excavation 2020-2021, Personal communication)
Church
Place
Period
Context
Social class
Adults number
Males height ins.
Males height cms.
Females height ins.
Females height cms.
Quaker Church, Coach Lane
N. Shields
1711-1857
Urban
Low and Middle
154
66.5
169
61.8
157
St. Hilda, Coronation St.
S. Shields
1816-1855
Urban
Working Class
114
67.7
172
62.3
159
Chelsea Old Church
London
1712-1842
Sub-urban
Higher Class
165
66.1
168
64.2
163
St. Benet Sherehog
City of London
<1853
Urban
Middle Class
166
66.9
170
63.0
160
Bow Baptist
Outskirts London
1816-1856
Sub-Urban
Middle Class
214
66.9
170
62.2
158
Cross Bones
Southwark
1800-1853
Urban
Pauper
44
66.7
169
63.0
160
(Newman, Sophie Louise; The Growth of a Nation: Child Development in the Industrial Revolution in England, c. AD 1750-1850; Doctoral Thesis, Durham University, 2016; Figure 6.4., p. 246)
Church
Place
Period
Context
Social class
Adults Number
Males height ins.
Males height cms.
Females height ins.
Females height cms.
St. Bride’s, Lower Cemetery
Farringdon Street London
1770-1849
Urban
Workhouse and Prison
125
66.5
169
63.2
160.5
St. Pancras Old Church
Camden London
1793-1854
Urban
Outside Metropolis, Immigrants Refugees
448
67.3
171
61.8
157
St. Mary-le-bone
West- minster
1773-1850
Urban
High Status
138
66.9
170
62.6
159
Museum of London > Wellcome Osteological Database > Post-Medieval Cemeteries
Church
Place
Period
Context
Social class
Adults Number
Males height ins.
Males height cms.
Females height ins.
Females height cms.
St. Peter-le-Bailey, Bonn Square
Oxford
1726-1855
County town
Poor and paupers
120
67.7
172
62.2
158
St. Luke’s
Islington
1760-1850
Suburb London
Upper working class
533
66.9
170
62.2
158
Infirmary
Newcastle
1745-1845
County town
Poor working class
N
67.3
171
63.0
160
St. Bartholo- mew’s
Penn, nr. Wolver-hampton
1664-1818
Country town
Upper middle class
202
68.9
175
63.0
160
St. Nicholas
Sevenoaks
1550-1875
Country town
Middle class
116
68.1
173
63.4
161
St. George’s (crypt)
Bloomsbury
1800-1856
Inner London
Upper middle class
111
67.7
172
63.0
160
Christ Church
Spitalfields
1729-1852
Inner London
Masters, weavers, traders
623
66.5
169
61.4
156
Quaker Burial Ground, London Road
Kingston-upon-Thames
1664-1818
Country town
Quakers
295
66.5
169
63.0
160
(Helen Webb and Andrew Norton, The Medieval and Post-medieval Graveyard of St. Peter-le-Bailey, at Bonn Square, Oxford, Oxoniensia 2009, Oxford Architectural and Historical Society, pp. 137 et seq., Excavation in 2008.
Angela Boyle, Ceridwen Boston, and Annsofie Witken, The Archaeological Experience at St. Luke’s Church, Old Street, Islington, Oxford Archaeology, 2005, Table 5.21.
Other sites taken from this above source, Table 5.21 and pp. 205-7)
John Beddoe was a Fellow of the Royal Society, and President of the Royal Anthropological Institute from 1889 to 1891.
In 1870 carried out a survey of the whole of the United Kingdom, through a system of written questionnaires, which he sent out to a large number of academic contacts and administrative persons in the country. The responses that he reports in his book, refer to all classes of persons, except the rich and the professions, and the destitute and unemployed, and to many types of occupation. But exclusively men! In general from 25 to 49 years old. The total of men documented in the book was 8,583. The number with complete data was 3,498.
They are presented as one line for each reply from a «coordinator» about a group of persons, for example «agricultural labourers in the neighborhood of Hull». Each line may refer to from 10 to 100 men. Returns for «recruits», «lunatics», and «convicts» are given in separate sections.
Under 5 ft. 6 in.
5 ft. 6 in. to 5 ft. 7 in.
5 ft. 7 in. to 5 ft. 8 in.
5 ft. 8 in. to 5 ft. 9 in.
Above 5 ft. 9 in.
Average
Normal
14
76
82
47
20
5 ft. 7.4 in.
Criminals
19
10
1
5 ft. 5.7 in.
Recruits
10
13
5 ft. 7.0 in.
Compilation of data, per report line (here: only England), made by this author.
Some years ago, James Riley was able to access (in the University of Bristol), the original reports which had been received by Dr. Beddoe.
He was able to carry out analyses of the data in different dimensions. The distribution by occupations was as below, showing a larger proportion of working class than in other contemporary estimates (this would mean that Beddoe’s value of the average might have been a little low). We note that the workers in manufacturing are the shortest.
Mr. Riley’s calculation – using Dr. Beddoe’s sample – of the average height in the population of England and Wales in 1870 was 66.9 inches (169.9 cm.).
He also plotted the heights against the ages:
We see that the height practically does not change with age. But we are processing men with an age of 23 to 50 years, in which period the height of the man does not change. This then means that the average of the final heights of men through the period 1841 to 1866 (born 1817 to 1841) did not change.
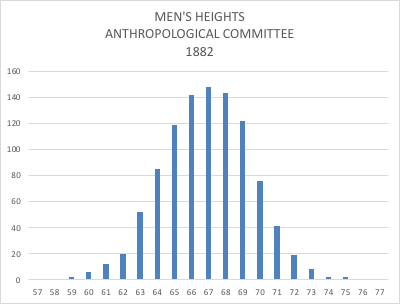
Report of the Anthropomorphic Committee of the British Association for the Advancement of Science (1879 and 1883)
This was a collection of data from a) the Beddoe survey, b) the investigation of Dr. Roberts about Factory Children (1876), and an own survey. In total, these were about 53,000 individuals of all classes, all ages (including children), and both sexes. The total of adult males of the United Kingdom was 8,585, and the adult males in England only was 6,194.
Heights
58
59
60
61
62
63
64
65
66
67
68
69
70
71
72
73
74
75
Per mille
1
2
6
12
20
52
85
119
142
148
143
122
76
41
19
8
2
2
AVERAGE HEIGHT = 67.4 INCHES (171.2 CMS.)
There is a table in the report which show the heights of the men in the report, detailed according to the age of the men in approx. 1880. This allows us to say, for example, that the men of age 29, who were born in 1851 and were 20 years old in 1871, had an average height of 67.9 inches in 1871. Thus we may take it as a reasonable assumption, that referring to all the men of 20 years old, who were alive in the country in 1871, they had an average height of 67.9 inches. 20 years was the age at which the men attained their maximum height, which generally they maintained until 60 years old.
So we can suppose that the average height of men of from 20 to 60 years old, was from 67.5 to 68.0 inches in the period 1840 to 1880.
Age 1880
20th Birthyear
Height inches
20
1880
67.5
21
1879
67.6
22
1878
67.7
23
1877
67.5
24
1876
67.7
25
1875
67.7
26
1874
67.8
27
1873
67.9
28
1872
67.7
29
1871
67.9
30-35
1865-1870
68.1
35-40
1860-1865
68.0
40-50
1850-1860
68.0
50-60
1840-1850
67.9
Table XVI, p. 290, and Table XX, p. 294
There was a considerable differentiation in heights in the different counties of the British Isles:
Anthropomorphic Committee 1882, Map no. 1, Plate I.
We return to the point at the beginning of this document, that the high value for the men’s stature in our days, is due to the increases since the end of the Second World War; these were caused by considerable improvements in medicine and health care (National Health Service), monetary income, and food consumption. The average height of men in the general population was a little more than 5 ft. 7 in. This means that the average height of men in the nineteenth century was the same as that of the men who fought in the Second World War. See the following studies:
W. F. F. Kemsley, “Weight and Height of a Population in 1943”, Annals of Human Genetics, 1950, 27,000 men and 33,000 women; men 20-24 67.0 in. (170.1 cm.); women 20-24 62.4 in. (158.5 cm.)
E. M. B. Clemens and Kathleen Pickett, “Stature and Weight of Men from England and Wales in 1941”, British Journal of Preventive and Social Medicine, 1957, study of 21,300 men measured by medical boards in 1941, previous to call-up; height of men in England 67.1 in. (170.4 cm.)
W. J. Martin “The Physique of Young Adult Males”, Medical Research Council, Memorandum No. 20, H. M. S. O. 1949, report of 91,000 men intended for Air Force 1939; 67.3 in. (170.9 cm.)
The report of the Anthropometric Committee also tells us the average height is clearly affected by the type of occupation, particularly that the factory workers were about 1 ½ inches shorter than the generality of the population.
This was generally commented at the time (together with the statement that town dwellers were shorter than rural inhabitants), for example:
“I have been informed that of those labourers now employed in the most important manufactories, whether natives or migrants to that town, the sons who are employed at the same work are generally inferior in stature to their parents.”
(Edwin Chadwick, Inquiry into the Sanitary Condition…., 1842, p. 185)
The working people in Manchester (not just the cotton workers) were well known to have a “shrunken” appearance, but this did not mean that they were physically weak.
“Of course the air in which they work exercises a marked effect upon the appearance of the people. This is a subject which I shall treat of at length later; but I may be here permitted to remark upon the more obvious physical characteristics of carders, spinners and weavers. In the first place I do not remember seeing one male or female adult to whom I would apply the epithet of a “stout “ man or woman. There is certainly no superfluity of flesh in the factories. When I say this I do not by any means intend to insinuate that the people are unhealthy or unnaturally lean; they are generally thin and spare but not emaciated. By such occupation as is afforded in the various branches of cotton spinning, much muscle cannot be expected to be developed. There is no demand for it – the toil does not require it – it would be useless if it existed. I cannot therefore term the appearance of the people “robust”. They present no indication of what is called “rude” health. They are spare, and generally – so far as I can judge – rather undersized. At the same time their appearance cannot rightly be called sickly. Their movements are quick and easy, with nothing at all of langour expressed either in face or limbs. The hue of the skin is the least favourable characteristic. It is a tallowy-yellow. The faces which surround you in a factory are, for the most part lively in character, but cadaverous and overspread by a sort of unpleasant greasy pallor. Now and then you observe a girl with some indications of roses in her cheeks, but these cases are clearly the exception to the rule; and amid the older and matronly women not a single exceptional case of the kind did I find. Altogether, the conclusion which a very careful examination of the people led me to was this, that the labour cannot be said to exercise a seriously stunting or withering effect upon those subjected to it – that it does, perhaps, make them actually ill, but that it does prevent the full development of form, and that it does keep under the highest development of health. Men and women appeared to be more or less in a negative sanitary condition. At any rate what is called the “bloom of health” is a flower requiring more air and sunshine than stirs and gleams athwart the rattling spindle.”
(Ginswick, Jules, Labour and the Poor in England and Wales 1849-1851, Letters to the Morning Chronicle from Correspondents, Vol. 1, Lancashire, Cheshire, Yorkshire, pp. 15-16, The Physical Appearance of the Factory Workers)
“It is perfectly true that the Manchester people have a sickly, pallid appearance; but this is certainly not attributable to factory labour, for two reasons: first, because those who do not work in factories are equally are equally pallid and unhealthy-looking, and the sick society returns show that the physical condition of the latter is not inferior:- secondly, because the health of those engaged in country cotton factories, which generally work longer than town ones, is not injured even in appearance … Mr. Wolstenholme, surgeon at Bolton, says that “the health of factory people is much better than their pallid appearance would indicate to any person not intimately with them.””
(Factories Inquiry Commission, Supplementary Report … as to the Employment of Children in Factories, 1834, Part I, Mr. Tufnell’s Report from Lancashire, p. 198)
The question is, how did it happen that the factory workers were shorter (but not to the degree of “stunted”) than the average of the population?
It was not due to insufficient food, because we know that the people in the Northern industrial towns ate a considerable amount of meat. It was not due to excesses in the physical human work required, because – at least from 1830 onwards – the work of pushing, cutting, winding, pulling, etc. was done by the machines, and the human being only had to supervise the work of the machines. It may have been partially due to the sanitary and epidemic problems in the towns.
The main reason was probably the low amount of physical bodily work required in the factories. As it says in the table above: “sedentary”. “The work appeared to us, like most of the labour in a cotton mill, to require very little muscular effort beyond that of standing and walking.» (Bridges and Holmes, 1873, p. 15)
a
Curiously, if the work in the factories had been at a level that the human frame had been used to for the previous 500 years, the average height of the manufacturing workers would have been more, and the male population might have been about ½ inch taller.
Women
The data from above referring to skeletons, give averages per burial ground of from 61.4 to 63.2 inches.
The Anthropometric Committee Report of 1883 gives an average height for women of 62.6 inches, but this is based on only 379 observations.
There was practically no movement in heights until the end of the Second World War. The average height of women in 1943 was 62.4 inches; see Kemsley (1950) above.
Children
We do have more surveys (actual measurement) of the heights of children during the nineteenth century. This is due to the fact that these data were required for the preparation of laws for the protection of the children, or as a basis for permission for individual boys or girls to work, as the laws proscribed the number of hours that could be worked, in terms of the age of the children.
As we noted at the beginning of this document, the World Health Organization definition of “stunting” is “height more than two standard deviations below the average height for the general population, at the given age”. This would be about three inches below the average in the case of children. The only children or young persons with employment below this level in the nineteenth century, were the nail- and chainmakers in the Black Country. There certainly were very poor children who lived on the streets, who were about this level. There were poor boys in London, who ate very badly, and many were covered in rags, and were cared for by the Maritime Society, to be enrolled in Royal Navy ships. In 1800 they had heights of 51 inches at age 13 (Floud, Wachter, 1982, p. 435). From about 1835, Industrial Schools were founded, which gave bed and food for children collected from the streets, and gave them school education and technical education. The average height of boys in the Industrial Schools in 1882 at 14 years, was 7 inches less than boys of the general population, and 24 lbs. less in weight (Anthropometric Commission, 1882-83, Table XXI, p. 296).
The first examination of heights of boys and girls was in 1833 in Manchester and Stockton, to check if the children in the cotton factories were particularly shorter than the children in other occupations. In the course of the first attempt to formulate a law for the protection of the children, in 1819, many doctors and professional persons in Lancashire had given evidence that the children were exceedingly overworked, that they were short and weak, that you could recognize a “factory child” at a distance by the stature of his/her body.
To the surprise of later investigators in 1833, the factory children were of exactly the same height as the non-factory children. It appears that the machinery had changed, such that there was less heavy work, and less distance to be walked per day in the workplace. Also the non-factory children would probably not be well fed, as many of them were the sons and daughters of domestic hand-loom weavers, who were at a very low level of incomes.
In any case, the average height of 4 feet for the 9-year olds is very low in our terms of today. The 9-year olds are 48 / 66 = 73 %, and the 11-year olds are 51 / 66 = 77 %, of the height of the father. The 9-year olds are of deficient weight, 51 lbs. against the 61 lbs. of the 11-year olds.
Leonard Ward, “The Effect, as shown by Statistics, of British Statutory Regulations directed to the Improvement of the Hygienic Conditions of Industrial Occupations”, Journal of the Royal Statistical Society, Vol. 68, No. 3 (Sep. 1903), pp. 435-525, https://www.jstor.org/stable/2339590
(Numbers rearranged by Mr. Ward)
Page 461
Mr. Leonard Horner was named Factory Inspector in the District of Lancashire, Cheshire, and Yorkshire in 1836. He did not like what he saw in the factories, as it appeared that the children were too small for the ages at which they were authorized to work. “In going through the factories in different parts of my district I was particularly struck with the diminutive size of many children who were working 12 hours, and, on calling for their certificates I found children certified to have the “ordinary strength and appearance” of 13 years of age who were manifestly to the most common observation, not more than 10 or 11. It was evident that has been either the most culpable negligence on the part of the surgeons, or that fraud had been very extensively practiced upon them under a false name, in order to obtain a certificate which was to be made use of by a younger child.” (Circular Letter to Surgeons, 20thSeptember 1836). What was happening, was that the parents wanted/needed the income from the child, who legally could not work under those circumstances, and so they gave false information.
Mr. Horner decided that he needed assured evidence as to the general range of heights for each age, so as to be able to define limits in terms of the height. He sent a circular letter to a number of doctors in his district, requiring them to collect a number of children in the mills, of whom there was no doubt as to their ages, and to report their heights. There were 72 doctors, who measured and reported on 16,400 boys and girls, in factory employment.
The results were as follows:
Years of Age
Number Males
Average Height
Number females
Average height
Ft. in.
Ft. in.
From 8 and under 9
666
3 10.2
539
3 9.5
From 9 and under 10
945
3 11.6
813
3 11.8
From 10 and under 11
1124
4 1.3
927
4 1.2
From 11 and under 12
1223
4 2.8
1055
4 2.7
From 12 and under 13
1427
4 3.7
1330
4 4.1
From 13 and under 14
2133
4 5.7
2240
4 5.8
From 14 and under 15
117
4 8.2
140
4 9.0
From 15 and under 16
82
4 10.5
106
4 10.7
From 16 and under 17
43
5 0.5
90
4 11.5
From 17 and under 18
47
5 0.0
112
5 0.0
(The age data were given in the publication, in divisions of half-years; the heights were given to the nearest eighth-inch)
Charles Knight (ed.), “Practical Application of Physiological Facts”, The Penny Magazine of the Society for the Diffusion of Useful Knowledge, Volume 6, 1837, pp. 270-272.
The heights in the two cases are very similar. But they do seem low to us at the present time. The question is: are these low statures a) those that had existed for (e.g.) the previous 50 years, or b) are they lower than they had been previously, due to the introduction to factory work?
We can compare these figures with those of the Belgian scientist, M. Quetelet, which he collected in Belgium in 1832 (see “A Treatise on Man and the Development ofhis Faculties”, English edition, 1835, p. 64). An inspection of the information as to Belgium gives: boy of 9 years 122.7 cm. (48.3 in.), boy of 11 years 132.7 cm. (52.2 in.), girl of 9 years 122.0 cm. (48.0 in.), girl of 11 years 127.5 (50.2 in.). The weights are: 24.1 kg. (53.1 lb.). 27.8 kg. (61.4 lb.), 22.4 kg. (49.5 lb.), 26.2 kg. (57.9 lb.). These figures – which are for the general child population of Belgium – are very close to those in the factories of the North of England. And Belgium at this time had very few factories. So we may suppose that these heights and weights were “normal” for the time.
The average height of men in Belgium was, according to M. Quetelet, at 30 years old, 168.4 cm. (66.3 in.), and of the women was 157.9 cm. (62.2 in.).
Dr. Bridges and Mr. Holmes were requested by the Local Government Board in 1873, to inspect the textile factories in all England, to give an opinion, if the hours of work should be reduced, and the ages of children authorized to work should be increased.
About 10,000 children were measured, and the results were as follows:
Table A: Factory Children of Factory Parents (Urban and Suburban)
Age
Boys
Girls
No.
Inches
No.
Inches
8
30
45.7
30
46.5
9
80
48.0
110
47.6
10
140
49.8
130
49.5
11
130
51.4
120
50.8
12
120
52.8
140
53.1
Table B: Children in Non-factory Districts (Urban and Rural)
Age
Boys
Girls
No.
Inches
No.
Inches
8
140
46.7
100
46.7
9
230
49.2
160
48.6
10
240
51.0
140
50.1
11
180
52.9
140
52.7
12
150
54.0
90
54.4
Table C: Non-factory Children of Non-factory Parents in Factory Districts (Urban and Suburban)
Age
Boys
Girls
No.
Inches
No.
Inches
8
20
46.7
20
47.4
9
60
49.1
30
49.4
10
50
51.0
30
49.8
11
30
52.6
30
52.8
12
20
53.6
17
53.4
Table D: Urban Factory Children (Irrespective of Parentage)
Age
Boys
Girls
No.
Inches
No.
Inches
8
109
46.8
89
46.5
9
235
48.3
269
47.9
10
361
49.6
314
50.0
11
284
51.4
292
51.6
12
316
52.6
312
52.7
Table E: Suburban Factory Children (Irrespective of Parentage)
Age
Boys
Girls
No.
Inches
No.
Inches
8
131
47.1
95
46.3
9
279
48.3
216
48.1
10
282
50.4
279
49.8
11
302
51.8
275
51.7
12
264
53.2
266
53.3
As is to be expected, the non-factory children are taller than the factory children.
“He was perfectly satisfied from close observation during the last ten years, in a situation which gave him the best opportunities of judging, that the children of the mill population were steadily, year by year, getting smaller and physically less capable of doing their work. If they asked him how that was he would tell them. In the first place, it was owing to a great extent to the intemperate habits of the parents transmitting feeble constitutions to the children; and in the next, to the mistaken manner in which the mill people feed their children. They brought them up on tea and coffee, instead of upon more substantial food. As an example: During the last month in the Great Bolton district, he had had to reject as many as 19 children simply because they had not the strength and development required by the Factory Act, and these numbers were steadily year by year increasing. Another evil he had noticed was that many young children of 12 years of age or thereabouts were beginning to learn to smoke, acquiring the habit from their fathers, and possibly from their mothers also. This was a condition of things which, in his mind, excited painful considerations. What was to become of the factory population if this physical degeneration went on?”
(Mr. Alderman Ferguson, Bolton, was also a Certifying Surgeon under the Acts; Bridges and Holmes, pp. 41-42)
The authors expressed themselves forcibly, that the absence of mothers in the mill, was the cause of the high death-rate of the small children.
Dr. Charles Roberts made a similar report in 1876, on one thousand boys and girls of each age; the principal information is:
Charles Roberts, The Physical Requirements of Factory Children, 1876
Age
Average Height Boys
Average Height Girls
8
46.9
46.5
9
49.0
48.4
10
50.6
49.9
11
52.1
51.7
12
53.8
53.2
13
55.0
“Physical Improvement or Degeneracy of the Population
Few statistics are in existence which help to throw light on this subject. It is generally believed that the population in the manufacturing towns of the North of England is rapidly degenerating, but a comparison of the measurements of stature and weight given in the Report of the Factory Commissioners in 1833, and in the Report to the Local Government Board on “Changes in Hours and Ages of Employment of Children and Young Persons in Textile Factories”, 1873, shows that this is not the case. On the contrary, an examination of Table XXIV, showing these measurements, indicates a slight but uniform increase in stature, and a very large increase in weight, at corresponding ages. The increase in weight amounts to a whole year’s gain, and a child of 9 years of age in 1873 weighed as much as one of 10 years in 1833, one of 10 years as much as one of 11, and one of 11 as much as one of 12 years in the two periods respectively.”
(Anthropometric Committee, 1882/83, p. 298)
STATURE
Boys
Boys
Girls
Girls
1833
1873
1833
1873
Age
No.
Inches
No.
Inches
Dif.
No.
Inches
No.
Inches
Dif.
9
17
48.1
126
48.3
+0.2
30
48.0
114
48.3
+0.3
10
48
49.8
256
49.8
0.0
41
49.6
201
50.3
+0.7
11
53
51.3
196
51.6
+0.3
51
51.1
174
51.2
+0.1
12
53
53.3
175
53.3
0.0
80
53.7
WEIGHT
Boys
Boys
Girls
Girls
1833
1873
1833
1873
Age
No.
Lbs.
No.
Lbs.
Dif.
No.
Lbs.
No.
Lbs.
Dif.
9
17
51.8
136
58.1
+6.3
30
51.3
137
55.9
+4.6
10
48
57.0
247
60.2
+3.2
41
54.8
179
60.6
+5.8
11
53
61.8
189
67.7
+5.9
63
59.7
180
65.4
+5.7
12
42
66.0
167
69.8
+3.8
80
66.1
Table XXIV – Showing the average Stature and Weight of Factory Children at an interval of 40 years, 1833-1873 (Stanway and Roberts). (But actually it is Stanway and Bridges/Holmes)
Boys
Boys
Girls
Girls
1833
1873
1833
1873
Age
No.
Inches
No.
Inches
Dif.
No.
Inches
No.
Inches
Dif.
9
41
48.6
60
49.1
+0.5
43
48.4
30
49.4
+1.0
10
28
50.6
50
51.0
+0.4
38
49.4
30
49.8
+0.4
11
25
51.0
30
52.6
+1.6
29
52.1
30
52.8
+0.7
12
20
53.0
20
53.6
+0.6
27
53.7
17
53.4
-0.3
Boys
Boys
Girls
Girls
1833
1873
1833
1873
Age
No.
Lbs.
No.
Lbs.
Dif.
No.
Lbs.
No.
Lbs.
Dif.
9
41
53.3
60
59.4
+6.1
43
50.4
30
57.8
+7.4
10
28
60.3
50
63.8
+3.5
38
54.4
30
60.8
+6.4
11
25
58.4
30
70.2
+11.8
29
61.1
30
69.0
+7.9
12
20
67.2
20
70.9
+3.7
27
66.1
17
70.5
+4.4
This shows that apparently the natural increase in the general child population from 1833 was 1873 was visible, but that there was a negative effect on the factory children.
The heights and weights of children of 11 years old showed the following progression during the century:
Date
Segment
Place
Investigator
Boys 11 yrs. Height ins.
Weight lbs.
Girls11 yrs. Height ins.
Weight lbs.
1833
Factory and non-Factory Children
Manchester and Stockport
Stanway, Cowell
51.2
60.7
51.5
60.2
1836
Factory Children
Lancashire, Cheshire, West Riding
Horner
50.8
50.7
1836
Factory Children
Leeds
Baker
50
50 ¼
1836
Factory Children
Preston
Harrison
50 ½
51 ¼
1876
Factory Districts
Lancashire, Cheshire, West Riding
Roberts
51.2
68.1
51.8
66.2
1878-82
Labouring Classes
Country
Anthrop. Committee
52.3
72.2
52.5
67.1
1878-82
Artisan Families
Towns
Anthrop. Committee
52.7
69.0
51.5
66.8
Extracted from:
M. N. Karn, Summary of Results of Investigations into the Height and Weight of Children of the British Working Classes during the last Hundred Years (1936)
The boys showed – similarly to the adult men – a considerable differentiation in stature in function of the social / economic level.
Average height, inches,11-12 years
All Observations
52.6
Public Schools
Country
55.0
Middle-class Schools
Upper Towns
53.8
Middle-class Schools
Lower Towns
53.7
Elementary Schools
Agricultural labourers Country
53.0
Elementary Schools
ArtisansTowns
52.6
Elementary Schools
Factories and Workshops Country
52.2
Elementary Schools
Factories and Workshops Towns
51.6
Military Asylums
51.2
Industrial Schools
50.0
Anthropomorphic Committee, 1882-1883, Table XIII: Table showing the Relative Statures of Boys of the age of 11 to 12 years, under different physical and social conditions of life.
Convicts
The above pieces of information about the heights of men, women, and children from the general population only refer to a few individual dates. This is because there was no continuous measurement of a group, year by year. So we cannot show a graph of heights per year, and cannot demonstrate a possible connection between average heights and the standard of living (income, food, sanitation) in some short periods.
There were two segments of the population, who were under the control of the authorities, and whose height was measured, when they came to the notice of the authorities. These were the convicts (those who were transported, and those who were incarcerated in the United Kingdom), and the enlisted soldiers.
In these cases, as we have figures of heights for the average of the segment at a given date (incarceration; enlistment), we can classify the heights by birth yearof the individual person, and then calculate an average height for all of the persons of the resultant year.
The absolute figures of the average heights of the convicts and of the soldiers are not the same as those of the general population, they are generally from 1 to 2 inches less. But we may assume that the movements in each of the segments “mirror” the movements for the general population (if we had them).
The idea behind this arithmetical process is that the external factors (economics, food, sanitation, epidemics) which could affect the final height of a person, would have occurred with respect to the person in the period from 0 to 15 years old. So hopefully we can identify changes in the external factors, through the movements in the average heights. This is the fundamental premise of “Anthropomorphic History”; see Bernard Harris, Anthropometric History and the Measurement of Wellbeing, Vienna Yearbook of Population Research, 19 (2021).
This analysis is all the more important for studies of the period 1770 to 1840, as we have no continuous yearly series of data about incomes or about food consumption per person, based on contemporary documentation.
The data for the convicts are from the records of the administration of the shipping of the convicts to Australia, from the records of the prison services, and from publications of the police. These data have been incorporated into an interconnected data base “The Digital Panopticon”, digitalpanopticon.org, constructed in the last twenty years by a group led by Barry Godfrey, Robert Shoemaker, Tim Hitchcock, Deborah Oxley and Hamish Maxwell Stewart. The academic investigations commented below have been made by researchers using the original registers of the authorities, or the Digital Panopticon.
The series of heights from the different researchers for the period in question, are as follows. We see that there is little movement from year to year, except that there is a small decrement around the birth years 1830 to 1850.
Nicholas Convicts M:
Stephen Nicholas and Richard H. Steckel; Heights and Living Standards of English Workers during the Early Years of Industrialization, 1770-1815; The Journal of Economic History, Vol. 51, No. 4 (Dec. 1991), pp. 937-957, p. 948, figure 3.
Jacob P. Weber; Patterns in British Height, 1770-1845; Term Paper, 2018, Berkeley; Figure 5, Long-term height trends, men and women, age 20-70, 5-year centered average; p. 5
Paul Johnson and Stephen Nicholas, 1992; Health and Welfare of Women in the United Kingdom, 1785-1920; In: Richard H. Steckel and Roderick Floud, Health and Welfare during Industrialization, 1997; Fig. 6.11. Rural and urban male and female criminal heights, ages 19-49, p. 222; Source: Alphabetical Register of Habitual Criminals
Extracted from the Digital Panopticon, by the present author, men ages 20-49.
Weber Convicts F:
Weber, Jacob P., 2018, op. cit.
Johnson Convicts F:
Johnson and Nicholas, 1992, op. cit.
Panopticon Convicts F:
Extracted from the Digital Panopticon, by the present author, women ages 20-49.
The convicts were about two inches shorter than the general population.
“An impression is often prevalent that the criminal population consists of persons of the greatest physical strength; but speaking from observation of the adult prisoners from the towns and convicts in the hulks, they are in general below the average standard of height.”
(Edwin Chadwick, Inquiry into the Sanitary Condition of the Labouring Population…, 1842, p. 202)
The men and women in the criminal registers came predominantly from London and the northern industrial towns.
Place of birth Men 1830
Place of birth Women 1830
Place of birth Men 1860
Place of birth Women 1860
Total England
327
Total England
116
Total England
1,005
Total England
167
London
100
London
24
London
386
London
35
Manchester
24
Manchester
10
Manchester
74
Manchester
25
Liverpool
30
Liverpool
8
Liverpool
56
Liverpool
21
Leeds
8
Leeds
1
Leeds
31
Leeds
6
Birmingham
21
Birmingham
11
Birmingham
66
Birmingham
4
Sheffield
1
Sheffield
3
Sheffield
21
Sheffield
10
Bristol
7
Bristol
4
Bristol
25
Bristol
1
Newcastle
8
Newcastle
2
Newcastle
13
Newcastle
1
Nottingham
7
Nottingham
2
Nottingham
29
Nottingham
5
Other
121
Other
51
Other
304
Other
59
We can say from the occupations given, that they work in industry. This would explain why they were shorter than the general population, because they came from factory occupations, and the factory workers were about 1 ½ inches shorter than the average of the country.
For the years 1834 to 1845, in England and Wales, there were about 25,000 offenses per year, of which about 20,000 were “offenses against property, committed without violence”.
(Porter, Progress of the Nation, 1847, p. 652)
About 75 % of the criminals in the given period were of ages from 16 to 40.
(Porter, op. cit., p. 655)
The percentages of literacy were:
Males
Females
Neither read nor write
32
37
Read only; or read and write imperfectly
55
57
Read and write well
9
4
Superior instruction
1
0
Instruction not ascertained
3
2
These are considerably less than the percentages for factory workers at that time.
The Rev. John Clay, chaplain of the prison at Preston, interviewed 1000 new prisoners from 1832 to 1837, asking them the reasons why they committed the crime; the results were:
Drunkenness (455), Want and Distress (76), Temptation (48), Neglect of Parents (6), Combination (11), Weak Intellects (8), Idleness and bad Company (88), Idleness and Ignorance (18), Confirmed bad Habits (38), Alleged Innocence; and various or uncertain Causes (252).
The major types of crime committed, changed from the first half to the second half of the 19thcentury:
Trials at the Old Bailey
Percentage 1835–1854
Percentage 1855–1913
Simple larceny
35.2
11.7
Stealing fromone’s master
14.7
4.6
Coining
5.2
11.7
Burglary
3.1
9.7
Fraud
2.4
10.3
Vickers, Ziebarth, 2016, p. 200
The persons committed to prison or to transportation were members of the lower class of workers, and were generally from London and the northern industrial towns. They would not have been of the same height of the generality of the population, but it is reasonable to suppose that their heights would have moved “in step” with those of the average of the population.
SOLDIERS
In reference to the question of whether the soldiers were representative of the general male population, as to their heights, the answer is a qualified «Yes»:
no one went to enter the army because it was a good option;
the men who presented themselves, all had some sort of problem, either personal or financial; many were unemployed at the moment of recruitment (especially the case from 1870 onwards);
the army solved their problems, because it gave them, wages, food and a bed, guaranteed for years;
the occupations were 60 % labourers, 15 % manufacturing artisans, 18 % carpenters, smiths, weavers, etc. (but very few factory workers).
The main difficulty in using the data of the heights of these men during the whole of the period, is that there was a differentiation in the army recruitment policies, in times of war and in times of peace. In peacetime, the army could be stringent about the minimum height standard, because they did not need many additional soldiers; in wartime, they took everyone, and thus in this case, the heights of the recruits corresponded closely to the profile of the general population.
This means that in the war years the histogram of heights was that of the standard distribution curve. In years of peace the distribution curve was missing a part or the whole of the “left wing”, and so the average height of the men effectively recruited was higher than the average height of the segment of men who wished to enter the army. The different procedures for correcting this have caused grave contradictions between the different investigations.
In the Annex we can see a simple form of calculation to approximate the real average for the underlying segment. This calculates an adjustment in each decade. Six of fifteen decades have perfect histograms and thus do not need any adjustment. The maximum adjustment calculated for a decade is minus 1.3 inches.
The average heights at recruitment date are from 5 ft. 6 ins. to 5 ft. 7 1/2 ins. These would be a little less than the average of the men “walking along the street”, because about 50 % of the recruits entered at 18 to 22 years old, and they would still be about one inch shorter than at the average age of the population.
The men who went to the Recruiting Office (or to the public house, where the Recruiting Sergeants were generally stationed!), went because they had problems, and the army could solve them:
«Class of the population from which recruits are procured:
Agricultural labourers generally enter the army in consequence of some family difficulty or discord, or some scrape in which they are involved, or from want of work; and it is alleged by competent authority that they become the most trustworthy soldiers. Recruits who are enlisted in the manufacturing districts or the large towns are frequently idle and dissolute, and require all the means in the power of their officers to correct the intemperate and vicious habits in which they have indulged, and to enforce subordination.»
“The condition of a soldier is very little calculated to induce an industrious man, who can obtain subsistence in other way, to embrace it; consequently, those who enter the service are commonly thoughtless youths, petty delinquents, men of indolent habits, persons who are unable to procure work, or are in very indigent circumstances……. Experience holds out no hope, that, under existing circumstances, any but the worst educated, and certainly not the best conducted, of the manual labour rank of the population, will deliberately make choice of a military profession.”
(Marshall, p. 8)
“On looking into the matter, very serious doubts arose whether any one ever enlisted into the Army for the purpose of making it a regular profession for life. He found that there were some classes of their recruits who had readily gone into the ranks, not with any view to the future, but rather with a view of escaping present distress. Their ranks were very much recruited by the idle and the dissolute, who thought that in the life of a soldier they would find that idleness and dissipation congenial to their dispositions. It was too often the case, that the prodigal sought in the Army a refuge from his improvidence; and lads who had got into disgrace, immediately had recourse to enlistment in order in order to avoid their masters. With that class voluntary enlistment was at an end.”
(Mr. Fox Maule, M. P., The Army Service Bill, Hansard, House of Commons, 22 March 1847, vol. 91, p. 273)
“In 1859, the Adjutant-General of the Army told a Royal Commission on Recruiting that there were “very few men who enlisted for the love of being a soldier: it is a very rare exception”. Seven years later his successor told another Royal Commission: “I am afraid it is drink and being hard up which leads a great many to enlist”. Recruiting Sergeant William Knibbs of the 17th Lancers found that of the many hundreds of recruits he had enlisted between 1851 and 1859, “not one in fifty has money in his pocket when he comes to us – and then I must ask him, “have you a bed to go to?” “No.” “Well, I will find you a bed.” Sometimes I must find him his food.”
(Marquess of Anglesey, 1975, p. 260)
So we see that the Army was not really a part of the labour market, but in fact a form of social support for the unemployed / unemployable. Rather like the workhouse.
It was usually understood, that a new recruit would put on about 7 pounds weight in the first six months, due to the food and the exercise. This means that the Body Mass Index, if calculated with the initial weight, has to be adjusted in each case.
The disadvantages of life in the army were: the long contract term (up to 1835, 21 years; afterwards, 12 years); for those who were stationed in India this would be a long time without seeing their family; possibility of death in battle; possibility of death from disease in the Tropics; military discipline.
The advantages of life in the army, for this class of men, were: food (3/4 pound of meat and one pound of bread per day), bed, clothing (uniform), wages of one shilling a day, medical care, comradeship.
The health of recruits (i.e. those effectively accepted) was in general bad. The investigation of Mitchell (2006) analyzes a document of the Household Cavalry Museum: “Royal Horse Guards Vaccinations and Inspection of Recruits 1817-1851”.
The Household Cavalry in general had a good level of recruits, who had to be above 5 ft. 11 ins., and usually came from the artisan and skilled labour class. But the men who presented themselves were usually thin. For example, the instruction was that a man of 20 years old, had to weigh over 132 lbs. to be accepted. Many of the accepted recruits were described as “malnourished”, “emaciated”, or “of a feeble constitution.»
For a visual idea of the soldiers in the 1840’s, see YouTube “Earliest photographs of British soldiers from the 1840’s”:
a
A sergeant reading the Order of the Day to soldiers of the 42nd (Highland) Regiment of Foot, Edinburgh Castle, April 9th, 1846. Hill and Adamson.
aAnd from the 1850’s, photos of the Crimean War:
aThe 3rd (East Kent) Regiment (The Buffs) in the Crimea, 1855.
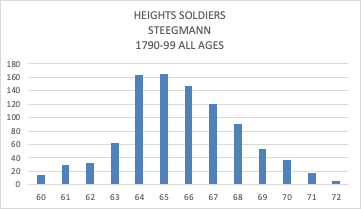
The first investigation of heights is from Steegmann (1985). It is an analysis of the registers of the 54th (West Norfolk) Regiment from 1762 to 1799. The information given in the paper is by birth-year, and the soldiers were born in 1749 to 1778. The data include English and Irish men, but the average height was the same for the two nationalities. Of 1100 soldiers, 950 are from the period 1790-1799. The majority had been agricultural labourers.
Mature stature for men recruited in 1762-1775 was 169.9 cm (5 ft. 6.9 ins.), for those recruited in 1776-1782 it was 169.5 cm. (5 ft. 6.7 ins.), in 1783-1789 it was 172.6 cm. (5 ft. 7.9 in.), and in 1790-1799 it was 167.5 cm. (5 ft. 5.9 ins.). The average heights at enlistment were less in war-time years (we suppose the military authorities were less «choosy»). The most frequent ages at enlistment were 18, 19 and 20 years, 40 % of the total, and their height was around 167.7 cm. (5 ft. 6.0 ins.)
Movements in adult height appear to reflect the food situation at the respective birth dates.
The following two graphs show the distribution of heights in the period 1790 to 1799 (wartime); first the totality of recruits, and below, the men of over 21 years. We note that the graph below is a complete distribution curve.
The next information is the British Soldier Compendium (constructed by Edward Coss from data in the National Archives), referring to 7,300 of the British Soldiers in Spain under Wellington. The soldiers who enlisted in the Napoleonic Wars were about 300,000 at any one time, so we can take these as representative of the general population (i.e. they were not a specific segment). The Army authorities during the war needed to have a maximum number of soldiers, so they did not impose any “minimum height standards” at that time. Thus we see that the distribution is a well-formed “bell curve”, i.e. there is no “truncation” of the left tail, which would be visible if there were effectively minimum height standards.
Coss, Figure 1, Age distribution of all enlistees
a
For the period 1860 to 1880, the average height of the recruits was continuously close to 66 inches. This is corroborated by the fact that the authorities had to reduce the minimum height limit from 65 inches in 1872 to 64 inches in 1880 and to 63 inches in 1883, because they were not able to find enough recruits of the requisite heights.
From 1870, the military authorities were having problems to find the number of recruits necessary for the planned operations volume, and from 1880 the proportion of smaller or lighter recruits began to increase.
“The number of men who were so small in frame as to be useless as soldiers was on the increase, he regretted to say; and last year there were 174 per 1,000 who only weighed 8 st. 8 lbs. What was 8 st. 8 lbs. for a soldier? It was the weight of a Derby jockey, and not of a man fit for a campaign.”
(Sir Walter B. Battelot, M. P., Army (Recruiting) – “Waste”of the Army – Observations, Hansard, House of Commons Debate, 01 June 1883, vol. 279, cc 1529)
“But if anyone would take the trouble to see for themselves the actual material of these figures, he would find a lamentable and a pitiable exhibition. To call them soldiers was a misnomer. They were boys of 16 and 17, enlisted under false representations made by themselves as to age, boys of not necessarily more than 5 feet 3 inches in height, or 32 inches in chest measurement, by a recent Warrant. ….
The Inspector General of Recruiting’s Report for 1882 showed that 554 men per 1,000 were under 20 years of age, 495 per 1000 were under 9 st. 4 lb. in weight, and 272 under 5 feet 5 inches.”
(Mr. Tottenham, M. P., Army – State of the Army – Recruiting – Observations, Hansard, House of Commons Debate, 17 March 1884, vol. 286, cc 75 and cc 77)
a
“…. We have had, within the last two or three years, serious intimations that the supply of recruits has been falling off. We find that in 1885 we were able to recruit 39,500 men; in 1886, 39,000; in 1887 the number dropped to 30,700; in 1888 it fell still further to 24,700; but in 1889, under the extreme pressure of lowering the standard, it rose to 29,000. Last year it was 31,400, or 8,000 less than it was five years ago, and we have 34,000 to be recruited during the present year.
……
In addition to all this, we have what is a much more serious matter, and that is the almost ridiculously reduced standard both of height and chest measurement. I find that in 1870, the last year of long service, the standard for infantry stood at 5 ft. 8 in. What it is now? The Foot Guards themselves last year reduced their standard from 5 ft. 8 in. to 5 ft. 7 in., an inch below what was the regular standard of the whole of the infantry during the last year of long service. But putting the Foot Guards on one side, how about the other branches of the service? I find that Artillery gunners have reduced their standard from 5 ft. 6 in. to 5 ft. 5 ½ in., the standards for Drivers has been reduced from 5 ft. 4 in. to 5 ft. 3 in., and the chest measurement is brought down from 34 in. to 33 in. I do not know what sort of a soldier you can get with a chest measurement of that kind. Your present infantry standard is 5 ft. 4 in., with a chest measurement of only 33 in., and a weight of 115 lbs.
….
It has been reduced to such an extent that absolutely we cannot get men big enough to work the guns of the Garrison Artillery, and the height for drivers in the Engineers has been reduced to 5 ft. 3 in. Indeed special men are taken at a height below that, and men are enlisted not much bigger than the African pygmies of whom Stanley has written.”
(Mr. Hanbury, M. P., Army Recruiting, Hansard, House of Commons Debate, 19 February 1891, vol. 350, cc 1089, cc 1090, cc 1106)
a
“… In 1847, he says, the typical private soldier – that is to say 47 per cent. of those who were measured – was between 5 ft. 7 in. and 5 ft. 8 in. in height (*).
(Colonel Fox) The British soldier? – Yes. Only 10 per cent. were between 5 ft. 6 in. and 5 ft. 7 in. That is in 1845 [sic.], but when we come to 1887 the typical private, that is to say 52 per cent., is between 5 ft. 6 in. and 5 ft. 7 in.; only 16 per cent. reached the higher standard. In 1873, 412 out of every 1,000 men were under 5 ft. 7 in. in height and 608 out of every 1,000 had a chest girth of less than 37 inches. Then in 1889, 581 men out of every 1,000 were less than 5 ft. 7 in. in height and 645 had a smaller chest measurement than 37 inches. In 1889, 2,351 out of every 10,000 recruits were under 130 lbs. in weight, and ten years later this proportion increased from 2,351 to 2,962. Those are the measurements he takes purely for the British Army.”
Mr. J. B. Atkins, London Editor of the Manchester Guardian, Inter-departmentalCommittee on Physical Deterioration, Report, 1904; Vol. II, Minutes of Evidence, p. 124.
(*) But this was a high figure – equal to the average height of the total male population – and was possible only because they were taking only a few thousand men per year.
“The majority of recruits were growing lads, and a large number were out of work at the time of enlistment. Experienced recruiting agents estimate the proportion of the latter as high as 90 % of the total. In many instances the lads were suffering from want of food, and were generally in poor condition.” (Army Medical Department Report, 1907, p. 1).
Those men in the population who had a good physique went into jobs in the police force (increased by 30,000), railways, and the Post Office.
“Mr. Lucas, one of the largest employees in the building trade, giving evidence before the [Airey] Committee, said that few good men amongst his employees were
“in the habit of enlisting ….. Amongst the steady men the mechanics very rarely enlist; the steady labourers who leave our employ to go into the army are what we call waifs and strays …. Men who spend too much of their money on drink, and waste their time in dissipation, frequently, as a resource, go into the army …. The men we value do not enlist.””
(quoted in: Lord Anglesey, Vol 3. p. 45)
“Trade has also increased most wonderfully during the last thirty or forty years, and the thousands that are employed in it seldom, I think, become soldiers, and those who do are generally unfit for such. Then, too, the introduction of new implements of husbandry moved by horse and steam power has driven most of the agricultural labourers into the towns, and in a short time they become so demoralized and deteriorated in physique that they are not better than the manufacturing population …”
(Dr. Donald, evidence before the Inter-departmental Commission, quoted in: Lord Anglesey, Vol. 3, pp. 42-43)
But the boys in the poorer areas of the cities left school at 12, and went into “boy jobs”, i.e. errand boys and messengers, shop boys, office boys, van boys for carmen, but at 18 they had to leave these jobs. (Gareth Stedman Jones, Outcast London, 1971, pp. 69-70, p. 102). But they had no skills for other employments, so they had look for a job in the army.
A large proportion of these came from literally “slum areas” in the East End of London, Manchester and Liverpool. They had little chance of finding a job, did not have enough food, and did not have much bodily strength.
a
The unemployment in these areas was very high, and thus the wages were low and/or intermittent. There were three unofficial surveys of homes from the end of the nineteenth century. One investigation was carried out by Fred Scott in the poorest parts of Manchester, i.e. Ancoats and Salford, in 1882, and reported to the Manchester Statistical Society. He found that 21 % (Ancoats) and 40 % (Salford) did not have regular work. The percentage of the working-class resident in these areas had increased considerably. Another survey was organised by Seebohm Rowntree in York in 1899, visiting all those people who did not themselves have domestic servants. It gave a figure of 27 % of the total population of York, who either had incomes insufficient to cover their minimum necessities of food, rent, and clothing, or had incomes slightly above this “poverty line”. A survey of large parts of London was carried out by Charles Booth in 1886-1891, which showed that 30 % of the inhabitants of London, and 35 % of the East End, were “poor” or “very poor”. He presented a street map, with colours reporting the income/social level; the first two stages were “Lowest class; vicious, semi-criminal” and “Very poor, casual; chronic want”.
“One can only go upon the dictum of experienced army medical officers, and they, or some of them, hold that the Tommy Atkins recruit is just an average type of his class.”
“Yes, the slum class?”
“Of the class from which he is born, 50 per cent of our people. But 35 or 40 per cent of our people live in slums.”
“You admit that the slum population is smaller than it used to be?” “No, I do not; it is much larger.”
“We have had evidence as to the progress in the great towns in clearing slums?” “And that is perfectly true, but the area of closely packed houses is increasing, and for all practical purposes a great many streets in Manchester which the medical officer would not classify as slums, for our present purposes are slums, because they are too narrow and too sunless.”
“We were told in this room not long ago that all the back to back dwellings in Liverpool were entirely extirpated – all the cellar dwellings, and these conditions are more favourable for bringing more sunlight and air to those places, are they not?” “Yes, but there are 170,000 people in Salford who live in streets which do not exceed thirty-six feet in width, and this solid area of streets is very little broken up by open spaces. Now there is plenty of testimony to show (I have some here), that you cannot breed a vigorous race in such a place – you cannot do it. You may have pure water, but you have neglected the purity of the air.”
“Quite so, but then surely the conditions of the past were just as adverse?” “No, for this reason. Take sixty years ago, when the last Royal Commission investigated the condition in Manchester and Salford, there were then only 40,000 or 50,000 living under such conditions in Salford. It is true that perhaps 10,000 out of 40,000 were living in worse conditions than any you may select out of the 170,000 of to-day, but then, the average is no higher than then, and the number of people submitted to the deteriorative conditions I have mentioned is very much larger.”
(Rev. W. E. Edward Rees, member of the Salford Education Committee; Inter-departmentalCommittee on Physical Deterioration, Report, 1904; Vol. II, Minutes of Evidence, Q. 4253-4258, p. 177)
The reservoir of men who enlisted – or attempted to enlist – changed around 1870-1880. Previously they were members of the lower working class, who had had an employment, and due to temporary – but serious – problems, went to the army for guaranteed income and food. From 1880 onwards, they were members of the “slum class”, of 17 to 20 years old, undersized, and who had never had an “adult job”. “The calling of a soldier has ceased to attract the class of men who formerly enlisted, and as a consequence a larger proportion of the residuum of the population come under notice of the Army Recruiting Authorities” (Inter-departmentalCommittee on Physical Deterioration, Report, 1904; Introduction, no. 30, p. 6). Thus these recruits had an average height less than that of the generality of the working class. Further, the link between the average height of the male population and that of the “potential soldier segment”, had been broken, and the “curve” of the soldiers’ heights did not indicate the “curve” of the male population.
A change took place in the requirements for recruits in the early 1880’s. Boys of 17 years were tacitly allowed to present themselves as 18 year olds, so long as they were above the minimum height limit. This meant in the statistical representation, that there were 15,000 more “18 year olds”, and also 15,000 more total recruits. The average height of the 18 year olds decreased by nearly 1 inch, and the average height of all recruits per year also decreased by nearly 1 inch. This negative movement in the average heights of recruits does not indicate a parallel movement in the heights of the men with decent employment.
Year
Number Examined All Ages
Number Recruited All Ages
Average Height All Ages
Per Cent Examined 18 Years
Per Cent Examined 20 Years
Heights Recruits 18 years
Heights Recruits 20 years
1879
42,600
27,200
66.9
21.7
13.0
66.7
67.1
1880
46,100
27,300
66.8
26.1
13.0
66.6
66.8
1881
47,400
26,000
66.5
(*)15.0
13.5
66.3
66.3
1882
45,400
26,100
66.3
(*) 3.7
13.7
66.2
66.5
1883
59,400
26,000
65.9
24.0
11.8
65.5
66.3
1884
66,900
39,000
66.0
31.9
10.5
65.6
66.4
1885
72,200
43,300
66.0
34.1
10.7
65.6
66.3
1886
75,000
42,100
66.0
39.5
9.0
65.6
66.5
Data from the Army Medical Department Reports.
(*) Errors in the official figures
b
“What about recruits of seventeen?” “They are too young for the Army, we take no man under eighteen.”
“Do you know that the Army Medical Reports of 1897 to 1900 show that there is a very considerable proportion indeed under eighteen, between seventeen and eighteen?” “No man is enlisted unless he says he is eighteen, except for the Militia.”
“That is a mis-statement on the part of the recruit, is it not?” “On the first page of the attestation a man declares his age. We do not ask him to produce a birth certificate, and as Mr. Brodrick has answered in the House of Commons, it would never do to get the birth certificate. You cannot get a man to enlist unless you enlist him at once.”
(Major-General H. C. Borrett, Inspector-General of Recruiting; Inter-departmental Committee on PhysicalDeterioration, Report, 1904; Vol. II, Minutes of Evidence, p. 9)
c
“….. They were boys of 16 and 17, enlisted under false representations made by themselves as to age, boys of not necessarily more than 5 feet 3 inches in height, or 32 inches in chest measurement, by a recent Warrant. ….”
(Mr. Tottenham, M. P., Army – State of the Army – Recruiting – Observations, Hansard, House of Commons Debate, 17 March 1884, vol. 286, cc 75 and cc 77)
Inter-departmental Committee 1904
From 1880, the army administration had been very worried about the low quality of height and strength of the men who presented themselves for recruits. This problem became real in the Boer War of 1899-1902, when the it was necessary to send 300,000 British and Empire troops to subdue a much lesser number of the total Boer population. It was clear that the quality of the troops (both the regulars and the volunteers for the war) was very low, and that this had made the army’s work very difficult. A movement started in Great Britain presenting the idea that there was a “Physical Degeneration” of the whole population.
The Government requested a number of experts to take part in 1904 in an “Inter-departmental Committee”. The witnesses to this committee were representatives of medical organizations, H. M. Inspector of Schools, H. M. Lady Inspector of Factories, army recruiting generals, secretary of the Anthropometric Association, doctors, social activists, and particularly: Charles Booth [poverty statistics, not the Salvation Army]; Seebohm Rowntree; a representative of the Salvation Army. In their appearances before the committee, the “official persons” took the position that there was no generalized “Degeneration”, and in any case, there were no recent data as to men’s heights which could be compared against previous data, which would be those of the Anthropometric Committee of 1882-1883. All those witnesses who had direct contact with the working class reported that there were many cases of short people, and/or with bodily problems (rickets and bandy legs; anemia in the women; sterility in the women, from stress; bad teeth, very common; lessening of the intelligence, in small children; undeveloped musculature of the arms).
The causes of the reduction in heights were: unsuitable and insufficient food (many of these families ate almost without exception, white bread, butter, sometimes jam, and drank large quantities of tea), very little care by the parents of their children, little sleep for the children, juvenile smoking, no movement of air in the rooms or in the house. In many cases, the parents had apparently enough wages to buy sufficient quantities of food, but spent a lot on drink.
q
Witnesses’ comments as to stature:
“… Mr. Marr, who is the head of the Men’s House of our University settlement in Ancoats, tells me that they have a great difficulty with their dramatic performances. A stranger of 5 feet 6 inches looks a giant on the stage with Ancoats people. There are large engineering and machine building works at Ancoats. Mr. Marr says that on several occasions he has passed through a crowd of the workmen, and they have the stature of school boys: and that is the case. I stood in a great crowd on the occasion of the opening of a boys’ club by the Duke of Clarence. I had to leave early with my wife who is of middle height and she looked over the heads of the crowd. The average height of the people of Manchester and Salford is very low.”
q
Mr. T. C. Horsfall, Manchester and Salford Sanitary Association, Q. 5640, p. 226
“In those districts of the towns which are chiefly inhabited by working people, the average stature of the inhabitants is very low – a man of 5 feet 10 inches in height looks over the heads of a crowd in such districts – and physique is very poor. Bad teeth are remarkably common. The children in schools are much below the English average in height and weight. The members of the University Settlement in Ancoats, who meet many of the most intelligent workmen in that part of Manchester, notice that they walk badly and that very few breathe rightly. Cripples are very common. The settlement is in touch with 180, all of whom live within a mile of the settlement.”
Mr. T. C. Horsfall, Q. 5580, p. 221
“….. But there is a very much larger number of men in industrial cities, varying in height from 5 ft. 1 in. to 5 ft. 5 in., than you find in the rural districts – a very much larger proportion.”
Mr. Harry James Wilson, H. M. Inspector of Factories and Workshops in Newcastle-on-Tyne, Q. 1988, p. 85
“We must not take it that life in the country is necessarily better than life in the towns under the present organization that you speak of?” “I think that is too wide a question for any one person to speak of with conviction. I have not seen enough to enable me to say positively that that is the fact. On the whole there is no doubt that the open air life gives a more vigorous physique than life in the towns. Take, for instance, the magnificent policemen we have in London, whose figure as they walked beside the processions of the “unemployable” were a staggering commentary on that fact. I know a good many police officers who tell me that these men come up from the country districts, but I am afraid that their children or grand-children will be represented by the physique of the unemployed if they remain in London.”
“Why are you afraid?” “Because I see the sort of population that comes day after day to watch the Guards parade at St. James Palace; and it so happens that on Mafeking night I walked down from Charing Cross to Cannon Street by chance, and I went through the whole crowd and I did not see a dozen men that I could have enlisted. A great portion of the crowd were women and children no doubt, but I was watching the whole way from Charing Cross to Cannon Street to see what kind of men they were, and my impression was what I have said.”
“The streets were well enough lit for you to see?” “Yes. You will remember what a blaze there then was.”
General Sir Frederick Maurice, Q. 390-392, p. 17
“…. Immediately on the expiration of the compulsory school attendance period, fourteen years of age, this child will commence to labour for his own bread. If he resides in a textile district, employment at relatively good wages will be readily found for him, but the hours will be long, fifty-five per week, and the atmosphere he breathes very confined, perchance also dusty. Employment of this character, especially if carried on in high temperatures, rarely fosters growth or development; the stunted child elongated slightly in time, but remains very thin, loses colour, the muscles remain small, especially those of the upper limbs, the legs are inclined to become bowed, more particularly if heavy weights have to be habitually carried, the arch of the foot flattens and the teeth decay rapidly.”
Mr. Harry James Wilson, Q. 1927, p. 81
“ ….. In studying this question myself, I have considered the crofter or small holder, such as one finds in the rural districts of England, but more especially in Scotland and Ireland, as a fair type physically of what an individual brought up under reasonably healthy conditions ought to be. The men and women of this class are usually of good height and weight, have superior muscular development and possess the power of endurance in a marked degree.
….
Contrasted with this class the town-bred artisans are, more especially in large industrial centres, distinctly less both in height and weight, and their general development inferior. Even shop assistants and clerks drawn from the families of the lower middle classes compare very favourably with these men, and their equal is only reached among the upper middle classes where the individuals have been trained to an outdoor life, or allowed sufficient exercise and sleep during the period between leaving school and attaining full growth.
…..
The most marked degeneracy, in my opinion, is found where the greatest number of adverse circumstances are actively at work from birth to maturity, as for instance among the very poor in our old industrial centres, and is especially noticeable in the case of poorly paid and unskilled indoor workers, the women suffering about equally with the men. This degeneracy can be best studied in certain textile industries, or wherever the remuneration is so small as to attract the lowest in the social scale.”
Mr. Harry James Wilson, QQ. 1912-1915, p. 80
“…. The most unsuitable class of occupation has been described; the most beneficial, perhaps, is farm laboring, after that industries partially conducted outside, such as ship-building, rope-making, iron-rolling, quarrying, and fish-curing. …”
Mr. Harry James Wilson, Q. 1933, p. 81
“[the worst types?] “Persons of poor constitution, or suffering from slight deformity, frequently become tailors or shoemakers, and the great mass of ordinary tradesmen with medium development and stamina one finds working as joiners, printers, moulders and fitters, etc. I would place barbers, clerks, shop-assistants, textile operatives, and bakers, etc., below ordinary tradesmen in point of physique, their occupations not being of a character to foster development; but the very poorest are met with in the lowest paid and unskilled textile operations, as casual labourers, and occasionally in potteries.”
Mr. Harry James Wilson, Q. 1935, p. 81
“…. Thus I have frequently conversed with full-grown men of twenty years and upwards who do not stand more than 5 feet or 5 feet 1 inch, and who scale less than nine stone. These men have not the physical strength for heavy manual labour, or indeed any task which demands prolonged efforts, but must accept unskilled labourer’s wages in mills or factories all their lives. As a matter of fact these men are doing women’s work very often. They get from 10s. 6d. up to 17s. a week.”
[Dundee]
Mr. Harry James Wilson, H. M. Inspector of Factories, Q. 1936, p. 82
“Can you tell us what aspect of physical degeneration first attracted your attention to the subject?” “I practiced what they call locally in Liverpool for eight years, and when I went down I saw a great contrast between the operatives from manufacturing districts and men and women coming from agricultural districts; it was very marked. I was startled by the appearance of the former, and it was some time before I came across the true Lancashire race. The agricultural parts of Lancashire certainly produce as fine a lot of men as any county in England, and the contrast between them and the men of the manufacturing districts was most startling.”
Mr. Ralph Neville, Secretary of the Garden City Association, Q. 4728, p. 192
“The influence of nutriment on growth is also shown by the difference in stature in Jews living in the East End and in the West End of London. The wealthy Jews of the West End are found to be 3 inches taller than the poor Jews in the East End.”
Mr. Lindsell, Member of the Council and Treasurer of the Anthropological Institute,
Q. 3267, p. 141
“As far as I can tell, the girls are more weakly and less able to work, and certainly the teeth are worse; ….. I know something about Hertfordshire. I should say that the girls who came for instance into my mother’s service are less strong than in my girlhood thirty years ago.”
The Hon. Mrs. Arthur Lyttelton, Q. 5359 and 5361, p. 213
“I enquired of a large London contractor who is making a railway in the district, and he tells me his experience. I have received a letter from him since I came into this room saying that his navies, especially when drawn from the agricultural laboring class, are nothing like as good as they used to be. I can read you what he says: “This class of man as a whole is very much inferior to-day to what it was twenty-five or less years ago.””
Mr. G. H. Fosbroke, Medical Officer of Health to the Worcestershire County Council,
Q. 6667, p. 263
a
“I went there [Longton, Potteries] because I thought the children would be drawn from the poorest class, and the master who had been master for several years, said, in his opinion, his children improved after they went to work, and he thought the reason was that they had such very poor food owing to their bad homes and bad parents that when the earned a little money for themselves they were able to get better food.”
“They supplemented it by things they bought themselves?” “Yes, or they contributed to their support and had better food. But in the parts that I went to I think there was a general opinion that they were dwarfed – smaller than they should be: they did not grow. In our very large classes, in the boy’s clubs and women’s classes, they seem to be distinctly under the size and height that you would expect.”
Miss Maud Garnett, Head of the Diocesan Women’s Settlement, Fenton House, QQ. 9060-9061, p. 331
“The difference in physique between the men of the farming class and the working people of the towns is very striking. The contrast may be noticed especially on the occasion of large political processions in which bands or lodges of farmers and of city artisans are to be seen side by side, when the greater stature and bulk of the farmer are at once noticeable.”
[Ulster]
Dr. C. R. Browne, Q. 9693, p. 357
“On the whole you think there is better physique in the country school?” “Bigger bulk.”
“But not as alert as the children in town?” “Well, if I may go on; I say this impression was well verified during the medical inspection of one of the Edinburgh schools. My husband asked that the nine- to ten year old girls be sent to him, and when they came into the room I said, “The teacher has made a mistake here; she has sent in the infants,” but when we looked at their sheets, they were right enough – girls between nine and ten years of age. That was my impression. I do not think there is any doubt that the purely country bred child has at all ages a larger total physical development than the town bred child.”
Mrs. Mackenzie, QQ. 7000-7002, p. 276
Jack London, in his account of living on the streets of the East End in 1902 (“The People of the Abyss”), gives us some other observations:
“Nowhere in the streets of London may one escape the sight of abject poverty, while five minutes’ walk from almost any point will bring one to a slum; but the region my hansom was now penetrating was one unending slum. The streets were filled with a new and different race of people, short of stature, and of wretched or beer-sodden appearance.”
(Chapter I, The Descent)
“In short, the London Abyss is a vast shambles. Year by year, and decade after decade, rural England pours in a flood of vigorous strong life, that not only does not renew itself, but perishes by the third generation. Competent authorities aver that the London workman whose parents and grand-parents were born in London is so remarkable a specimen that he is rarely found.”
(Chapter IV, A Man and the Abyss)
“Of the “submerged tenth” Mr. Pigou has said: “Either through lack of bodily strength, or of intelligence, or of fibre, or of all three, they are inefficient or unwilling workers, and consequently unable to support themselves … They are often so degraded in intellect as to be incapable of distinguishing their right from their left hand, or of recognizing the numbers of their own houses; their bodies are feeble and without stamina, their affections are warped, and they scarcely know what family life means.”
(Chapter IV, A Man and the Abyss)
“It is incontrovertible that the children grow up into rotten adults, without virility or stamina, a week-kneed, narrow-chested, listless breed, that crumples up and goes down in the brute struggle for life with the invading hordes from the country.”
(Chapter V, Those on the Edge)
“But up spoke my other companion, a man of twenty- eight, who eked out a precarious existence in a sweating den.
“I’m a ‘earty man, I am”, he announced. “Not like the other chaps at my shop, I ain’t. They consider me a fine specimen of manhood. W’y, d’ ye know, I weigh ten stone!”
I was ashamed to tell him that I weighed one hundred and seventy pounds, or over twelve stone, so I contented myself with taking his measure. Poor, misshapen little man! His skin an unhealthy colour, body gnarled and twisted out of all decency, contracted chest, shoulders bent prodigiously from long hours of toil, and head hanging forward and out of place! A “’earty man’, ‘e was!”
“How tall are you?”
“Five foot two,” he answered proudly; …”
(Chapter VI, Frying-Pan Alley and a Glimpse of Inferno)
To us today, these descriptions of the condition of the very poor working class (and non-working class), are not understandable. We are generally informed that the working class of the country, up to 1860, had reached a reasonable level of income and living conditions, and then improved continuously. But what we have here is a description of a “sub-class”, which really does not appear in the economic figures of the country. Some of the witnesses offered analysis of why this had happened. In a general sense, those of the working class who had a decent or nearly-decent way of life in 1860 had improved their incomes and their living conditions, and those of the working class who had low living standards (and lived in slum areas) had had no movement in their situation. But the proportion of the “sub-class” increased from perhaps 5 % to perhaps 20 %. And they lived in original slum areas, but with a higher density of housing. Here we have the analysis by some of the witnesses:
q
“….. He says his first point is that up to the age of eight, children in the meaner Salford schools are scarcely inferior to those in the better quarters. He deduces these results from the measurements of the Anthropometric Committee. Then he goes on to say that after the age of eight, a constantly-growing disparity is observable between the scholars in the squalid surroundings and those in the better quarters. For example, he finds that at the age of thirteen a scholar in the slums is four inches shorter and 16 lbs. lighter than his fellow in a good working class neighbourhood. …… Next he makes this point, which I think is a very interesting admission, from a man who firmly believes there is a grave deterioration. He says that he does not think the physical standard of the slum dweller is necessarily lower than before. If you take the average measurement of the slum, he says, it is not worse than in any given year before in the same slum. But the point is that a greater proportion of persons is now falling to this level owing, as he says, to the capacious maw of the towns, which swallow up so much of the rustic population. That, he says, is really where
the degeneration lies.”
Mr. J. B. Atkins, London Editor of the Manchester Guardian, quoting the Rev. W. G. Edwards Rees, Chairman of the Anthropometric Committee of the Salford School Board,
Q. 2871, pp. 123-124
“….. but he frankly admits the improvement in certain classes, and his whole point is, that there is a growing disparity between the favoured class and the highly unfavoured class, a widening of the gulf, he says, between the giants and the pygmies, and he adds that the sanitary statistics on which some people rely simply obscure the truth. Of course he admits that the death rate is lower, and the expectation of life has increased. Then he searches for the cause of deterioration, and takes a most interesting view which I have never got anybody else to admit so fully: he says that drink is not the causa causans; it is not the specific cause, because he thinks bigger men used to be a great deal more drunk than now, and he says that some people on the Continent are actually improving in spite of a greater consumption of drink. Then he says overcrowding is not the whole cause, as the whole of Europe is overcrowded except Denmark. And the physical measurements are increasing in nearly all those countries. Then he says want of food is not the whole explanation. He says it is more abundant and distinctly better than it was sixty years ago. The thing that he attributes all the evil to is the want of fresh air and the want of exercise in the towns.”
Mr. J. B. Atkins, London Editor of the Manchester Guardian, quoting the Rev. W. G. Edwards Rees, Q. 2890, p. 125
“In considering the condition of the parents of the children who you think are in need of assistance you draw a very sharp line between the better class and the poorer class?” “Yes. I say you can draw a sharp line dividing the working class children into those who were never better cared for, never better physically trained, never better looked after generally, than they are today, and those on the other hand who, in the matter of nutrition, clothing, housing, and so on, were never worse off than they are today.”
“You think that recent years have accentuated the differences between those classes?” “Yes. I suggest that 80 per cent. of the working class children were never as well off as they are today. I think that is the result of thirty-three years of compulsory public education, the habits of discipline given in the schools, the physical training given in the schools, and the organized games of the playgrounds and playing fields, and the elevating effect of the school system upon the home – I lay great stress on that.”
Dr. Macnamara, M. P. for Camberwell, Member of the London School Board, QQ. 12362-12363, p. 454
“One can only go upon the dictum of experienced army medical officers, and they, or some of them, hold that the Tommy Atkins recruit is just an average type of his class.”
“Yes, the slum class?”
“Of the class from which he is born, 50 per cent of our people. But 35 or 40 per cent of our people live in slums.”
“You admit that the slum population is smaller than it used to be?” “No, I do not; it is much larger.”
“We have had evidence as to the progress in the great towns in clearing slums?” “And that is perfectly true, but the area of closely packed houses is increasing, and for all practical purposes a great many streets in Manchester which the medical officer would not classify as slums, for our present purposes are slums, because they are too narrow and too sunless.”
“We were told in this room not long ago that all the back to back dwellings in Liverpool were entirely extirpated – all the cellar dwellings, and these conditions are more favourable for bringing more sunlight and air to those places, are they not?” “Yes, but there are 170,000 people in Salford who live in streets which do not exceed thirty-six feet in width, and this solid area of streets is very little broken up by open spaces. Now there is plenty of testimony to show (I have some here), that you cannot breed a vigorous race in such a place – you cannot do it. You may have pure water, but you have neglected the purity of the air.”
“Quite so, but then surely the conditions of the past were just as adverse?” “No, for this reason. Take sixty years ago, when the last Royal Commission investigated the condition in Manchester and Salford, there were then only 40,000 or 50,000 living under such conditions in Salford. It is true that perhaps 10,000 out of 40,000 were living in worse conditions than any you may select out of the 170,000 of to-day, but then, the average is no higher than then, and the number of people submitted to the deteriorative conditions I have mentioned is very much larger.”
(Rev. W. E. Edward Rees, member of the Salford Education Committee; Inter-departmentalCommittee on Physical Deterioration, Report, 1904; Vol. II, Minutes of Evidence, Q. 4253-4258, p. 177)
r A second effect was that of the migration from the countryside into the cities (particularly London). It was a commonplace that city-born children, whose parents had come from the country, were shorter than their parents. This was due to the bad conditions in the cities: coal smoke, zero movement of air in the buildings and the rooms, bad working conditions, little free exercise.
q
The effects from 1860 to 1900 on the average height of the population of England might have been approximately the following: Increase in percentage of slum population: change in proportion of “never worse off” in the population = 20 % minus 5 % = 15 %, decrement in height per person = 4 inches, effect on average height of population = 0.15 x 4 = 0.6 inches; Increase in proportion of urban working class = 10 %, decrement in height per person = 2 inches, effect on average height of population = 0.1 x 2 = 0.2 inches; Total effect = 0.8 inches.
e
The final height value after the reduction of 1.0 inches, is 66.1 inches in 1914-1915, in a study of 3,000 men who were part of the immense enlistment for the War. (Bailey, Hatton, Inwood, 2014)
Some of the witnesses commented on the more proactive policies of the
German, French and Swiss authorities.
“Germany is very different from this country, because the great industrial development in Germany succeeded instead of preceding as it did in this country any comprehensive knowledge based upon on scientific hygiene?” “Yes.”
“And therefore Germany was fully alive to the sanitary conditions of the problem before it had to face the great increase of the urban population?” “Yes.”
“Whereas the great increase in this country in industrial development preceded, not only any healthy public sentiment on the subject, but any scientific knowledge?” “Yes.”
Mr. Rowntree, QQ. 5094-5096, p. 204
“[Colonel Fox] I remember going to Solingen, the Sheffield of Germany, and I expected to find a second Sheffield, but I found no smoke, and every house was painted white, with green shutters, because the laws were in force against noxious vapours?” “Yes, and Germany has seen what we have not seen. We saw the necessity, before any other people, of making the drainage right; other continental peoples generally have seen the necessity of keeping the air pure before we did – we have not yet seen it.”
Mr. Rees, Q. 4280, p. 178
“The only conceivable way in which many of the causes which operate in the houses and ruin the health of the people can be got rid of is the adoption of a system which German towns are being forced into of having what is called continuous inspection of houses. Since 1901 all towns in Saxony, with over 20,000 inhabitants, must have continuous inspection of small houses, and in Wuerttemburg all towns with more than 3,000 inhabitants have it. Stuttgart, with 181,000 inhabitants, introduced the system of continuous inspection of all small houses, and servants’ and apprentices’ rooms in larger houses, in 1902. It has 120 unpaid visitors, who are aided by paid officials. The visitors would be fined if they did not accept the office when they are appointed. The system has been introduced into villages in Saxony. You must have every house entered and reported upon. You cannot expect very poor people to report, nor can you expect their neighbours to do so: and no voluntary organization can be strong enough to visit all the small the small houses in a small town. It must be made the duty of some person to go into every house periodically to examine it and call attention to those defects which are interfering with health.”
Mr. Horsfall, Q. 5620, p. 224
“You attribute one of the causes of physical deterioration to the absence of such a system as that known as the Elberfeld for dealing with such poverty. Would you kindly describe that system a little?” “The possibility of it is due to the existence of the right of the German Government to claim from every citizen in civil life that he shall accept an unpaid post. Under the Elberfield system [initiated in 1851] the whole of a town is divided into very small districts and to each of those districts one of the citizens is told off. It is his duty to visit all the working class families that are likely if things go badly with them to need help, and to make himself familiar with the circumstances of their lives, to give them advice which in his opinion will tend to get them out of difficulties, to give them advice as for instance how to get situations and the best work for their sons. Then if one of the families that one of the visitors does get out of work or need help from public sources the visitor has to report the case to the organization of the district that includes his own small one – and if they approve of what he proposes to do then an amount of money is paid through this man to the family for the time during which it is needed. This system is working so well in preventing poverty and in helping the people who have fallen into poverty that it is now being in its essential features applied by all the large towns.”
Mr. Horsfall, Q. 5646, p. 226
The witnesses also commented on the town planning in Germany, such that the factories were built not close to the workers’ housing, and that there were areas for parks and trees; the system of tickets in Paris, such that the poor children could have free meals at the cost of the city administration; and the longer periods for the absence of the women after childbirth, in France, Germany, and Switzerland.
qDiscussion and Conclusions
r
This investigation has shown that the graphs of average height of recruits per year, are fully explainable in terms of military actions and changes in recruitment policies:
large-scale wars;
urgency in finding large numbers of troops for an unexpected war;
changes in minimum height standards;
amounts of bounties (signing-on bonus).
The only socio-economic factor was the lack of employment in the labour market
for poorer boys, starting in the 1870’s.
It is not necessary to postulate that the average heights are caused by economic, nutritional, or sanitary conditions at the time of childhood of each man.
It appears that Roderick Floud was conscious that there could be some effect of the changes in recruiting policies and of the peace/war dichotomy, on his calculated average heights:
“It is wise, however, to be cautious. The period spanning the Napoleonic Wars was one of extremely rapid change in the demand for recruits. It is not difficult to construct an imaginary scenario which would explain away the short-term oscillations in the series, in line with the discussion of offer bias in the labour market in section 3.3 above. In brief, it is possible that the interplay of military recruitment with the civilian labour market could have produced such an oscillation. If it did, then the drop in heights for those born in the 1790s might be an artefact of such a process, as might be the rapidity of the increase thereafter. It might similarly be argued that the data from the third quarter of the nineteenth century might be affected by the Crimean War and that from the 1890s and 1900s by the Boer War.”
(Height, Health and History, pp. 152-153)
q He was right. Taking his figures from Table 4.1. (and correspondingly, the Figures 4.1., 4.2., 4.3.) for the “birth years”, we have:
w
Birth Year
1780-1784
1785-1789
1790-1794
Recruitment Year
1798-1802
1803-1807
1808-1812
Age 18
65.2
63.4
64.1
Birth Year
1825-1829
1830-1834
1835-1839
1840-1844
Recruitment Year
1847-1851
1852-1856
1857-1861
1862-1866
Age 22
67.5
66.9
64.7
66.6
Birth Year
1876
1877
1878
Recruitment Year
1898
1899
1900
Age 22
66.2
65.6
66.1
d
We see that the 1803-1807 minimum corresponds to the Napoleonic Wars, the 1857-1861 minimum corresponds to the Crimean War, and the 1899 minimum corresponds to the Boer War.
So we will be using the data from all the other sources, but not from soldiers’ recruitment heights, to make a good estimate of heights during our period.
The final result of estimated heights for the average of the population of Great Britain for 1760 to 1900 is as follows:
s
Height ins.
Height cm.
1760
66.0
168
1770
66.0
168
1780
66.1
168
1790
66.2
168
1800
66.2
168
1810
66.3
168
1820
66.6
169
1830
67.0
170
1840
67.2
171
1850
67.5
171
1860
67.5
171
1870
67.5
171
1880
67.4
171
1890
67.1
170
1900
66.7
169
s
t
The first period, from 1760 to 1810, has as examples:
Of the Steegmann soldiers, those who were recruited in 1790-1799, that is, when there was a large volume of recruitment, the average height was 65.9 ins.
The Dorset Militia in 1798-99 (civilians) had an average height of 66.4 ins.
Selection by Coss of 7,300 soldiers in the Peninsular War (1808-14) was 66.3 ins.
“Floud Data” of soldiers gives 66.1 ins. for recruitment date 1780 (American War of Independence), 66.0 ins. for recruitment date 1794-1810 (Napoleonic Wars).
For the second period, from 1840 to 1880, we have:
The analysis by James Riley, of the data from Beddoe, which shows practically continuous stature of 66.9 inches for persons of 20 years old from 1840 to 1865;
The collection of heights by John Beddoe in 1870, giving an average height of 67.4 inches;
The analysis by the Anthropological Committee, of persons born in the years from 1840 to 1870 showing an average height of continually close to 68.0 inches, and those born in the years 1870 to 1880 of 67.7 inches;
The survey of the Anthropological Committee, giving an average height of 67.4 inches in 1882 and a few years before.
For the period from 1880 to 1900, the assumption is:
The height of 67.4 inches in 1880, falls to 66.5 inches in 1900, due to the increase of the proportion of “slum population” and the numbers moving to the cities.
The end figure for this paper is of 66.1 inches for 1914, taken from a sample of the men who enlisted in 1914-15.
The male convicts had a stature of 66 inches in 1764 (birth date), which went down gradually to 65.5 inches in 1830 (birth date), where it remained until 1880.
The male skeletons excavated in archaeological investigations in burial grounds, which were in use in different periods from generally 1750 to 1850, had average heights per burial ground of between 66.5 and 67.5 inches.
As a general statement, we can say that the average male height (“walking down the street”) was from 5 ft. 6 in. to 5 ft. 7 in. in the period 1780 to 1820, and from 5 ft. 7 in. to 5 ft. 8 in. in 1850 to 1880. The probability is that by 1900, 75 % of the population had an average stature of 5 ft. 7 ½ in., and 25 % of the population (“slums” and migration into London) had an average stature of 5 ft. 4 ½ in.
If we think in terms of “birth dates”, and supposing that the average age in each of the investigations was about 30 years old, this means that men born in 1750 to 1790 had an adult height of 5 ft. 6 in. to 5 ft. 7 in., and that men born in 1820 to 1850 had an adult height of 5 ft. 7 in. to 5 ft. 8 in.
Thus the average heights from approx. 1770 increased by 1.0 inch – or a little more – up to 1830. This would suggest a net improvement in the living conditions in this period. This is not surprising, as we know that at least the populations in the Northern Industrial Towns and in London had a sufficient food consumption in this period. We also know that 25 % of the working class families had a clear excess of income over expenses; 800,000 families had accounts of on average 30 Pounds by 1844. On the other hand, the effects of the Industrial Revolution as to bad sanitation and housing overcrowding were not important before 1830 (only important in Lancashire).
w
The heights of men born in 1820 to 1850 (real date = 1850 to 1880) were higher than at the end of the 18thcentury, and considerably higher than in other countries. It would appear that the effect of sufficient food and wages was more (cumulative up to these dates) than the negative effect of bad sanitation, bad housing and bad air.
Following, we have a graphical depiction of the average heights in some European countries in intervals of 25 years:
w
tAverage heights in centimeters:
uAverage heights in centimeters:
Great
France
Belgium
Netherlands
Italy
Spain
Sweden
Britain
1800
168
162
164
165
164
1825
169
163
165
166
167
1850
171
164
165
164
162
162
168
1875
171
165
165
166
162
163
170
1900
169
166
166
169
164
164
172
1925
170
167
166
171
165
165
173
1950
171
168
170
174
167
166
175
1975
173
173
175
178
171
168
178
2000
175
176
179
182
175
175
179
vAverage heights in inches:
w
Great
France
Belgium
Netherlands
Italy
Spain
Sweden
Britain
1800
66.2
63.8
64.6
65.0
64.6
1825
66.7
64.2
65.0
65.4
65.7
1850
67.5
64.6
65.0
64.6
63.8
63.8
66.1
1875
67.5
65.0
65.0
65.4
63.8
64.2
66.9
1900
66.7
65.4
65.4
66.5
64.6
64.6
67.7
1925
67.0
65.7
65.4
67.3
65.0
65.0
68.1
1950
67.3
66.1
66.9
68.5
65.7
65.4
68.9
1975
68.0
68.1
68.9
70.1
67.3
66.1
70.1
2000
69.0
69.3
70.5
71.7
68.9
68.9
70.5
t
There are a few individual numbers about other countries from the Inter-departmental Committee, which show that the percentage of rejections for recruits went down:
“… Mr. Edwards-Rees has some figures here which I could give to you in a few minutes, comparative figures. He says it is not easy to get the German figures, but these he has been given for the year 1889. There is a striking parity, he remarks, between the German conscript and the average English recruit. In 1889 the English recruit averaged 5 ft. 5.6 in. in height, and his chest measurement was 33.6 inches, and he weighed 124.4 lbs.; the German conscript 5 ft. 5.75 in. in height, 33 ¾ inches round the chest, and 138 lbs. in weight. The German superiority in weight, therefore, he says is remarkable.”
“There is one thing about that; they are representative men of the country. They represent the whole of the country, but our men come from the lower stratum altogether?” “Yes. I was going on to say that. I think that does invalidate the point. He says that the German superiority in weight is remarkable, but the German conscript is, on average, ten months older. So far, he says there is little in it between the two, but then we must consider the percentage.”
“He is two years older; the German conscript is twenty years of age and our recruits are only eighteen?” “Was that so in the year 1889?”
“Not the average. The average is not eighteen. You take men older than eighteen.”
“A vast number come in at eighteen, you see?” “Yes. Then he goes on to the percentage of rejections, a comparison between Germany and Great Britain. He says in Germany the percentage fell steadily from 24.7 in 1878 to 16.3 in 1889. In about the same interval ours rose from 52 per cent. to 62 per cent.”
QQ. 2879-2883, p. 124
“….. Then he goes on to the French estimate. The statistics up to 1890 tell substantially the same tale. The percentage of rejections has fallen from 9 ¼ per cent. in 1831 to 5 per cent., where it now stands. The increase in the average height of French soldiers has been set down at about ¼ of an inch in a period of twenty years, noticed continually between 1830 and 1890. Since then there has been a slight relapse in the French measurements, and alcoholism is a suggested cause.”
Q. 2886, p. 124
“As for the Swedish army, he says that between 1841 and 1850, the rejections were 36.4 per cent.; this proportion fell in successive decades to 35.7 per cent., then to 27 per cent., then to 23 per cent, and lastly to 20 per cent.”
Q. 2888, p. 125
“The Dutch army he takes next; he says the proportion of men under 5 ft. 1 in. fell from 13 per cent. in 1863 to 3 per cent. in 1899. Men between 5 ft. 1 in. and 5 ft. 3 in. fell in the same period from 15 per cent. to 8 per cent., while men of more than 5 ft. 7 in. rose from 23 per cent to 37 per cent.”
Q. 2890, p. 125
A comparison with the graphs of heights of other European counties is interesting. In 1800, British men were 4 cm. taller than those of Sweden, 4 cm. taller than those of Belgium and the Netherlands, and 6 cm. taller than the French. By 1900, Sweden had passed Great Britain by 3 cm., the Netherlands had only just caught up with Great Britain, France and Belgium were still behind. If we look at the increases in the period 1800 to 1900, we see a hierarchy: Sweden + 8 cm., Netherlands + 4, France + 4, Belgium + 2, Great Britain + 1.
Sweden and the Netherlands had respectable increases, although they started industrializing only after 1850. France started industrializing around 1820-1840, but only in the North-East and East. Belgium was already industrialized by 1820, and England before that date.
It appears that it was possible to have an increase in average heights, which reflected economic growth, even if this growth was not based on industry. “Industrialization” should be interpreted as “large cities”, “extreme concentration of housing”, “minimal sanitation”, “air and water pollution”. In Great Britain the negative effects of industrialization were practically equal to the positive effects of increases in money incomes and in food.
“….. Professor Meyer – who is the head of the Zoological Museum in Dresden, and who came over on a tour of inspection of museums, wrote notes, which were not intended for English consumption, but were merely to be read to his colleagues and published in the Transactions of the Museum – speaks of the miserable condition of the people of Manchester and Salford. He gives an account of the Salford Museum, and his impression was a very unfavourable one. He said that the place was dirty with soot, and as it happened to be a public holiday the Museum was full on that day of a degenerate lot of people, the like of which “we have not in our German towns”. And that is amply justified. I received the report from Dr. Meyer because he had read some pamphlets of mine and agreed with what I had said. I mention this to show that this was not written as an insult to England, or with any desire to give offence to the English people.” “This is not due to great poverty, is it?” “It is due in part to poverty and in part to drinking and to wrong condition of life – all these things go together. You cannot say which is cause and which effect.” “Mr. Rowntree talks of primary poverty; that is, where the means are so small that under the most favourable conditions they could not keep a family?” “It is not generally the result of primary poverty, but very often the result of secondary poverty. Dr. Meyer said of Manchester it was “An incredibly sooty town, with over three-quarters of a million inhabitants. Dresden, which, in this respect, has an unfavourable distinction, is a real paradise compared with Manchester. We must deplore the course of a civilisation which produces such misgrowths and makes hells of places where human beings have to dwell.” If the popular notion of hell is a correct one, Manchester ought not to be described as a hell, because then the smoke presumably would be consumed.”Mr. Horsfall, QQ. 5635-5637, pp. 225-226
What set England apart from the Continental countries, is that at the end of the nineteenth century, it had a “slum class” of low stature and great poverty, in addition to the normal working classes. As Dr. Meyer says, … the like of which “we have not in our German towns”. The industrial Revolution, together with the commercial and social conditions of the time, had in the end formed a society in which “…. you can draw a sharp line dividing the working class children into those who were never better cared for, never better physically trained, never better looked after generally, than they are today, and those on the other hand who, in the matter of nutrition, clothing, housing, and so on, were never worse off than they are today.”This would partially explain the bad image of the. Industrial Revolution.
The “culinary culture” of the six Northern counties (Lancashire, Yorkshire, Durham, Northumberland, Cumberland, and Westmoreland) was different from the rest of England, as it used primarily oats; as these were considerably (30 % to 40 %) cheaper than wheat, the labourers were able to consume a larger variety of cereal dishes.
“This species of bread is provincially termed Haver Cake, which must undoubtedly be a corruption of the German haber, or hafer, and not derived, according to Johnson, from the Latin avena. With perhaps the exception of some parts of Lancashire, it is almost exclusively made in the West Riding of Yorkshire, and constitutes the principal food of the labouring classes in that district. It is a very thin cake composed of oatmeal and water only, and by no means unpalatable, particularly while it is new. The mixture is made of a proper consistence in a large bowl, and measured out for each cake by a ladle. As the price of an oat cake is invariarably one penny, the size of the ladle of course depends on the rate of meal in the market. The process of making these cakes will readily be understood by referring to the Plate. Some dry meal is sifted upon a flat board, and a ladle-full of the mixture poured over it. The cake is formed and brought to a proper size and thickness by a horizontal movement of the board, as here represented. It is then laid upon what is termed the Backstone, or hot hearth, to bake, which does not require many seconds of time and afterwards placed upon a cloth to cool. An inverted chair, as seen in the plate, frequently serves this purpose. The cakes are then hung upon a frame, called a “Bread Creel”, suspended from the ceiling of almost every cottage in the district. The people in the neighbourhood of Huddersfield are fond of what they term “Browiss”, which is oat cake in broth or gravy.”
“…. Now labourers generally breakfast on that very ancient food pottage, with the help of a little cheese and bread; they dine on butcher-meat and potatoes, or pudding; and sup on potatoes, or pottage, or bread and cheese.
……… The bread generally eaten in the county is made from oatmeal. Water and oatmeal are kneaded together into a paste without any leaven; this paste is rolled into a circular cake of about twenty inches in diameter, and is placed upon a thin plate of iron, called a girdle, under which a fire is put, and the cake thus baked goes by the name of clap-bread, and is to be seen at almost every table in the county. ….. The meal is mostly ground to such a degree of fineness, that a measure of sixteen quarts will weigh sixteen pounds. Farmers, labourers, and manufacturers, usually have fifteen cakes made from sixteen pounds of meal, and as many baked in a day as will serve their families for a month. Such of the gentry as eat this sort of bread, most of them now eating bread made from wheat, have it baked much more frequently, and also much thinner. A labouring man will eat sixteen pounds of meal made into bread in a fortnight; the price of sixteen pounds of meal is variable from 1s. 6d. to 2s. 6d.; the medium is 2s. which gives 1s. a week for each labourer for bread; his cottage and his fuel cost at least as much more. His wages for three-quarters of a year are 9s. a week, and 8s. a week for the other quarter; but making allowance for broken days, 8s. a week may be considered as the full amount of the price of his labour; and indeed a good labourer may be hired by the year at that rate. Hence there will remain 6s. a week for the labour of the man, for the remainder of his own sustenance, the maintenance of his family, and the clothing of them all.”
(Board of Agriculture / J. Bailey and G. Culley, General View of the Agriculture of the County ofWestmoreland, 1805; pp. 337-338)
“The labourers, who supply food for themselves and their families, live also comfortably in general compared with those of many of the southern counties. Their bread comprehends the whole of the wheat, except the coarse bran, and is home-made; this they eat with butter, or bacon and potatoes, and they have commonly one meal in the day of fresh meat, or meat-pie. Barley-cake, or a mixture of barley and wheat, is sometimes adopted when wheat is very dear; this is a wholesome, nutritive, and not unpleasant food. Those, who can keep a cow, derive from it a considerable share of the support of themselves and their families; ….”
(Board of Agriculture / H. E. Strickland, General View of the Agriculture of the East-Riding of Yorkshire, 1812; p. 261)
Further, Sir Frederick Eden comments upon the variety of food in the North:
“hasty pudding”, made of oatmeal, water and salt, about 13 oz. of meal to a quart of water, which was sufficient for a meal for two labourers, a good meal for one person cost one penny;
“crowdie” was boiling water and oatmeal, in same proportions as in the “hasty pudding”, but eaten with milk or butter;
“furmenty” or “barley milk” was barley with the husks taken off, boiled in water for two hours, and mixed with skimmed milk;
potatoes were eaten roasted or boiled, with butter, or cut into small pieces and eaten with butter, or fried with bacon;
“lobscouse” was a hash made from potatoes, finely cut meat, with pepper, salt, and onions.
He further gives some information about different types of bread:
in Cumberland they ate barley bread, in unleavened cakes of half an inch thick and twelve inches in diameter, or leavened in loaves weighing 12 lb.;
“thar-cakes”, which were the same as bannocks;
“clapbread”, thin hard cakes, baked on a “girdle” over a fire (16 lbs. of meal were enough for a labourer for a fortnight, costing one shilling per week);
“kitcheness bread”, thin oat cakes;
“riddle cakes”, thick sour cakes;
“hand-hoven bread”, as described above;
“jannock oaten bread”.
The consumption data from Sir Fredrick Eden’s table show that in the North the people took a lot of milk, but in the South practically zero. This is due to the fact that with the Enclosures, the labourers in the South lost their area of pasturage, and thus could not have a cow.
To illustrate the financial effects of the low cost of the inferior cereals, we give cases from David Davies’ correspondents in the county of Durham:
Consumption of bread and meat per family per week:
No. 1, 7 pers.
No. 2, 7 pers.
No. 3, 6 pers.
No. 4, 5 pers.
No. 5, 5 pers.
Rye flour units 4 lb. (*)
7
7
5
3
3
Wheat flour units 4 lb. (*)
2 ½
2 ½
2 ½
2 ½
2 ½
Oatmeal units 4 lb. (**)
3
1
3
3
3
Potatoes lbs.
10
10
10
7
7
Meat or bacon lb.
1 ½
1 ½
1 ½
2 ½
2 ½
(*) 4 lb. of flour gives 5 lb. of baked bread
(**) 4 lb. of oatmeal gives 8 lb. of thick porridge
The calculations exhibited are too conservative:
they do not include income for the man for task-work, hay season, or harvest season (at least 10 Pounds a year);
they show the annual outgoings (rent of house, fuel, clothing, lying-in) with the same figure as Barkham, Berkshire, but we know that “fuel cannot be got cheaper in this county, as coals only are used” (text of the other example from Durham), which was due to the nearness of the Durham Coalfield;
equally, the clothing figures should probably be lower than in Barkham, as the families in the North, according to Sir Frederick, usually bought second-hand or sewed the clothes themselves.
Thus all the families have in fact yearly “exceedings” of from 5 to 15 Pounds a year. Note the comment on the second page, that “I know many families who are industrious, pay their credit, and live comfortably on seven shillings per week”.
Sir Frederick further feels that the labouring families in the North have economic advantages from their style of life, because:
they can use more fuel for cooking food, as the fuel (coal) is cheaper;
they eat more and richer soups;
they use more milk, for their oatmeal dishes;
for liquid refreshment, they do not take much tea, but rather water, whey, milk, or milk with water;
the wives of the workers make the clothing themselves, that is, they spin, weave, and cut to size, instead of (in the South and Midlands) buying the clothes ready-made in the village shops.
We see that even if the cost of oats doubles (as it did in the years of scarcity), this labourer and his family, will still be able to eat sufficiently. In general, in the agricultural parts of the North, there were a few years in which the farm workers suffered from lack of food, but this was not due to the excessive cost of cereals in comparison to the wages, but rather to the fact that there really was not enough cereal food.
This inspection of the data from County Durham gives us two important arithmetical lessons:
The comparative level of sufficiency or poverty between counties at a given date, is not given by the figures for weekly wages, but by the weekly wages minus the weekly cost of consumption of bread or cereal, taking into account the types of ceral in each county;
The effect of the extreme percentage increases in cereal costs in the years of scarcity, is considerably less, where the population has been used to – and continues to – eat one of the “inferior cereals”.
Mr. Jonas Hanway was a philanthropist, active in the second half of the 18thcentury, and also Commissioner for Victualling the Navy from 1762 to 1783. In this second position, he would have been very well informed about the production and consumption of foodstuffs. The food situation in London in 1767 was more than sufficient:
“What think you of 1400 oxen, rendering each 6 ½ C. [hundredweight] of the eatable part; 13,000 sheep, of 84 lb. each, the eatable part, with a quantity at least equal to the mutton, in pork, veal, poultry, and pigs, sold weekly at Smithfield and the shops, for the use of these cities [City of London and Westminster]? Supposing 700,000 inhabitants, men, women, and children, old and young, sickly and healthy, it comes to a fraction above seven ounces each per diem.
This is a quantity brought to one place, which one would imagine enough to impoverish the richest country on earth; and is, I suppose, more than thrice as much as is consumed by the same number of people on any spot on this globe; and it would not be credible, if it was not well known that the computation in a private family in affluence is 1 ¼ lb. or 20 oz. each, and that allthe people covet to eat meat.”
(Hanway, 1767, Letters on the Importance of the Rising Generation…. , Vol. II, pp. 191-192)
“Consumption of Provisions
There is one cause of the general salubrity of London that leads us to its consumption of food. Perhaps no city exists in the world, where the labouring people, and certainly where the middling classes, enjoy so large a share in the necessaries and inferior comforts of life, as in this metropolis; and that liberality of condition is no doubt a powerful agent in the health, as well in the happiness of a people. The great quantity of animal food consumed in London is proof of the liberal condition of the bulk of the inhabitants; for though there are wealthy persons who waste a great deal of animal food, in the composition of certain dishes, yet their number is so small, that the waste is not to be taken for much in comparison with the whole consumption.
Animal food
The number of bullocks annually consumed in London is 110,000; of sheep and lambs, 776,000; calves, 210,000; hogs 210,000; sucking pigs, 60,000; beside other animal food.
It does not, however, give a perfect idea of the immense concentration of animal food in London, to speak only of the number of bullocks and other animals, brought to the London market; their size, and fine condition, should be seen by a stranger, to enable him to judge of its extent. Improvements in the breed and feeding of bullocks and sheep, have within the last 45 years, added, at least, one-half to the former average weight of these animals. The present average weight of bullocks, is 800 pounds each; sheep, 80; and lambs, 50.
Milk
The quantity of milk consumed in London is the astonishment of foreigners; and yet few strangers have even a suspicion of the amount of that consumption, which is not less than 6,980,000 gallons annually. The number of cows kept for this supply, is 8,500; ….
Vegetables, and Fruit
There are 10,000 acres of ground, near the metropolis, cultivated wholly for vegetables; and about 4,000 acres for fruit, to supply the London consumption. The sum paid at market for vegetables, annually, is about £645,000; and for fruit, about £400,000. …..
Wheat, Coals, Ale, and Porter, &c.
“The annual consumption of wheat in London, is 700,000 quarters, each containing eight Winchester bushels; of coals, 600,000 chaldrons, 26 bushels in each chaldron; of ale and porter, 1,113,500 barrels, each containing 34 gallons; spirituous liquors and compounds, 11,146,782 gallons; wine, 32,500 tons; butter, about 16,600,000 pounds; and of cheese, about 21,100,000 pounds. ……”
(R. Phillips, The Picture of London for 1802, Lewis & Co., London, pp. 16-18)
The 110,000 bullocks, at a carcass weight of 800 lb., and subtracting 20 % for skin, bones, and offal, and dividing by a population of 1,100,000, give 64 pounds per person per annum. The sheep and lambs are 40 pounds per person per annum; the calves 14 pounds, and the hogs 23 pounds. This gives a total of 77 pounds per person per annum. The milk is 1.0 pints per person per week. The wheat is 300 pounds (0.64 quarters) per person per year, equal to 6.7 quartern loaves per family per week. The ale and porter is 25 pints per family per week. Butter is 1.45 pounds per family per week (4.5 oz. per family member per week), and cheese 1.85 pounds (6 oz.).
In London in 1850, the working classes bought a large variety of food on Saturday evenings:
“Whoever would know how the working classes spend their earnings on a Saturday evening in London, should pass an hour in any one of about half a dozen localities graphically described by Mr. Mayhew. One of these is Shoreditch, near the church; another is the New Cut in Lambeth; a third is Whitecross Street; a fourth is the line formed by Skinner and Brewer Streets, Somers Town; a fifth is Tottenham Court Road and the lower part of the Hampstead Road; a sixth is Leather Lane, Holborn. As the hour approaches when artisans receive their weekly wages, so do the itinerant dealers take their stand in these and similar busy localities. There is occasionally a battle of opinion with the police concerning the propriety or otherwise of this open-air trading; and in some cases where the higher classes of shopkeepers deem their dignity offended by the vicinage of the humbler traders, an explosion of feeling may perchance occur; but the retail shopkeepers and the kerb-stone stall-keepers generally agree pretty well; the influx of customers is so vast that there is trade for all.
It would be impossible to name all the wares exposed for sale at these places on a Saturday evening, say from six till twelve. The wife of the journeyman, as soon as a portion of the week’s earnings is placed in her hands, bethinks herself of the Sunday’s dinner; and the theory of these people’s bazaars is, that everything that may be wanted can be obtained near at hand. Certain of the commodities are not sold by the humble stall-keepers; butcher’s meat, bacon, and grocery are rarely seen on the stalls; nor do bread and flour make their appearance there; the shops occupied by butches, bakers, grocers, and cheese-mongers, experience very little rivalry from the stalls. Cheap poultry sometimes finds its way thither; but cheap fish much more largely. How many “fine fresh mackerel” we may obtain for a shilling; how many “fresh herrings” for a groat (a groat, curiously, is never mentioned by a London dealer except in connection with herrings); how many “pairs of live soles”, or platefuls of sprats, or pounds of eels, or quarts of mussels, or measures of periwinkles, for a few pence, would astonish housewives whose means enable them to make their marketings in other localities. True it is, that the odours are not quite satisfactory, revealing the fact that the fish have been out of water for rather a serious length of time. Vegetables are in unquestioned abundance. Potatoes in their dirty jackets, cabbages of monster size, greens in straggling bunches, onions in arm-length strings, peas and beans and scarlet runners, if they be in season and cheap enough; parsley and celery, mint and sage, carrots and turnips, rhubarb, broccoli, cauliflowers, asparagus (or, in Cockneydom, “sparrowgrass”), chickweed, groundsel (that the bird may have a Sunday dinner as well as his master), – all are sold so cheaply, that we may reasonably wonder how such articles, many of them bulky, can return any profit to those who have to trudge with them from Covent Garden or other markets.
The cheaper kinds of fruits are sold by those stall keepers in immense quantity. Apples, pears, oranges, nuts, walnuts, chestnuts, cherries, plums, damsons, currants, gooseberries, disappear from the stalls with great rapidity. Nor is there any want of the humanizing influence of flowers, if the season be such as to bring flowers within the range of cheapness.
Then, as provision is made for the Sunday meal, so are the means of cooking it not forgotten. The stall keepers, with candles in paper lanterns, candles on the end of sticks, links, torches, and a sort of self-generating gas lamp, display in a flickering light, all sorts of spits, ovens, roasting jacks, gridirons, frying-pans, bachelors’ kettles, toasting-racks, toasting-forks, footmen, trivets, saucepans, stew-pans, tea-kettles, crocks and pots, baking dishes, pie-dishes, pudding-basins, sugar-basins, plates, cups and saucers, salt cellars and pepper-casters, iron skewers, cabbage neat – all of these may be met with, or such of them, at least, as can possibly be made at a cheap price. A joint of meat, a huge cabbage, a quartern loaf, and a saucepan, sometimes march off in procession, under the care of different members of a working man’s family.
Not the least remarkable among these Saturday evening traders are those who deal in little savoury knick-knacks that may serve for a supper, or for a penny treat to the errand-boy who has just received his weekly wages. At one point is the “baked ‘tato” man, with his brightly polished, hot and steaming, tripedal or quadripedal apparatus, redolent of large potatoes and strong butter. Near him is the vendor of hot pies – mutton, eel, veal, beef, kidney, or fruit – all at a penny. A little further on is a table decked out with saucers, containing hot stewed eels, sold in pennyworths, or even in still smaller quantities. The periwinkle man is near at hand, with his half-pint measure of doubtful capacity. The stall of another dealer displays certain meat-like attractions, which prove to be pig’s chaps and pig’s trotters; and probably sheep’s trotters are there likewise. Baked chestnuts appear to have come somewhat into favour lately in London; and the oven or stove of the vendor of such comestibles may very likely be met with in these street bazaars. It is just possible that a coffee-room al fresco may present itself to notice. Innumerable varieties of confectionary and even “sweet stuff” are spread before the boys and girls, the chief customers for such things. The ginger-beer man, either with his penny bottles or his majestic apparatus on wheels, is ready to supply the wants of thirsty souls.”
(Dodd, 1856, Ch. XII Remarkable Aspects of Food-Retailing in London, Saturday Evening Dealings, pp. 515-518)
A very complete report of the food quantities available in London in 1851 is given by: “London Commissariat”, Quarterly Review, July-September 1854, Vol. 95, pp. 271-308. It includes 322,000 oxen, 1,639,000 sheep, 101,000 calves, 127,000 pigs brought in live (driven in by road, transported by rail, and imported from Holland). Further, the equivalent in animal numbers, of the country-killed meat, brought by rail: 161,000 oxen, 510,000 sheep, 31,000 calves, 159,000 pigs.
The above data show that the people in general ate enough cereals in the period from 1815 to 1860, and they ate considerably more meat in 1860 than in 1770.
But it is better than this. The people in 1860 did not need so many calories as in 1770 or 1820. The proportion of people in agriculture decreased, the number in small industry and services increased, and the majority of men and women in industry did not work physically very hard. That is, they did work long hours and in bad conditions, but their daily requirement of calories and of protein for their bodily movements was not excessive. In the textile factories, once the power loom was introduced, the only “muscular” work was that of moving the larger hand mules, unpacking the fibres and packing the cloth for sale. The workers in the mines had easier working conditions than before, and the coal was not brought to the surface on the backs of the women. Starting in 1840, certain sections of the people took railway transport, and did not expend energy in walking long distances. The persons with the hardest physical work were the “navvies”, the miners, and the washerwomen.
(see Clark, Huberman, Lindert, 1995, Section IV, pp. 225-229)
If we are worried about the arithmetical possibility that the food consumed by the workers was not sufficient to give the calories to carry out their daily work, we can refer to visual descriptions.
The workers transported to Tasmania as punishment for their part in the Swing Riots were strongly built:
“Scattered among the letters of commendation and petitions for mercy lodged with the Home Office in respect of many of the rioters were references to their impressive physical attributes. James Martin, a Hampshire ploughman transported on the Proteus, for example, was described in a letter from the Reverend Harvey Ashworth as “a man of great bodily strength.” Equally, in his surgeon’s report of the voyage of the Proteus, Dr Logan makes it clear they were sturdy stock. He described the 35 year old Huntingdonshire ploughman William Hughes as “a tall, broad-shouldered heavy country man .., always gifted, according to his account, with perfect health.” And Thomas Gregory, the 33 year old Hampshireman was described as “a short but well made man. He was a carpenter by trade and had always been employed in the country. He had never been subject to chest disorders before.” Even a truly ill machine breaker like John Simon Clark was described as “of a slender but not delicate frame of body. Previously to joining the Rioters he had always dwelt in the country. He had been brought up to farm labour.. and previously had excellent health.” A Port Phillip settler a few years later described the Hampshireman John Hopgood as Big Jack, “… a big burly Englishman sent out to Tasmania as a convict about the year 1831 for machine breaking.” Finally, John Capper, the superintendent of convicts at London Docks is reported, after having inspected the Eliza before she sailed, to have claimed “he never saw a finer set of men”».
(Bruce W. Brown, The Machine Breaker Convicts from the Proteus and the Eliza, 2004, p. 74)
There are few physical descriptions of working men which mention the fact that they are small or thin. In general, these are due to the extreme physical exertion or long hours of work. Thus we may suppose that the great majority of the men had normal physiques. The exceptions found by your author are: adult cotton workers in the Manchester area from 1815 to 1830, silk workers in Spitalfields from 1825, hosiery workers from 1820, dressmakers and seamstresses in London from 1840, nail and chain workers in the Black Country. For all the nineteenth century, the men cotton workers in the Manchester were about 2 inches shorter than the normal, were thin, had the skin tight over their bones, and had a sallow colour of the skin; but they were not ill or weak.
There are no chronological data for the consumption of different types of food during the Industrial Revolution. Thus it is impossible to quantify the standard of living at given dates, or comment on the possible improvements in the same.
This paper reports the consumption of meat in Great Britain on some dates from 1800 to 1880, using the estimated numbers of animals (cattle, sheep, pigs), the estimated unit weights of the animals (carcass weights), the proportion killed in one year, and (from 1840) the imports of animals and of meat. All the figures used come from contemporary sources.
The amounts increase from 3.5 ounces per day in 1801 to 4.9 ounces per day in 1880. In 1801 only London and the Northern Industrial Towns ate more than 5 ounces per day; around 1860, all the families, except the agricultural, ate about 5 ounces (weights of meat “on the bone”)
Table A.15. Chronological Development of the Per Capita Consumption
Region
Definition
Year
Source
Total Pounds
Population
Pounds per Population per Year
Ounces per Person per Day
Millions
Millions
England and Wales
Domestic
1801
Turner
702
9.0
78
3.5
England and Wales
Domestic
1808
Arthur Young
711
9.0
79
3.5
Great Britain
Domestic
1808
Arthur Young
727
10.8
67
3.0
England and Wales
Domestic
1854
Poor Law Board
1,297
18.6
70
3.1
England and Wales
Domestic+ Imports
1854
Poor Law Board
1,793
18.6
96
4.3
Great Britain
Domestic
1854
Poor Law Board + Highland Society
1,560
21.6
73
3.3
Great Britain
Domestic+ Imports
1854
Poor Law Board + Highland Society
2,076
21.6
96
4.3
Great Britain
Domestic
1866
Agricultural Census / Craigie
1,867
25.3
74
3.3
Great Britain
Domestic + Imports
1866
Agricultural Census / Craigie
2,736
25.3
108
4.8
United Kingdom
Domestic
1866
Agricultural Census / Craigie
2,471
30.0
82
3.7
United Kingdom
Domestic+ Imports
1866
Agricultural Census / Craigie
2,970
30.0
99
4.4
Great Britain
Domestic
1880
Agricultural Survey
1,910
29.4
56
2.5
Great Britain
Domestic+ Imports
1880
Agricultural Survey
3,570
29.4
121
5.4
United Kingdom
Domestic
1880
Agricultural Survey
2,703
34.6
71
3.2
United Kingdom
Domestic + Imports
1880
Agricultural Survey
3,833
34.6
110
4.9
Table C.3. Division of total consumption by regions and occupations, 1810
Approx. 1810 Group
Population
Pounds /Family/Week
Total Pounds/Year
London
1,300,000
17
(a)
230,000,000
Industrial Regions (Lancashire, West Riding, Warwickshire)
1,900,000
10
(b)
198,000,000
Agricultural Laborers
3,500,000
2
(c)
73,000,000
Farmers, Families,Indoor Servants
1,000,000
2
(d)
21,000,000
Professional
200,000
6
(e)
12,000,000
Domestic Servants
200,000
(*) 0.5
5,000,000
Soldiers, Sailors,Merchant Sailors
300,000
(*) 4.0
(f)
63,000,000
Skilled Workers
500,000
6
(g)
31,000,000
Common Laborers, and without fixed employment
1,900,000
1
20,000,000
Pounds/Person/Week
Total Great Britain
10,800,000
1.1
622,000,000
Ounces/Person/Day
2.5
Pounds/Family/Week
5.5
(*) Amount given is pounds/person/week
All groups apart from “London” and “Industrial Regions” refer to the persons in these occupations, living geographically outside London and the Industrial Regions
“London in 1802”, see below
Manchester, Liverpool, Sheffield, Leeds, source = Hides and Skins Tax
David Davies, Sir Frederick Eden
“Most of the farmers that are not very poor, are in the practice of purchasing some joint of butcher’s meat, for the Sabbath day at least; but as pork is known to afford the cheapest subsistence, it is seldom omitted at a farmer’s table;”, General View of the Agriculture of the County of Bedford, Thomas Batchelor, Expense and Profit of Arable Land, p. 75.
María Eliza Rundell, A New System of Practical Domestic Economy: Founded on Modern Discoveries, and the Private Communications of Persons of Experience. A New Edition, revised and enlarged, with Estimates of Household Expenses, adapted to Families of Every Description. p. 387 et seq.
1 lb. beef rations or ½ lb. pork rations per day
Sir Frederick Eden, common occupations
Table C.4. Division of total consumption by regions and occupations, 1810 (compressed)
1801-1808 Group
Population
Pounds /Family /Week
TotalPounds /Year
London
1,300,000
17
194,000,000
Industrial Regions (Lancashire, West Riding, Warwickshire)
1,900,000
10
166,000,000
Agricultural Laborers and Farmers
4,500,000
2
78,000,000
Rest of Great Britain
3,100,000
4
117,000,000
Total Great Britain
10,800,000
5.5
622,000,000
Table C.5. Division of total consumption by regions and occupations, 1850-1860 (compressed)
a
1850-1860Group
Population
Pounds /Family /Week
TotalPounds /Year
London
2,500,000
17
437,000,000
Industrial Regions (Lancashire, West Riding, Warwickshire)
3,800,000
9
355,000,000
Agricultural Laborers and Farmers
2,300,000
3
71,000,000
Rest of Great Britain
13,000,000
9
1,213,000,000
Total Great Britain
21,600,000
9
2,076,000,000
INTRODUCTION
In a perfect world, we would have a time series of the meat eaten, either given explicitly by reports from the period, or through own calculation from a few data; we would also like to have numbers in different wage or social groups, so as to approximately see if the amount of meat was enough for a decent life.
But there are no academic studies, or reports written in the nineteenth century, which give us the production, imports, total consumption or per capita consumption, for the country. There are some general data for the years 1800 and 1850, which give a pessimistic calculation of these parameters.
This situation has given rise to the ideas:
The people had an insufficient consumption of meat for their biological necessities, in the period 1800 to 1842 (liberation of imports), because the domestic production was low, and imports were not permitted;
The people had an insufficient consumption of meat for their biological necessities, in the period 1842 to about 1870, because the domestic production was low, and the imports from Europe and the Rest of the World were not enough;
The situation from 1870 onwards, was of sufficient meat and this improvement was caused by massive imports from the United States, and other countries outside Europe.
Arthur Young, in 1771, wrote that “It may be said, that wheaten-bread, that beef, that mutton, that tea, that sugar, that butter, are dear; but do not, in the heat of the argument, jumble these and the necessaries of life together.” (The Farmer’s Letters to the People of England, Vol. 1, Letter V, The Present State of the Poor, p. 205). He also asked some labourers to tell him what they ate. In one case, a family of five, in a week eats half a pound of fat meat; in another case, the family eats no meat (op. cit. pp. 196-197, p. 202).
But in 1787, the situation appears to have improved: “In England, the consumption of meat by the labouring poor, is pretty considerable; …” (Arthur Young, Travels during the Years 1787, 1788, & 1789;… the Kingdom of France; vol. 1, p. 443)
(Aiken, 1795, Bolton, p. 261)
(Pitt, 1806, p. 286)
All the figures in this investigation come from sources of the late eighteenth or of the nineteenth century. They are either officially reported figures, or quantitative verbal expressions by experts of the time. These last are certainly valid, because THOSE PEOPLE WERE THERE, AND WE WERE NOT THERE.
The real conditions during this this period were:
There was a considerable increase in the amount of meat eaten in England from 1770 to 1790;
In the decade of the 1800’s, the populations in London and in the Northern Industrial Towns ate well (10 to 17 pounds of meat per family per week), and the professional persons and the skilled workers ate about 6 pounds, but the rest of the population ate only 2 pounds;
By 1854, all of the population ate about 9 pounds per family per week, except the agricultural families, who still ate 2 pounds per week;
9 pounds of meat per family per week, corresponds to the content of a McDonald’s quarter pounder for the father of the family;
The major part of the increase per capita was due to the imports from Ireland and from Northern Europe (300 million pounds per year);
Imports of livestock from the United States only began in 1877.
PREVIOUS INVESTIGATIONS
The attempts until now have been of two forms, as it were: “top-down” and “bottom-up”. The “top-down” processes take some estimates of number of livestock in the country, multiply by a factor giving the proportion of animals killed in each year, multiply by the edible weight per animal, divide by the population of the country, and divide by the number of days in the year. And thus we have the average consumption of meat per person per day. The calculations are usually made for “round years”, e. g. 1750 or 1770, 1800, 1850. The estimates of numbers of animals are rough; the first physical counts are those of the Agricultural Statistics of 1867.
The “bottom-up” processes use a number of “family budgets”, which give reported earnings, expenses, and food consumptions of identified families or groups of families, on practically random dates. The problem with these data, is that we do not have an idea, how representative the families are of the total population of the country, and therefore we cannot construct an average figure of meat consumption. A further complication is that the data for the earnings, expenses and food, are generally from “interesting occupations and income levels” or from “interesting dates”.
Another form of “bottom-up” is to take contemporary data, or estimates, of total meat consumption, for given regions or for given occupations. We can then sum the different positions to give an estimate for the total of the country, and show the breakdown by regions and occupations.
The estimations of ounces/head/day in England, findable in academic research, are:
The present investigation gives us the following figures of ounces/head/day for England and Wales:
Turner: 1801 = 3.5;
Young: 1808 = 3.5;
Income Groups: 1810: 2.7;
Poor Law Board: 1854: 4.3.
And for Great Britain, ounces/head/day:
Young: 1808: = 3.0;
Poor Law Board and Highland Society: 1854: 4.3;
Agricultural Census: 1866: 4.8;
Agricultural Survey: 1880: 5.4.
(including imports, where applicable)
The generality of academic books on living standards in the Industrial Revolution do not give many statements as to: the amount of meat eaten per capita, if this increased or decreased, and what was the distribution between the occupational classes. The general impression given, is that “the poor went hungry”, or that “the labouring classes went hungry” (the two statements are not equivalent).
Four different approaches that have been used to estimate the consumption of meat are:
Estimate from contemporary investigations at given dates, the numbers of each type of animal, the percentage killed each year, the average weights, and thus by multiplication give the total weight per year; this figure is divided by the population to give the average consumption per person (the resulting figures are given above).
Allen, 2005, Tables 2 and 6;
Broadberry, 2011, Table 3, p. 32;
Floud, Fogel, Harris, Hong. 2011, Table D.4, p. 210;
Muldrew, 2011, Table 3.15, p. 154.
Harris, Floud, Hong, 2015, p. 73.
The “Cambridge Economic History of Modern Britain”, Chapter 4, “Nutrition and Health”, by David Meredith and Deborah Oxley, gives us the following information with respect to England and Wales:
– calories per capita at 1800 and at 1850, according to 6 different investigators;
– ounces of meat per week in Davies and in Eden (1790’s);
– the investigation by the Poor Law Commissioners in 1834, which showed that meat was consumed in only one-half of the parishes, and then only occasionally;
– a short statement as to Dr. Edward Smith’s survey (1863) of food consumption by 509 agricultural labourers and 125 low-income indoor workers in all Great Britain;
and some statements by contemporary investigators that often in a family only the father would eat meat.
“The bottom line was that by the 1860s household calories were woefully short, and where men ate meat, children went largely without milk, and women drank tea.” (p. 134)
“Plenty and Want” by John Burnett, gives us, inside the section “1800 to 1850” (17 pages) an exhaustive list of the types of food eaten, by which groups of the population, and – in many cases – approximate numbers of the amounts. For meat consumption, he gives us only 3 pages, and these not with chronological information. The reason, as he tells us, is that there are very few data to be found. He does say that “for the poorer – and larger – part of the nineteenth-century population, regular meat-eating was a luxury, the sure sign of a comfortable standard of living enjoyed only by artisans and the other well-paid workers.” The only number for per capita consumption he can give us, is 72 lb. in 1850 for the United Kingdom.
Emma Griffin in her article “Diets, Hunger, and Living Standards in the Industrial Revolution”, published in “Past and Present”, wishes to show that the monetary measurement of living standards does not have to proceed only through calculation of real monetary wages (inflation-corrected wages). Using reported family budgets, she gives us information about the incomes and the income/expenses ratios for agricultural workers in the 1790’s and in the 1840’s, and for mining workers and for manufacturing workers in the 1840’s. The agricultural workers do not experience much change from the 1790’s to the 1840’s, as their proportion of food expenses to male laborer’s income remained at about 75 %. The mining workers had in the 1840’s a proportion of 50 %, and the manufacturing workers had a proportion of 60 %; this clearly leaves a monetary amount for the purchase of many goods. The disadvantage of this method of presentation, is that that we do not know how many pounds of bread and of meat each family eats per week, and so we do not know if they are eating enough.
Additionally, Richard Perren in his article “The Meat and Livestock Trade in Britain, 1850-70” (1975) gives estimates of decadal consumption of meat in the United Kingdom, for which he used numbers from different sources, but does not inform about the procedures or definitions. The figures are close to those in this paper: 1841-50 = 82.5 pounds/person/year, 1851-60 = 83.8, 1861-70 = 90.0, 1870-74 = 108.3, 1875-79 = 111.0 (see Table B.1.).
From the nineteenth century, we have estimated per capita consumption for the United Kingdom from Mulhall, 1892, Dictionary of Statistics (Figure 9): 1811-30 = 80 pounds, 1831-50 = 87, 1851-70 = 90, 1871-80 = 93.
It is important to note, that in Scotland from 1750 to 1800, practically no meat was eaten, except by the better classes; but by 1850, the consumption in Scotland was very close to that of England and Wales. Thus, the percentage increase in Great Britain was greater than the percentage increase calculated for England and Wales.
On the other hand, in the period up to 1850, large numbers of cattle and sheep were brought yearly from the Scottish Highlands to England; but we do not have any idea of the yearly quantities. Therefore we cannot calculate or estimate the amounts of animals raised and eaten in England and Wales; we can only calculate or estimate the numbers for the total of Great Britain. (Imports from Ireland to Great Britain do not constitute a problem, as we have the harbor arrivals).
METHODS AND GENERAL INFORMATION
In each calculation, the total weight for the whole country uses the numbers of animals taken explicitly from contemporary sources, multiplied by the unit weights of the animals. From 1867 onwards, the numbers of animals are taken from the Agricultural Census (physical count).
The calculations in the “previous investigations” start by multiplying the numbers of acres used for the animals, by the density of animals per acre; but these two inputs are both only estimates.
In some cases, the total weight for the country is compared with the sum of total weights of regions and/or occupations.
The unit weights that are reported in our sources from the nineteenth century are to be found in Table B.1.
For the calculations of total weight per year in the whole country, at different dates, we use the unit weights as in Table B.2.
All the figures given in the nineteenth century for sales of livestock wholesale are in terms of “carcass weight”. The carcass (generally two half-carcasses) was the body of the dead animal, less head, skin and offal, such that it could be given to the butcher to divide it into “cuts”. The carcass included the bone structures, which were/are about 40 % of the dead animal. Thus the calculations of the meat actually eaten, and of the corresponding calories, should start from 60 % of the carcass weight. The statements in this investigation also use the carcass weight.“…. and when we remember that this [calculation of 170 lb. consumption in London] includes the bones as well as the meat, half a pound per day is not too much to allow to each person.”(Youatt, 1834, p. 257). Equally, the retail sales from butcher to consumer, were on the basis of “meat on the bone” or chops. This means that the actually eaten proportion was from 90 % (“better class” customers) to 70 % (poorer customers). In this case as well, the statements in this document refer to the gross weight. (See: Dr. Edward Smith, 1865, p. 77)
SOURCES AND DATA
The first “somewhat useful” numbers of livestock that we have, are of 1801, and come from the Livestock Census, which was ordered by the Government as a precautionary step, for the case that there might be a French invasion. The documents that we have today refer only to 8 counties.
The data have been revised, adjusted to the total of counties in England, and commented by Michael Turner in: Counting Sheep: Waking Up to new Estimates of Livestock Numbers in England c. 1800; The Agricultural History Review, Vol. 46, No. 2 (1998), pp. 142-161. The numbers of stock as presented by him are as below. The block of calculations gives an estimate by this author, using numbers for the proportion killed annually and of average weight per carcass, of the amounts of meat available for human consumption.
But, referring to the sheep, and specifically for this investigation, we have to take into account that – at this date – not all the sheep that were killed or died, were used for mutton for human consumption. For centuries past, and up to 1770, the farmers used the sheep basically for producing wool, then for tallow (candles and soap), and a little for meat for butchers. The sheep had been bred to bring the maximum of wool, and thus there was no interest in improving the weight and meat quality of the animal. Only starting in 1770, with the new breeding methods of Bakewell and others, was an increased flesh amount of the sheep possible (Prothero, 1912, p. 177).
But even in 1800, there was little consumption of mutton. In the totality of the texts of Davies and of Eden, which report on the agricultural and working classes, there is no mention of anyone eating “mutton” or “lamb” (checked using Google). The rations for the Army and the Navy were beef and sometimes pork. The only references to eating mutton are in literature and in diaries of the better class, and in one information by Arthur Young:
“Gentlemen who are curious in their meat, and think a great plenty of claret-coloured gravy an excellence, may breed for it, as they do deer in their parks; but the great mass of mutton eaters, which are in the manufacturing towns, will forever chuse [sic] the fattest meat, and give the greatest price for it.” (Young, Annals of Agriculture, Vol. 6, 1786, p. 479)
The only figures that we have for delivery of sheep for meat are: i) 820,000 per year to London (the richest part of the country) in 1802, and ii) 200,000 to 240,000 for the northern industrial towns in 1800-10. It is not clear which other population groups would be consuming mutton or lamb. Thus the amount of meat from sheep which was eaten around 1800, might be at a maximum 2,000,000 animals.
The next source is the agricultural writer and researcher, Arthur Young, in 1808.
“….. for on the average of the last six years, London has consumed 123,000 oxen, and 827,000 sheep. Taking the first at 800 lbs. and the latter at 80 lbs. it will make 164,000,000, which for 1,000,000 of people, is 7 oz. per head per diem. Meat brought by carriers, and pork, will make it more than half a pound per head. Suppose 2,000,000 of the people not to consume meat, and deduct 1,000,000 for London, and that the remaining 6,000,000 consumed half as much as London, or one-quarter of a pound per day, the amount will be 547,500,000 lbs., and London included it will be 711,000,000 lbs., ….”
(Young, 1808, p. 402)
1808. Stock. Arthur Young. Cattle 1.968, Sheep 13.200, Pigs 0.360, Total 15.528. (millions)
Total Volume 1854
In 1854, a livestock census was carried out, in 11 counties in England and Wales (by the Poor Law Board), and for all the counties in Scotland (by the Highland and Agricultural Society). The Poor Law Board adjusted the England and Wales numbers, to estimates of the whole country, in function of the areas of the counties.
The process and the resulting numbers for England and Wales are presented in: James Lewis, 1866, pp. 393-429; see table on p. 409, which gives the figures for 1854 (see Figure 2).
1854 Stock. Poor Law Board. Cattle 3.4, Sheep 18.7, Pigs 2.4, Total 24.5. (millions)
The numbers for Scotland are to be found in Agricultural Statistics of Scotland.
1855. Transactions of the Highland and Agricultural Society, July 1855 – March 1857,
pp. 201-222, table on page 209. See Figure 3.
1854. Stock. Highland and Agricultural Society. Cattle 1.0, Sheep 5.7, Pigs 0.1. Total 6.8. (millions)
The 1854 Great Britain Domestic Production was from:
1854. Poor Law Board and Highland and Agricultural Society. Cattle 4.3, Sheep 24.3. Pigs 2.8. Total 31.2. (millions)
Imports 1854
From Ireland 500,000 animals were imported in the year (131 million pounds weight), and from the Rest of World 307,000 animals (70 million pounds).
The stock in 1866 of Great Britain domestic production, copied from the Agricultural Census was
1866 Stock. Agricultural Census / Craigie. Cattle 4.8, Sheep 28.9, Pigs 2.5, Total 36.2. (millions)
1866 United Kingdom domestic production was also taken from the Agricultural Census.
1866 Stock. Agricultural Census / Craigie. Cattle 8.6, Sheep 33.8, Pigs 4.0, Total 46.4. (millions)
Imports
From Ireland 1,200,000 animals (325 million pounds) were imported in the year, and from the Rest of the World 700,000 animals (140 million pounds).
Importations of Cattle and Sheep in the Years 1850 to 1859 inclusive.
“Had it not been for the increased supply and improved quality of the animals imported from Ireland, the price of butchers’ meat in London would have been much higher even that it now is. The old Irish herds of animals of all kinds have been supplanted or crossed with the best English breeds to so great an extent that the Irish graziers can now successfully compete with those of England in the size and quality of either cattle, sheep, or swine. Some Irish oxen having sold at Smithfield at from L 31 to L 37, and sheep from 50s. to 65s. per head.
William Waterston, A Cyclopaedia of Commerce, Mercantile Law, Finance, Commercial Geography, and Navigation, 1863, “Cattle Trade”, Supplement, p. 49.
The numbers of animals for 1880 are taken from the Agricultural Survey of that year. (see Figure 7)
1,800,000 cattle, sheep and pigs were imported live from Ireland in the year (500 million pounds).
1,400,000 animals were imported from the Rest of the World (550 million pounds), of which 230,000 animals (100 million pounds) from the United States, starting in 1877.
Imports dead meat
Scots cattle were imported over the drove roads in all Scotland, and sold at the Falkirk Tryst. Smaller numbers were sent from Galloway, and crossed the border at its western point. Another route was from Aberdeen, which was later changed to steamships to London, and then a direct railway connection. The animals were walked to Norfolk, where they were fattened on the pastures, and then taken to London, where they were slaughtered. We do not have any reports of the total number of Scotch cattle entering England each year, but it was probably between 100,000 and 150,000.
Ireland exported large quantities of ham, bacon, and sausages, but we do not have reliable figures. From the Rest of the World (principally the United States), 100 to 200 million pounds of bacon, hams, beef, and pork were imported.
MEAT CONSUMPTION FROM 1770 TO 1800
It is difficult to ascertain how much meat was eaten by the inhabitants of the countryside before 1790, as there are no descriptions of the life of the people in this sense, or surveys of their incomes and expenses. One indirect source is: William Ellis, The Country Housewife’s Family Companion, 1750. This gives a large number of hints and processes to run a farm and farmhouse efficiently (the author lives in Hertfordshire). About one half of the book is given over to recipes. Practically all the meat referenced comes from pigs – which we may suppose run free in the farm area, or around the cottage of a peasant – and is bacon, pickled pork, and hams. The consumption would be from one to two hogs yearly per family. Cows are used for giving milk, and for bearing calves. There is no mention of oxen or of beef; this is to be expected, as only the large farms, or the properties of the rich, would have the resources to feed the oxen.
James Hanway, the philanthropist and founder of the Maritime Society, in 1767 calculated the living expenses of a single “poor man”. These included for meat:
4 ounces per day x 6 days = 1 ½ lb. per week
(Hanway, 1767, Vol. II, pp. 100-101)
Arthur Young, in 1771, made a theoretical calculation of the living expenses of one “stout man” of the working class, and his family.
The amount for meat was 3 oz. lean beef, plus 2 x ¼ lb. fat meat = 11 oz./week = 1 ½ oz. /day/man. This corresponds to ¾ oz. /day /average family member.
(Young, 1771, pp. 196-197)
As these seemed to him to be on the high side, he also enquired directly of four agricultural labourers, with families. They ate bread and cheese, but no meat.
(Young, 1771, p. 202)
It seems, from a number of disperse data, that large parts of the manufacturing and agricultural classes in the period from 1775 to 1795, changed their diet from bread and cheese, to bread with some meat. The prices per pound of cheese and of meat were about the same.
“The Trade of Wilmslow Parish, forty years ago [1745], was very trifling, …. The business of a Butcher at that time was also in as low a state: half a Cow, and two or three Calves were a sufficient Supply for the weekly Saturday’s Market. ….. But since that time there has been a gradual change of every thing….. The Butchers can now scarcely procure Meat enough for the the supply of the Market, the old useless Cow of the Farmer will no longer go down; they are obliged to fetch their Beef out of Yorkshire, for everybody eats Butchers’ Meat, which was formerly a food the Labourers, and even many of the lower Farmers tasted but at Wakes or at a Christening.”
Finney, 1785, “Agriculture, Trade, and Manufactures of the Parish of Wilmslow”
[Wilmslow is near Styal]
“So greatly is the consumption of flesh meat increased, that, whereas in the memory of some persons now living, not more than one cow used to be killed weekly in Bolton, or, if two, the unsold beef used to be sent to Bury market,- before the beginning of the present war, a tanner in Anderton bought weekly thirty-five cow hides of the Bolton butchers, and yet was supposed not to take half the whole produce.” [70 cattle / week, 300 lbs. edible weight, population 15,000; gives 70 pounds of meat per person per year, or 7 pounds per family per week]
(Aikin, 1795, Bolton, p. 261)
“The rapid increase of population, or the improvement in the mode of living (probably both) in this town and neighbourhood, may be judged by the following fact – in 1758 one beast was slaughtered at Christmas, and proved too much for the market; in 1792, thirty-five beasts (cows) were slaughtered at Christmas, and proved too little.”
(Aikin, 1795, Leigh, Lancashire, p. 297)
“Twenty or thirty years ago, there was not, for the smaller markets of this District [The Vale of Pickering], a single cattle killed (except upon some extraordinary occasion) during the winter, spring or summer months. In autumn, particularly in the months of November, considerable numbers were butchered, to be salted and hung for winter provision: “hung-beef” being formerly a standing dish, not only in this, but in other Districts. But the number which were then killed, in autumn, was small, compared with the greater numbers, that are, at present, butchered in the District; every market of which is, now, plentifully supplied with beef, the year round; and notwithstanding considerable quantities are still hung in autumn. The market of Malton might well vie with the London markets ….”
(Marshall, 1796, Vol. II, p. 200)
“Butcher’s meat is the next most important article of subsistence, and the demand for which throughout the kingdom has doubtless been greatly increasing. I calculate that the individual consumption of bread, per head or per family, is not greater now than it was a half a century ago, but that the demand per family of butcher’s meat has increased, in consequence of increased luxury, the effect of increased wealth, the consequence of extended commerce, increased manufacture, and improved agriculture.”
(Pitt, 1806, p. 286)
“…. The wealth acquired by our various branches of manufactures has been the means of advancing wages, by which numbers of hands have been drawn from the country into towns. The consequence of which has been the entire change in their habits and modes of life; their former frugal manner of living is abandoned; they are no longer fed upon milk, cheese, and vegetables, with little or no animal food. Less than two acres and a half was then amply sufficient for the support of a labourer.
The whole body of manufacturers (as well as most of those employed in great towns), are since that period subsisted on butcher’s meat, with the constant use of malt liquor, and, I fear, the pernicious habit of using spirits is but too common amongst them. ….. These combined causes have all contributed to increase the demand for animal food, and consequently to operate, with other causes, in lessening the growth of grain. The increase of butcher’s meat in country markets within fifty years is prodigious. Meat, that was provided only at particular seasons, is now weekly, if not daily, offered for sale.
… Smithfield market has (taking the increased weight of the carcasses into calculation), doubled the weight of flesh sold within fifty years. If such has been the case in the capital, where luxury ever predominated, what must be the increased consumption of meat throughout the whole empire?”
(Curwen, 1806, Vol. V, Part I, Art. 1, 1806, p. 143, p. 144, pp. 148-149)
The quantity and weight of cattle and of sheep increased in the second half of the 18th century, due to four causes.
Firstly, up to 1770, cattle and sheep were not used principally for meat. Sheep were used for wool, skins and manure. Oxen and cattle were used for “the pail and the plough”, i. e. milk and ploughing, also hides and tallow.
Secondly, there was a process of breeding stronger horses. As horses became stronger, they could be used for ploughing, instead of the oxen, and thus the oxen were released for producing meat. Also the roads in the country were improved (turnpikes), and so the vehicles for transporting people and merchandise could be pulled by horses, instead of by oxen.
Third, the processes of Enclosures of the common fields, made it possible to have a better type of plant food, instead just wild grass and shrubs. This meant that the oxen and cattle were better nourished, and had a better edible weight percentage.
“Cattle: Enclosures 571, Increased in 354, Decreased in 106, As before in 111. The full increase in produce does not appear in these numbers, for the difference in the size and value of the cattle is exceedingly great: it has been a change from poor half starved breeding stocks, to the best breeds for beef. …. Sheep: Enclosures 721, Increased in 467, Decreased in 157, As before in 97. The remark I made on cattle is equally applicable to sheep; these numbers, great as the increase is, do not mark the whole; for before, they were poor, lean, hungry, half starved common fed flocks for folding; but, since, are become far superior in breed, value, and food. …. In fact, the production of mutton and beef has increased enormously, beyond credibility to those who look only to the price they pay, notwithstanding the vast increase of produce.”
(Board of Agriculture, 1808, pp. 62-63).
To these changes, was added the intentional improvement of the animal stock by planned breeding. This was particularly carried out by Bakewell, who began his experiments in breeding in 1745, and inherited his father’s farm in 1760.
“The leading idea, then, which has governed all his exertions [Bakewell’s], is to procure that breed which in a given food will give the most profitable meat – that in which the proportion of the useful meat to the quantity of offal is the greatest: – also in which the proportion of the best to the inferior joints is likewise the greatest.”
(Young, Annals of Agriculture, Vol. 6, 1786, p. 466)
“In Great Britain, they [the different breeds] have been vastly improved, both in the weight of the carcase [sic], the quality of the beef, and the abundance of the milk, by the extraordinary attention that has been given to the selection and crossing of the best breeds, according to the objects in view. This sort of improvement began about the middle of the last century, or rather later, and was excited and very much forwarded by the skill and enterprise of two individuals – Mr. Bakewell of Dishley, and Mr. Culley of Northumberland. The success by which their efforts were attended roused a spirit of emulation in others; and the rapid growth of commerce and manufactures since 1760 having occasioned a corresponding increase in the demand for butcher’s meat, improved systems of breeding, and improved breeds, have been generally introduced.
But the improvement in the size and the condition of the cattle has not been alone owing to the circumstances now mentioned. Much of it is certainly to be ascribed to the great improvement that has been made in their feeding. The introduction and universal extension of the turnip and clover cultivation has had, in this respect, a most astonishing influence, and has wonderfully increased the food of the cattle, and consequently the supply of butcher’s meat.”
(McCulloch, 1845, Vol. 1, “Cattle”, p. 326)
For the process of breeding and improvement of oxen, cattle, and sheep, see: Prothero, 1912; Chapter VIII, The Stock-Breeder’s Art and Robert Bakewell (the whole chapter).
Scotland
“The demand for butcher’s meat in Scotland has increased in the most extraordinary manner. So late as 1763, the slaughter of bullocks for the supply of the public markets was a thing wholly unknown in Glasgow, though the city had then a population of nearly 30,000! Previously to 1775, or perhaps later, it was customary in Edinburgh, Glasgow, and the principal Scotch towns, for families to purchase in November what would now be reckoned a small, miserable, half-fed cow or ox, the salted carcass of which was the only butcher’s meat they tasted throughout the year. In the smaller towns and country districts this practice prevailed till the previous century, but it is now almost everywhere abandoned. The consumption of butcher’s meat, as compared with the population, does not at present differ materially from the metropolis. We do not, indeed, believe that the command of the people of any country over food and all sorts of conveniences ever increased, in any equal period, half so rapidly as that of the people of Scotland has done since 1770.”
(McCulloch, 1837, p. 502)
At the turn of the century, very little meat was consumed in Scotland, as was reported to a Parliamentary Commission in 1833.
“Do you consider that the workmen [in Glasgow] now consume, upon the average, as much animal food as they did in the years 1824 and 1825, and in the years 1814 and 1815?” “I think they did not eat so much animal food formerly as they do now.”
“Have you heard no complaint among the butchers?” “No; I know that the quantity of animal food, compared with what it was when I went to Glasgow first, is to the same individual at least as five to one, because at that time the spinners did not use animal food, upon average, more than once a week; that was in the year 1799, when I became a spinner in Scotland.”
“Was that not a year of peculiar scarcity, and very high price?” “That scarcity did not take place till 1800; I am alluding to the time from 1799 to perhaps 1803 and 1804; 1800 was a time of very high price.”
“Do they drink more sprits now than they did then?” “They drank more spirits in 1824 and 1825, and now the workpeople do drink a good deal; but from the better management and the great attention the masters pay to the business, and from there being always an abundance of hands, they are not allowed to drink much, for if they do they lose their work.”
“Throwing out of consideration the particular dearness in 1800, in consequence of the bad harvests, should you say that the quantity of animal food consumed by your spinners is considerably greater than it was in 1802, 1803, and 1804?” “I would say four times as much at least.”
“Is it your opinion that all the working classes generally in Scotland now consume considerably more animal food than they did in any period between 1799 and 1812?” “I think they do.”
“What was the chief food upon which they subsisted from 1799 to 1812?” “Oatmeal, potatoes and herrings.”
“Has not that change of habit been general in Scotland in the last 14 years?” “It has, I understand, even in the agricultural districts.”
“Is it not the fact, that 50 years ago the labourers in Scotland generally were not in the habit of consuming much animal food?” “They were not.”
“And therefore the present change may be considered as partly approximating to the habits of the English?” “Yes.”
……
“Are you of the opinion that the farm labourers consume as much flesh meat as they did 25 years ago?” “A great deal more, as I am informed.”
(Select Committee on Manufactures, Commerce and Shipping, House of Commons, 1833, evidence of Henry Houldsworth, owner of cotton spinning mill, p. 134, p. 137)
MEAT CONSUMPTION FROM 1800 TO 1880: TOTAL OF GREAT BRITAIN
We have the following general considerations about the amount of meat consumed, by the eminent Scottish economist, John Ramsay McCulloch, in 1837:
“The change that has taken place during the last half century in the consumption of butcher’s meat, is still more extraordinary than that which has taken place in the consumption of corn. The quantity made use of has been wonderfully increased, and its quality signally improved. From 1740 to about 1750, the population of the Metropolis fluctuated very little; amounting, during the whole of that period, to about 670,000 or 675,000. Now, during the ten years ending with 1750, there were at an average, about 74,000 head of cattle, and about 570,000 head of sheep sold annually in Smithfield Market. In 1831, the population increased to 1,472,000, or in the ratio of about 218 per cent. : and at an average of the three years ending with 1831, 156,000 head of cattle, and 1,238,000 head of sheep were sold annually at Smithfield; being an increase of 212 per cent. on the cattle, and 217 per cent. on the sheep, as compared with the numbers sold in 1740-50. It consequently appears that the number of cattle and sheep consumed in London has increased, since 1740, about in the same proportion as the population. The weight of animals has, however, a good deal more than doubled in the interval. In the earliest part of the last century, the gross weight of the cattle sold at Smithfield did not, at an average, exceed 370 lbs., and that of the sheep did not exceed 28 lbs.; whereas, at present, the average weight of the cattle is estimated at about 800 lbs., and that of the sheep at about 80 lbs. Hence, on the most moderate computation, it may be affirmed, that the consumption of butcher’s meat in the Metropolis, as compared with the population, is twice as great at this moment as in 1740 or 1750. In most other parts of the country, the increase in the consumption of butcher’s meat has been even greater. In thinly peopled agricultural districts, very little is consumed, but in manufacturing and commercial towns it is quite the reverse; and their vast increase, during the last half century, more than justifies the inference, that there has been, at least, a corresponding increase in the consumption of butcher’s meat.” (McCulloch, 1837, Vol. 2, Chapter 5, Improvements in Food, Clothing, and Lodging, pp. 497-498)
The consumption for England and Wales in 1801 is calculated as:
78 pounds per population per year, 3.5 ounces per average person per day (see Table A.1.)
1808
1808. Arthur Young. Eaten. Cattle 0.5. Sheep 3.3. Pigs 0.4. Total 4.2. (millions)
The consumption for 1808 in England and Wales is calculated as:
79 pounds per population per year, 3.5 ounces per average person per day (see Table A.2.)
The present document has been prepared to show the development of meat consumption in the whole of Great Britain. But we know that practically no meat was eaten in Scotland around 1800 (the great majority of the animals were exported to England). Thus we have to adjust the England and Wales average consumption to be a total Great Britain average consumption. The population of England and Wales was 9.2 millions, and of Scotland 1.6 millions. This gives average figures for Great Britain of 67 pounds per population per year and 3.0 ounces per day.
1854
England and Wales Domestic
1854. Poor Law Board. Eaten. Cattle 0.9. Sheep 7.5. Pigs 2.4. Total 10.8. (millions)
1854 Great Britain Domestic
1854. Poor Law Board and Highland Society. Eaten. Cattle 1.1. Sheep 9.7. Pigs 2.6. Total 12.3. (millions)
The consumption for 1854 in the different conditions is calculated as:
England and Wales, Domestic Production: 70 pounds per population per year, 3.1 ounces per average person per day (see Table A.3.);
England and Wales, Domestic Production plus Imports: 96 pounds per population per year, 4.3 ounces per average person per day (see Table A.4.);
Great Britain, Domestic Production: 73 pounds per population per year, 3.3 ounces per average person per day (see Table A.5.);
Great Britain, Domestic Production plus Imports: 96 pounds per population per year, 4.3 ounces per average person per day (see Table A.6.).
1866
1866 Great Britain Domestic
1866. Agricultural Census / Craigie. Eaten. Cattle 1.2. Sheep 11.6. Pigs 2.5. Total 15.3. (millions)
1866 United Kingdom Domestic
1866. Agricultural Census / Craigie.
1866. Agricultural Census / Craigie. Eaten. Cattle 2.1. Sheep 13.6. Pigs 4.0. Total 19.7. (millions)
The consumption for 1866 in the different conditions is calculated as:
Great Britain, Domestic Production: 74 pounds per population per year, 3.3 ounces per average person per day (see Table A.7.);
Great Britain, Domestic Production plus Imports: 108 pounds per population per year, 4.8 ounces per average person per day (see Table A.8.);
United Kingdom, Domestic Production: 82 pounds per population per year, 3.7 ounces per average person per day (see Table A.9.);
United Kingdom, Domestic Production plus Imports: 99 pounds per population per year, 4.4 particles per average person per day (see Table A.10.),
The consumption for 1880 in the different conditions is calculated as:
Great Britain, Domestic Production: 56 pounds per population per year, 2.5 ounces per average person per day (see Table A.11.);
Great Britain, Domestic Production plus Imports: 121 pounds per population per year, 5.4 ounces per average person per day (see Table A.12.);
United Kingdom, Domestic Production: 71 pounds per population per year, 3.2 ounces per average person per day (see Table A.13.);
United Kingdom, Domestic Production plus Imports: 110 pounds per population per year, 4.9 ounces per average person per day (see Table A.14).
Total meat supplies for the years 1868 to 1883 are given in: Craigie, 1884, pp. 841-844. (see Figure 5)
Aggregated amounts are given in the same reference (see Figure 6). We note that Home production (with Ireland) is practically constant during this period, at about 1,300,000 tons or 90 pounds per head yearly; and that the imports increase from 130,000 tons to 450,000 tons, or from 10 to 30 pounds per head yearly.
The following are the assumptions of Mr. Craigie, with respect to the slaughter proportion and the average (carcass) weight of the animals.
“By that scale one-fourth of the cattle enumerated on each 4th June, and two-fifths of the sheep are assumed as going annually to the butcher, while as far more pigs are slaughtered in a year than could be counted on any given day, 116 per cent. are taken as the proportion killed. The weight of meat is arrived at by adopting for the cattle of all ages an average of 600 lb. per head, the sheep I have taken at 70 lb. and the pigs at 134 lb.”
(Craigie, 1884, p. 844)
Chronological Development of the per capita consumption
The calculations of totals of pounds of meat, and consumption per person, give the progression shown in Table A.15.
The calculations from the data of Michael Turner and of Arthur Young can be approximately checked, taking the weekly consumption data that we have from certain groups (see Table C.3.).
We note that the total from the consumption by groups reaches 80 % of the total calculated on the basis of the Turner and Young figures. This does give us a certain security that we have approximately the correct amounts.
We can very generally make a comparison of the distribution of millions of pounds of meat, between 1810 and 1850-1860.
In Table C.4., we show the distribution of 1810 as in Table C.3., but giving only those positions for which we have data for 1850-1860, and compressing the other lines into “Rest of Great Britain”
For 1850-1860, we have data for the positions “London”, “Industrial Regions”, and “Agricultural Laborers”. As we have the total for Great Britain, the “Rest of Great Britain” is formed by subtraction.
London and the Industrial Regions have about the same consumptions per family per week as in 1810, but we see that the Rest of Great Britain now have a reasonable consumption level at 9 pounds per family per week, and only the agricultural laborers and farners are at the low level of 3 pounds per family per week.
9 pounds per family per week is 4 ounces per average family member daily, or 6 ounces per family head per day. 6 ounces “on the bone” is 3.5 ounces “without the bone”, i. e. one MacDonald “quarter pounder” per day for the family head.
MEAT CONSUMPTION 1800-1880, BY OCCUPATION OR BY REGION
Agricultural Laborers and the Poor
David Davies, Agricultural Laborers
David Davies was an Anglican clergyman, rector of the parish of Barkham in Berkshire from 1781 to his death in 1819. He wrote a book about the incomes and living expenses of his “flock”, called “The Case of the Labourers in Husbandry”, referring to 1787, published in 1795.
The parish was small and poor. “In this parish the poor-rate is somewhat lower than in any of the contiguous parishes. Here is no work-house, nor any manufacture carried on. Tilling the ground is the only occupation. The number of the inhabitants being only 200, every one is known, and no one can well be idle. The overseers, being frugal farmers, keep down the rate as low as they can.” (p. 26). The parish was only the half of the average size in England. The income from rates (i.e. the amount that could could be paid out to the poor) was only 75 pounds per year.
The tables and text which conform the second half of his book, give the earnings, expenses, and food consumption of 123 families in 25 villages, including Barnham. The Rev. Davies had written to a number of contacts, clergymen, Members of Parliament, etc., asking for data on the same classes of labourers. The average total family income is 9 shillings per week, the consumption of bread is 41 pounds per family per week (1.0 pounds per family member per diem), and the consumption of meat or bacon is 1.8 pounds per family per week. Only one family does not eat meat, but they eat about 85 pounds of barley. See Table C.6.
The selection of families is not representative, i. e. these families are poorer than the average of agricultural families in the country. These families generally have a number of small children, and therefore the mother cannot find time to work at spinning. If there were children of ten to sixteen years old, they could certainly bring in some money. The earnings figures in some cases do not include the higher wages in the harvest-month and/or higher daily amounts for task-work.
A large number of families in Berkshire had a better standard of living than that shown by the Rev. Davies, as they had plots of land, and animals.
“In the eastern parts of the county, many cottagers pay their rent and leave a surplus for themselves, from pigs, geese, and domestic fowls, in some place, their gardens and orchards yield the same advantages.”
(Board of Agriculture, General View of the Agriculture of Berkshire, 1809, p. 75 footnote)
Sir Frederick Eden, State of the Poor.
This member of the better classes also saw that there was an much poverty in the country in 1795, and had data collected from a number of towns, as to the care of the poor (particularly the poor-houses, and the direct payments to people without incomes). These reports were published in his “State of the Poor” in 1797; however, it is important to note – and he himself comments this – that the figures actually come from 1795 and 1796, when the food prices were very high, due to the bad harvests.
Sir Frederick Eden’s book gives us four classes of data on incomes and expenses:
Family budgets with incomes, expenses and food consumption per family (26 families);
Wages for a number of common occupations in given towns (10 occupations in approx. 100 towns, in the body of the text);
General comments on wages in certain small regions, and with tables on incomes, wages, and food consumption, for the agricultural laborers (51 families);
For some workhouses, number of occupants, days with meat per week, quantities of servings of meat (64 workhouses).
Family Budgets
Data on these 27 families are found in the general text. We see that they are a varied sample of workers, but not including agricultural laborers. The average family income is 14 shillings 6 pence.
7 families eat no meat; 3 families eat one pound of meat per week. 11 families eat from 2 to 6 pounds of meat a week. One family with 7 children, of which the two eldest work as ploughmen, eats 5 pounds of bacon. The families of skilled workers (miners, one weaver, one wool comber, a spectacle frame maker) eat from 7 to 12 pounds of meat per week.
The average is 3.7 pounds per family per week, i. e. 1.4 ounces per average family member per diem, or 2.8 ounces for the father daily.
The amount of bread is, on average, 0.7 pounds per family member per diem (a lower figure, as they eat more meat than the agricultural families).
See Table C.7.
Wages for common occupations
These are found in the texts for each town or district. They give the wages for (as examples): common labourers, 7 to 9 shillings a week; weavers of sacking, 16 shillings; foundries, 14 shillings; masons, joiners, carpenters, 9 to 15 shillings; lead miners, 10 shillings; textile workers, around 15 shillings; textile workers, women and children, 2 to 8 shillings; women weavers, 5 shillings; shoemakers, 10 to 15 shillings; skilled manufacturing workers in Birmingham, Wolverhampton, Coventry, 8 to 40 shillings; woollen workers at Leeds, 12 to 20 shillings.
From the table (“family budgets”), we may suppose that the families with an income of from 10 to 15 shillings, eat from 2 to 6 pounds of meat a week; families with an income of 16 shillings and more, eat from 8 to 12 pounds per week.
Agricultural labourers
These are taken from the table in Vol. 3, Appendix XII, pp. cccxxxix to cccl; the table is an annex to some general observations on certain counties in Vol. 1, pp. 565-574. The families are inhabitants of villages. There are 51 families with an average size of 6.0 persons.
The average family income is 12 shillings 8 pence weekly (increases with the number of family members). The average consumption of meat (always bacon) is 1.7 lb. per family per week. The average consumption of bread is 0.9 pounds per person per diem.
See Table C.8.
From the above data presented by David Davies and Sir Frederick Eden, we see that the average consumption of food for agricultural laborers was close to 1 pound of bread per average family member per day, and 2 pounds of meat or bacon for the family per week.
Poorhouses
The poorhouses in the book, are mainly small, and have as their inmates, children, older women, cripples, and lunatics. In general, meat is served three times a week, with a serving of 6 to 8 ounces of beef. See Table C.9.
See the dietary of the poorhouse of Tiverton, Devon in 1782, from Eden, Vol. II, p. 144, in Figure 9.
Agricultural Laborers after 1815
A famous collection of data made by the Poor Law Commissioners in 1834, known as the “Rural Queries”, shows that in the majority of the counties of England, the families could eat sufficiently with 10 shillings basic wage per week, and a majority had enough to buy meat (see Figure 10).
But we see that the expression “with meat” is not to be taken optimistically. From a presentation of the individual reports, ordered by county (here: Bedford), the facts are that the only meat eaten is bacon or pork, and this is taken generally once to three times a week, by the whole of the family (see Figure 11).
Mr. Charles Mott, who was the Assistant Poor Law Commissioners for Middlesex and Surrey in 1836, and reported on the conditions in the workhouses, decided that it would be useful to know the real consumption of bread and meat by the agricultural workers, in order to compare this with the food amounts in the workhouses; he had a survey carried out, of which unfortunately we do not have the details. It was generally supposed – and the survey confirmed this – that the daily amounts in the workhouses were larger than those eaten by the agricultural laborers.
“The agricultural labourers are unable to procure for themselves and families more than an average allowance per head of 122 ounces of food (principally bread) per week, of which we will suppose that the man consumes, as his proportion, 140 ounces per week, say 134 ounces of bread [8.3 pounds] and six ounces of meat. Bread contains in round numbers 800 parts in 1,000, or four-fifths of nutritive matter, whilst the meat will yield but 333 parts in 1,000, or about one-third; they will give together 109 ounces per week, about 15 ½ ounces of nutritive matter per day as the consumption of an able-bodied labourer. These results were obtained from returns from labourers in the southern agricultural counties, and as they were selected with care, they may be fairly relied upon; they may, nevertheless, be objected to as insufficient data upon which to ground any general conclusion, inasmuch they may be said to be confined to one class, whose income does not average for the family more than 2s. per head per week, and to show what labourers can obtain, and do not prove that labourers would not consume more if they could get it.”
An extension of the survey to industrial workers with decent incomes in towns, showed that although these people did eat more meat (no figures given) than the agricultural laborers, they then ate less bread, so that the medical calculation of the total of nutritive matter was about the same.
(Poor Law Commissioners for England and Wales, Second Annual Report, 1836, Report by Mr. Mott, p. 336)
Dr. Edward Smith, the expert on nutrition, was requested by the Government in 1866, to audit the amounts and quality of food in the workhouses, and give suggestions as to how these could be improved to give a better level of health. As a part of his report, he inserted data taken from an earlier study made by him on the food of the working classes, showing the real consumption of food by inhabitants of rural areas in the North of England.
“The following table shows the average quantities per adult of the different classes of food consumed weekly in the houses of the laboring classes in the several counties. The quantity of garden vegetables which are consumed, varies much at the different seasons of the year, and cannot be satisfactorily estimated.
a
Bread Stuffs, Bread, Flour, Oatmeal,Rice, &c.
Sugar and Treacle
Butter, Dripping, Suet
Bacon,Meat
Milk
Cheese
Tea
lbs.
oz.
oz.
oz.
Fluidoz.
oz.
oz.
Lincolnshire
12 ¼
7
3 ¼
21
45
8 / 10
35 / 100
Notts
13 ¼
8
3 ½
24
54
9 / 10
45 / 100
Cambridgeshire
14 ¼
7 ¾
6
17
9
1 1/3
37 / 100
Yorkshire
12 ¾
10 ¼
7
26
75
60 / 100
a
As a general expression it may be stated that the food obtained by the laboring classes in my district consists of from 1 ¾ to 2 lbs. of bread-stuffs daily; ½ lb. of sugar or treacle weekly; ¼ to ½ lb. of butter or other fats weekly; 1 lb. to 1 ¾ lb. of meats weekly; ½ pint to 4 pints of milk weekly; 1 oz. of cheese weekly; and ½ oz. of tea weekly.”
(Smith, 1866, pp. 55-57)
[But in the North, the agricultural workers ate better than in the South]
A comparison of family budgets of agricultural workers in 1863 and in 1903, shows that the weekly amount of meat per family, increased from 4.5 pounds to 7. 2 pounds (2.0 oz. to 3.3 oz. per person per day). Wilson Fox, A., 1903, pp. 273-359, see p. 295.
(See Figure 12)
London
“What think you of 1400 oxen, rendering each 6 ½ C. [hundredweight] of the eatable part; 13,000 sheep, of 84 lb. each, the eatable part, with a quantity at least equal to the mutton, in pork, veal, poultry, and pigs, sold weekly at Smithfield and the shops, for the use of these cities [City of London and Westminster]? Supposing 700,000 inhabitants, men, women, and children, old and young, sickly and healthy, it comes to a fraction above seven ounces each per diem.
This is a quantity brought to one place, which one would imagine enough to impoverish the richest country on earth; and is, I suppose, more than thrice as much as is consumed by the same number of people on any spot on this globe; and it would not be credible, if it was not well known that the computation in a private family in affluence is 1 ¼ lb. or 20 oz. each, and that all the people covet to eat meat.”
(Hanway, 1767, Vol. II, pp. 191-192)
“Animal food
The number of bullocks annually consumed in London is 110,000; of sheep and lambs, 776,000; calves, 210,000; hogs 210,000; sucking pigs, 60,000; beside other animal food.
It does not, however, give a perfect idea of the immense concentration of animal food in London, to speak only of the number of bullocks and other animals, brought to the London market; their size, and fine condition, should be seen by a stranger, to enable him to judge of its extent. Improvements in the breed and feeding of bullocks and sheep, have within the last 45 years, added, at least, one-half to the former average weight of these animals. The present average weight of bullocks is 800 pounds each; sheep, 80; and lambs, 50.”
(Phillips, 1802, pp. 16-18)
[The 110,000 bullocks, at a carcass weight of 800 lb., and dividing by a population of 1,100,000, give 80 pounds per person per annum. The sheep and lambs are 50 pounds per person per annum; the calves 20 pounds, and the hogs 20 pounds. This gives a total of 170 pounds per person per annum, or 8 ounces per day. Weights including bones.]
“….. for on the average of the last six years, London has consumed 123,000 oxen, and 827,000 sheep. Taking the first at 800 lbs. and the latter at 80 lbs. it will make 164,000,000, which for 1,000,000 of people, is 7 oz. per head per diem. Meat brought by carriers, and pork, will make it more than half a pound per head. Suppose 2,000,000 of the people not to consume meat, and deduct 1,000,000 for London, and that the remaining 6,000,000 consumed half as much as London, or one-quarter of a pound per day, the amount will be 547,500,000 lbs., and London included it will be 711,000,000 lbs., ….”
(Arthur Young, 1808, p. 402)
Mr. McCulloch gives us data for the sales in 1830, but he notes that the total is incomplete:
“The account for 1830 will then stand as under:-
Number and Species of Animals
Gross Weight
Offal
Net Weight
Butcher’s Meat
Lbs.
Lbs.
Lbs.
Lbs.
159,900 Cattle
800
250
550
87,950,000
1,287,000 Sheep and Lambs
70
20
50
64,350,000
20,300 Calves
140
35
105
2,130,000
Total
154,430,000
A part of the cattle sold at Smithfield go to supply the town in the vicinity; but, on the other hand, many cattle are sold in the adjoining towns, and slaughtered for the use of London, of which no account is taken. We have reason to think that the latter quantity rather exceeds the former; but supposing that they mutually balance each other, the above quantity of 154,430,000 lbs. may be regarded as forming the annual supply of butcher’s meat at present required for London; exclusive, however, of hogs, pigs, suckling calves, &c., and exclusive also of bacon, hams, and salted provisions brought from a distance. The quantities thus omitted from the account are very considerable; nor can there, we apprehend, be any doubt that, with the addition of such parts of the offal as are used for food, they may be considered as more than balancing the butcher’s meat required for the victualling of ships. On this hypothesis, there, it will follow, assuming the population of the metropolis to amount to 1,450,000, that the annual consumption of butcher’s meat by each individual, young and old, belonging to it, is, at an average, very near 107 lbs.
This, though not nearly so great as has been sometimes represented, is, we believe, a larger consumption of animal food than takes place any where else by the same number of individuals. According to M. Chabrol, the consumption of butcher’s meat in Paris amounts to between 85 lbs. and 86 lbs. for each individual. At Brussels the consumption is a little greater, being supposed to average 89 lbs. each individual: being rather more than 3 lbs. above the mean of Paris, and 18 lbs. under the mean of London.”
(McCulloch, 1845, Vol. 1, “Cattle”, p. 327)
“The metropolis is the grand mart to which a considerable proportion of the fat cattle from every part of the kingdom is sent. In the year 1830, there were sold in Smithfield, 159,907 cattle, 1,287,071 sheep, 254,672 pigs, and 22,500 calves, for the supply of the metropolis, and the villages and towns within a circuit of eight or ten miles, and occasional contracts for the navy. Besides this there is a great quantity of dead meat sent up from the country, generally speaking perfectly wholesome, and fairly and honestly slaughtered, although it is said that the flesh of some animals that did not come to their death through the hands of man, has occasionally found its way to Newgate market. There are inspectors appointed, who very impartially look after this. This is called the dead market, and may fairly be set against the consumption of the places in the neighbourhood of London, and also the irregular demands for the navy, so that the numbers just stated may be considered as fairly representing the consumption of animal food in the metropolis, exclusive of fish, poultry, and salted provisions.”
“The improvement of cattle has progressed with unsuspected rapidity since the middle of the last century; in many important points, it could hardly be said to have commenced at that time. After consultation with several of the most intelligent butchers of the metropolis, we are induced to take 656 lbs. as the present average dead-weight of bullocks (some butchers stated 85 stones Smithfield weight, none less than 80 – we have taken 82 stones). The average weight of the calf is 144 lbs., of the pig 96 lbs., and of the sheep and lamb 90 lbs., approaching to double the weight of these animals in 1730. This renders the number of cattle slaughtered in the metropolis and the increasing number of the inhabitants a little more proportionate.
We may now form some not very inaccurate idea of the amount idea of the amount of this branch of the provision trade in London:-
Average weight No. of lbs. consumed
Cattle 159,907 656 lbs. 104,898,992
Sheep, &c. 1,287,070 90 “ 115,836,300
Pigs 254,672 96 “ 24,448,512
Calves 22,500 144 “ 3,240,000
__________
Number of pounds of meat consumed 248,423,804
This, estimated at the average price of 6d., would be 6,210,595 l. 2s. 0d. At 8d., it would produce 8,268,293 l. 9s. 4d., exclusive of bacon, hams, and all salted provisions brought from a distance (the importation of Irish bacon and hams into Great Britain is 500,000 cwt.), and also fish and poultry.
This calculation will enable us to determine another curious question,- what is the average quantity of meat consumed by each individual in the course of a year? If we divide the gross number of pounds 248,423,804 by 1,450,000, the estimated number of inhabitants in London and its environs, the quotient will be 170, or each individual consumes nearly half a pound of meat every day. This is a very high calculation compared with that of Paris, where each person is supposed to consume but 80 pounds in the year; and Brussels, where 89 pounds form the allotment of each; but ours is a meat-eating population, and composed chiefly of Protestants; and when we remember that this includes the bones as well as the meat, half a pound per day [0.3 pounds net edible weight] is not too much to allow to each person.”
(underline by this author)
(Youatt, 1834, p. 256, p. 257)
We have a report of the animals and meat delivered into London in the year 1853, prepared by a manager of one of the railway companies, for a Parliamentary Committee (see Figure 15). The total is 437,000,000 lbs. carcass weight.
The consumption of meat per capita in London from 1767 to 1850 was practically without change, between 7.0 and 8.0 ounces per person per day. See Table C.10.
From another point of view, we also have data as to the number of live cattle and sheep entering Smithfield Market in London in certain years; see Table C.11.
Industrial Towns
In the Northern Industrial Towns, there was a certain amount of consumption of meat in the 1790’s:
Manchester: “Of butcher’s meat, veal and pork are mostly brought by country butchers and farmers; mutton and beef are slaughtered by the town by the town butchers, the animals being generally driven from a distance, except the milch cows of the neighborhood, which are fattened when old. The supply of meat and poultry is sufficiently plentiful on market days; but on other days it is scarcely possible to procure beef from the butchers; nor is poultry to be had at any price, there being no such trade as a poulterer in the whole town. Wild fowl of various kinds are brought to market in the season.”
(Aikin, 1795, Manchester, pp. 203-205)
The following four quotes come from the investigation of Sir Frederick Eden, with date around 1796.
Leeds: “Wheaten bread is generally used here; some is partly made of rye, and a few persons use oat bread. Animal food forms a considerable portion of the diet of the labouring people; tea is now the ordinary breakfast, more especially amongst women of every description; and the food, both of men and women, is, upon the whole, much more expensive than what is used by persons, in the same station of life, in the more northern parts of England.”
Sheffield: “Wheaten bread universally used here; malt liquor, and butcher’s meat forms part of the diet of all ranks of people. The tradesman, artisan, and labourer, all live well.”
Halifax: “Butcher’s meat is very generally used by labourers”
Hull: “The usual diet of labourers in Hull, and its neighbourhood, is wheaten bread; (but since the great advance in the price of wheat, their bread has consisted, two-thirds of wheat, and one-third rye; which is about half the price of wheaten-bread); the cheapest sort of butcher’s meat; potatoes; and fish; the latter may be frequently bought on moderate terms.”
The following information comes from a tourist guide to Leeds in 1806.
Leeds: “The Corn-Market is held every Tuesday in Cross-Parish, and begins at eleven o’clock in the forenoon; but as a market for grain, Leeds does not rank very high. In the Autumn the quantity of Fruit brought here to be sold every Market-day is almost incredible. The Shambles are abundantly supplied with all kinds of butcher’s meat. The beef is remarkably fine. On a Saturday evening the town is crowded with the workpeople of the surrounding villages, who come to lay in a stock of provisions for the week. The town is well supplied with Fish from the East coast, the Market-days for which are Monday and Thursday.”
(Billam, 1806, p. 13)
As to the consumption of meat in the industrial towns, we have a calculation presented to a Parliamentary Committee in 1821, utilizing the reports of Excise on Hides and Skins collected on the use of skins by the leather workers.
Report from the Select Committtee to whom the Referral Petitions Complaining of the Distressed State of Agriculture, 1821, Mr. David Hodgson, dealer in corn, p. 267
The consumption of meat was 45,500,000 lbs. (gross weight, with bones, etc.) for 370,000 families of approx. 5 persons in each, gives 95 lbs. per person per annum. If we take the net edible weight to be 80 %, then the consumption of meat was 7.5 lbs. per family per week. The cost was 5 shillings per family per week. Pig meat and chicken not included.
Wheat was taken at one quarter per person per annum, corresponding to 11.5 quartern loaves per family per week. This would have cost 6 shillings per week.
Two pages earlier, we have reports of numbers of hides for Liverpool and for Manchester, yearly from 1801 to 1820.
Liverpool: Total whole weight 1801, 12,836,000 lb., Population 1801, 78,000, Edible weight per person 131 lb. Total whole weight 1820, 13,763,000 lb., Population 1820, 115,000, Edible weight per person, 95 lbs.
Manchester: Total whole weight 1801, 12,074,000 lb., Population 1801, 95,000, Edible weight per person, 102 lbs. Total whole weight 1820, 17,045,000 lb., Population 1820, 161,000, Edible weight per person, 85 lbs. (Population including Salford)
We have also a report from the Manchester Statistical Society, that the consumption of meat in the Manchester conurbation in 1836 was 100 pounds per person per year (36,000,000 pounds divided by 343,000 persons). They calculated this figure using the reports of the toll offices at the entrances to Manchester, and checking this against the sales in the butchers’ shops:
(Love, 1839, p. 159)
To these figures should be added the consumption of bacon, pork, fish and poultry.
The figures are an average per person, over men, women, children, babies, and destitute, and are for net edible weight. 100 pounds per person per year, if we calculate it per family with 5 members, is 10 pounds per week, or 1.5 pounds per day for the family. This is the quantity of meat in one McDonalds’ quarter pounder per day per person(although in the case of Manchester the meat is a total of beef, lamb, and mutton, not 100 % beef).
At a price of meat of 8 pence per pound (maximum), this is 7 shillings per week. If we suppose that the family is spending 25 % of its income (sum of all the persons with work) on meat, then the average income per family in Manchester was 28 shillings.
We may suppose that in all the medium-size towns the population ate sufficient meat, as there were a large number of butcher’s shops in each town. The average consumption (approximate estimate) would be from 5 to 7 pounds of meat per family per week.
Town
Population 1821
Number Butchers 1828
Manchester
156,000
440
Liverpool
120,000
150
Oldham
21,000
45
Stockport
21,000
30
Bury
35,000
30
Bolton
30,000
35
Sunderland
30,000
65
Durham
10,000
20
Carlisle
15,000
20
Leicester
30,000
50
Lincoln
12,000
30
Stamford
6,000
15
Newcastle
45,000
70
Shrewsbury
22,000
45
(Pigot and Co., National Commercial Directory for 1828-9)
The weekly provisions for prisoners in the Manchester New Bailey in 1844 were as follows:
s. d.
Seven loaves of twenty ounces each, costing
1 1
Thirty-one ounces of flour
0 4
Five pounds of potatoes
0 1
One pint of pease
0 1
Three ounces and a half of salt
0 0
One pound of beef
0 4
One quart of beer
0 0
Total
1 11
(Kohl, 1844, p. 111)
These amounts would have been those that the police authorities thought were normal for a working man; since they were expenses of the public purse for the upkeep of lawbreakers, they may well have been kept on the low side.
Mr. Porter apparently has an opinion that a normal amount of meat eaten in manufacturing regions should be considerably more than one half pound per person per week, since this amount consumed in Saxony, demonstrates that the workers live in a “wretched manner”. Thus we may suppose that the real amount in England was much higher.
“The wretched manner in which the poorer classes in that country [Saxony] subsist may be inferred from the fact exhibited by official statistical returns, that the annual consumption of meat in the principal manufacturing districts, including the town of Chemnitz, does not average more than twenty-eight pounds for each individual of the population, and that at least one half of this quantity consists of pork. If this provision were equally divided among the entire number of inhabitants, it would amount to scarcely more than half a pound weekly for each individual; but as the actual distribution is of course very different from this, it is probable there are many among the labouring artisans who rarely, if ever, taste animal food.”
(Porter, The Progress of the Nation, Vol. II, 1838, p. 199)
Mr. Charles Mott, who was the Assistant Poor Law Commissioners for Middlesex and Surrey in 1836, and reported on the conditions in the workhouses, decided that it would be useful to know the real consumption of bread and meat by the agricultural workers, in order to compare this with the food amounts in the workhouses; he had a survey carried out, of which unfortunately we do not have the details. It was generally supposed – and the survey confirmed this – that the daily amounts in the workhouses were larger than those eaten by the agricultural labourers.
“The agricultural labourers are unable to procure for themselves and families more than an average allowance per head of 122 ounces of food (principally bread) per week, of which we will suppose that the man consumes, as his proportion, 140 ounces per week, say 134 ounces of bread [8.3 pounds; 2.0 quartern loaves] and six ounces of meat. Bread contains in round numbers 800 parts in 1,000, or four-fifths of nutritive matter, whilst the meat will yield but 333 parts in 1,000, or about one-third; they will give together 109 ounces per week, about 15 ½ ounces of nutritive matter per day as the consumption of an able-bodied labourer. These results were obtained from returns from labourers in the southern agricultural counties, and as they were selected with care, they may be fairly relied upon; they may, nevertheless, be objected to as insufficient data upon which to ground any general conclusion, inasmuch they may be said to be confined to one class, whose income does not average for the family more than 2s. per head per week, and to show what labourers can obtain, and do not prove that labourers would not consume more if they could get it.”
An extension of the survey to industrial workers with decent incomes in towns, showed that although these people did eat more meat (no figures given) than the agricultural labourers, they then ate less bread, so that the medical calculation of the total of nutritive matter was about the same.
(Second Annual Report of the Poor Law Commissioners for England and Wales, 1836, Report by Mr. Mott, p. 336)
We have an estimate of food expenses for average Lancashire workers in 1839, 1849, 1859, made by Mr. David Chadwick (Town Treasurer of Salford), after checking his numbers with representatives of the owners and of the workers. A family of five eats 5 pounds of butcher’s meat and 2 pounds of bacon a week (3 ounces per person per day). See Figure 19.
(Chadwick; 1860, p. 35)
The amount of 0.8 pounds of meat per capita per day for the average of the working class, is a little less than the 1.2 pounds eaten by the workers in Lancashire in 1861, just before the Cotton Famine. Although the Lancashire workers had a position above the middle of the working class, their situation must have been close to the average of the whole population, i. e. including professional persons and the upper class.
The numbers were taken by Oddy from the report of Dr. Edward Smith on the effects of the Cotton Famine in Lancashire in 1862.
(Oddy, 1983, pp. 68-86, Table 3, p. 78)
Glasgow
In the eighteenth century and the first half of the nineteenth century, the working classes of Glasgow ate large amounts of herring.
In the 1850’s and 1860’s there were also considerable sales of fresh and salted meat. See Table C.12.
Herr Meidinger, who visited England in 1828, noted that the food consumed by the working classes varied considerably, depending on the income level:
“The main food of the local factory workers consists of potatoes, oatcakes and buttermilk and sometimes “bacon”. This is however only the case for the really poor. Those, who have a good enough employment, live at a better and more decent level, than the factory workers in France and Germany, as the wages in England are always in a good relation to the expenses.”
(Meidinger, 1828, p. 302)
Friedrich Engels observed the same situation:
“The habitual food of the individual working-man naturally varies according to his wages. The better-paid workers, especially those in whose families every member is able to earn something, have good food as long as this state of things lasts; meat daily and bacon and cheese for supper. Where wages are less, meat is used only two or three times a week, and the proportion of bread and potatoes increases. Descending gradually, we find the animal food reduced to a small piece of bacon cut up with the potatoes; lower still, even this disappears, and there remain only bread, cheese, porridge, and potatoes, until on the lowest round of the ladder, among the Irish, potatoes form the sole food. As an accompaniment, weak tea, with perhaps a little sugar, milk, or spirits, is universally drunk.”(Engels, 1845, Ch. 4, The Great Towns)
Herr Meidinger, who visited England in 1828, noted that the food consumed by the working classes varied considerably, depending on the income level:
“The main food of the local factory workers consists of potatoes, oatcakes and buttermilk and sometimes “bacon”. This is however only the case for the really poor. Those, who have a good enough employment, live at a better and more decent level, than the factory workers in France and Germany, as the wages in England are always in a good relation to the expenses.”
(Meidinger, 1828, p. 302)
Friedrich Engels observed the same situation:
“The habitual food of the individual working-man naturally varies according to his wages. The better-paid workers, especially those in whose families every member is able to earn something, have good food as long as this state of things lasts; meat daily and bacon and cheese for supper. Where wages are less, meat is used only two or three times a week, and the proportion of bread and potatoes increases. Descending gradually, we find the animal food reduced to a small piece of bacon cut up with the potatoes; lower still, even this disappears, and there remain only bread, cheese, porridge, and potatoes, until on the lowest round of the ladder, among the Irish, potatoes form the sole food. As an accompaniment, weak tea, with perhaps a little sugar, milk, or spirits, is universally drunk.”
(Engels, 1845, Ch. 4, The Great Towns)
Mr. Butcher [sic], overseer [Poor Law administrator] of Salford, Hulme, and part of Manchester, says (page 62,First Report), that the factory operatives “in a general way have fresh meat about twice a week, fried bacon two days a week, and liver and a little bacon generally on a Friday, and the other two days bread and cheese, bread and butter, and water-gruel”. The overseer of the township of Heap, in answer to my question concerning the usual diet of the factory operatives, says, (page 142, First Report), they have either tea or coffee for breakfast, and fresh meat for dinner, and tea in the afternoon; and for supper, porridge, which some of the poorer classes have in the morning. The same witness also states, that the factory operatives are better off than any other class, except perhaps general mechanics, and that he has not had to relieve one spinner since he came into office.””
(Factories Inquiry Commission, Supplementary Report, Part I, D2 Lancashire District, 1834; Report by Mr. Tufnell, pp. 203-4)
The inspectors working for the Poor Law Commissioners in their report of 1842 found that the industrial workers in Birmingham ate very well:
“Many of the workmen are supplied with their dinner from small cook-shops, cooked meat is sold to them at the rate of 1s. per pound; a workman will pay 3d. for a plate of meat and 1d. for potatoes or bread, and this constitutes his dinner, and he is well satisfied with it. Many publicans retail cooked meat at the above-mentioned price, and they remark that this quantity of meat quite satisfies the mechanic for his dinner, but it would require double the quantity to dine an agricultural labourer. The meat of the working man is more frequently roasted or fried than boiled, although one-half more fuel is expended in roasting a joint than would keep the pot boiling. The inferior joints of meat are sometimes cooked with vegetables, and made into a stew, and sold at the rate of 9d. per pound; but this is much less frequently purchased at the cook-shops by the working man, than the roasted meat. Soup is sold at these shops at 1d. per pint; a half-pint of soup and a piece of bread often comprises the dinner of an elder working man. There are as many as 95 of these cook-shops in this town. The wives and children dine principally on bacon and potatoes. The more careful housewife buys what are called bits of meat at 5d. a pound – these she stews with potatoes and onions, and forms a wholesome and nutritious meal for herself and her children.
The workmen in this town drink principally beer and ale, which, generally speaking, is very wholesome and well brewed. They drink large quantities of low-priced beer sold at 2d. or 3d. per quart. Spirits are not much drank [sic] by the working mechanic. The habit of drinking foreign wines is growing among the better class of workmen.”
(Poor Law Commissioners, Local Reports, 1842, Birmingham, p. 212)
The most pessimistic report about the amount and the quality of food consumed in the industrial towns, is to be found in the short book “The Moral and Physical Condition of the Working Classes employed in the Cotton Manufacture in Manchester” (1832) by Dr. Francis Kay. The book served as a source for Engels’ statements about the horrible conditions of the working classes. Dr. Kay worked as a doctor in Manchester for a few years, and was later a well-known politician of liberal leanings, and very interested in improving the education of the lower classes. He gives us a number of insulting descriptions about the life and habits of the workers in Manchester, particularly the Irish. The living and sanitary conditions are disgusting. According to his data, the operative works in the factory from 6 to 8 a.m., returns home for a breakfast of tea or coffee with a little bread, for lunch he has a mess of potatoes with melted lard or butter and sometimes pieces of fat bacon; for supper he has tea and a little bread sometimes with oatcakes. Those with better incomes may eat a little animal food, but no more than three times in the week. It seems to be impossible that a man could do hard physical labour on so little food.
But the explanation is in the preface.
That is to say, that the general part of the working-class population in Manchester, eat and live better than the subjects of Dr. Kay’s book.
Better Classes
María Eliza Rundell published a number of editions of her book, A New System of Practical Domestic Economy: Founded on Modern Discoveries, and the Private Communications of Persons of Experience (She published under the name of “A Lady”, but everyone knew who the authoress was, and the book was generally referred to as “The Rundell”). The book contained a large number of recipes, and of hints as to how to look after the house. The 1827 edition was additionally titled A New Edition, revised and enlarged, with Estimates of Household Expenses, adapted to Families of Every Description. The last section of the book (p. 387 et. seq.) gave an estimation – including food cost – of the weekly expenses, at different levels of income, starting at 21 shillings a week, and size of family.
The family with an income of 21 shillings would be a supervisor in a factory, or a medium-level government clerk. He is supposed to have a wife and three children. They eat in total 6 lbs. of meat a week (3 oz. per capita per diem), and in total 24 lbs. of bread a week (11 oz. per capita per diem).
The estimate changes at 36 shillings per week to 8 pounds of meat a week (3.6 ozs. per capita per diem). At 42 shillings a week, the estimate is 10 lbs. a week (4.5 ozs. per capita per diem); but this is now a good income for a professional man.
Mr. Porter informs us of the amount eaten by a well-situated family:
“No. 1. In a private family residing in a fashionable part of London, and consisting of a gentleman, his wife, six children, and ten servants; in all eighteen persons, two-thirds of whom were adults, the consumption in the year 1840 amounted to:-
Per Diem Per Annum
6,668 lbs. meat, or for each person 1.01 lb. 370 lbs.
5,100 “ bread ” “ “ “ 0.78 lb. 283 “
541 “ butter “ “ “ “ 1.31 oz. 30 “
1,887 qts. milk. “ “ “ “ 0.28 qt. 104 qts.”
Porter, Progress of the Nation, 1851, Section V, Chap. V, Consumption of Families, etc., p. 583
a
RESULTS OF THE COLLECTION AND ANALYSIS OF DATA
The total amount of meat eaten in Great Britain is reported as 700 millions of pounds in 1801-1808, and as 3,800 millions of pounds in 1880 (including imports from Ireland and from the Rest of the World). These figures correspond to 67 pounds per population per year and to 3.0 ounces per person per day in 1801-1808; the figures for 1880 correspond to 121 pounds per population per year and to 5.4 ounces per person per day. Thus the average consumption per capita increased by a factor of 1.8x in the period of 70 years.
The above amounts are for “meat on the bone”; for “meat without the bone” they have to be multiplied by 60 %. The consumption for the father of the family in 1880, and calculating “meat without the bone”, would be 4.5 ounces per day, which is a little more than a MacDonald’s “Quarter Pounder”. On the other hand, the “Quarter Pounder” is 100 % beef, and the 19th century meat is an average of beef, mutton, pork, bacon, and ham.
The proportions of meat eaten by the different income classes changed considerably during our period. In 1801-1808, the inhabitants of London (the richest part of the country) ate 17 pounds per family per week, the inhabitants of the industrial towns 10 pounds, the agricultural laborers and the small farmers 2 pounds, and the rest of England and Wales 4 pounds. In 1850-1860, the inhabitants of London ate 17 pounds per family per week, the inhabitants of the industrial towns 9 pounds, the agricultural labourers and the small farmers 3 pounds, and the rest of Great Britain 10 pounds.
In Scotland up to 1800, practically no meat was eaten, except by the “better classes” in the towns, and by the landowners in the countryside. Considerable numbers of cattle were “driven” from all parts of Scotland into England. By 1830, the consumption of meat per capita in Scotland was close to that in England.
It is probable that the production and consumption of meat in England doubled from perhaps 1775 to 1795. The increased production was due to: i) previously, cattle and sheep were not used principally for meat; ii) horses were bred to be stronger, and therefore could replace the oxen in ploughing and in transport on roads, and the oxen were “freed up” for meat; iii) the process of Enclosures meant that the oxen and cattle would eat better plant food, instead of wild grass and shrubs; iv) the process of selective breeding of oxen, cattle, and sheep, for improvement of the meat content of the animal, by Mr. Bakewell and others.
The domestic production improved enough to cover the increase in population, that is, continuing the consumption levels in each region or occupation group. The imports starting in 1846, improved the consumption per capita in the working class (with the exception of agricultural laborers).
It is correct procedure to revise the numbers given for total amount of meat produced in these years. The data for 1867 must be very close to the real figures: i) the numbers of animals come from the Agricultural Census of 1867 (physical count), the average weights of the animals are generally accepted standards of the day, and the weight of the imported “dead meat” was from the discharge documents in the ports; the original presentation for the United Kingdom was made by Major Craigie of the Central Chamber of Agriculture. Working backwards, for 1854, the numbers of animals come from a partial livestock census in 11 counties in England, and a total livestock census in all the counties in Scotland. The 1808 numbers come from a generalized calculation by Arthur Young, presented to a Committee of Parliament; we may suppose that no one in England had a better idea of the numbers than he did. The 1801 numbers of animals come from the Livestock Census, of which we have reports still existing from 8 counties.
CONCLUSIONS
The real conditions during this this period were:
There was a considerable increase in the amount of meat eaten in England from 1770 to 1790;
In the decade of the 1800’s, the populations in London and in the Northern Industrial Towns ate well (10 to 17 pounds of meat per family per week), and the professional persons and the skilled workers ate about 6 pounds, but the rest of the population ate only 2 pounds;
By 1854, all of the population ate about 9 pounds per family per week, except the agricultural families, who still ate 2 pounds per week;
9 pounds of meat per family per week, corresponds to the content of a McDonald’s quarter pounder for the father of the family;
The major part of the increase per capita was due to the imports from Ireland and from Northern Europe (300 million pounds per year);
Imports of livestock from the United States only began in 1877.
10 pounds per family per week is 4.6 ounces per average family member daily, or 9 ounces per family head per day. 9 ounces “carcass” is 5.5 ounces “without the bone”, i. e. 1 ½ MacDonald “quarter pounders” per day.
From another point of view, we also have data as to the number of live cattle and sheep entering Smithfield Market in London in a number of years.
Year
Cattle
Sheep
Population London
Cattle/Person
Sheep/ Person
1780
102,000
706,000
750,000
0.13
0.94
1790
103,000
749,000
800,000
0.13
0.94
1800
125,000
842,000
864,000
0.14
0.97
1810
132,000
947,000
1,009,000
0.13
0.94
1820
129,000
1,107,000
1,225,000
0.10
0.90
1830
150,000
1,287,000
1,471,000
0.11
0.87
1840
177,000
1,371,000
1,873,000
0.09
0.73
1850
223,000
1,514,000
2,362,000
0.09
0.64
(To 1810: Tooke, 1823, Appendix XVI; from 1820: Porter, 1851, p. 581)
Note: the figures for 1840 and 1850 are less than the real amounts, as in these dates livestock was sold in other markets apart from Smithfield, and also country-killed meat was entering London by railway)
The edible weight of beef cattle was 500 lb. in 1800 and 700 lb. in 1850; for sheep it was 60 lb. in 1800 and 70 lb. in 1850.
Thus the average inhabitant of London ate 70 pounds of beef per year and 59 pounds of mutton in 1800, and at least 63 pounds of beef and 43 pounds of mutton in 1850. This corresponds to 12 pounds of meat weekly for a family of five in 1820, and 10 pounds of meat weekly in 1850.
“The metropolis is the grand mart to which a considerable proportion of the fat cattle from every part of the kingdom is sent. In the year 1830, there were sold in Smithfield, 159,907 cattle, 1,287,071 sheep, 254,672 pigs, and 22,500 calves, for the supply of the metropolis, and the villages and towns within a circuit of eight or ten miles, and occasional contracts for the navy. Besides this there is a great quantity of dead meat sent up from the country, generally speaking perfectly wholesome, and fairly and honestly slaughtered, although it is said that the flesh of some animals that did not come to their death through the hands of man, has occasionally found its way to Newgate market. There are inspectors appointed, who very impartially look after this. This is called the dead market, and may fairly be set against the consumption of the places in the neighbourhood of London, and also the irregular demands for the navy, so that the numbers just stated may be considered as fairly representing the consumption of animal food in the metropolis, exclusive of fish, poultry, and salted provisions.”
“The improvement of cattle has progressed with unsuspected rapidity since the middle of the last century; in many important points, it could hardly be said to have commenced at that time. After consultation with several of the most intelligent butchers of the metropolis, we are induced to take 656 lbs. as the present average dead-weight of bullocks (some butchers stated 85 stones Smithfield weight, none less than 80 – we have taken 82 stones). The average weight of the calf is 144 lbs., of the pig 96 lbs., and of the sheep and lamb 90 lbs., approaching to double the weight of these animals in 1730. This renders the number of cattle slaughtered in the metropolis and the increasing number of the inhabitants a little more proportionate.
We may now form some not very inaccurate idea of the amount idea of the amount of this branch of the provision trade in London:-
Average weight No. of lbs. consumed
Cattle 159,907 656 lbs. 104,898,992
Sheep, &c. 1,287,070 90 “ 115,836,300
Pigs 254, 672 96 “ 24,448,512
Calves 22,500 144 “ 3,240,000
__________
Number of pounds of meat consumed 248,423,804
This, estimated at the average price of 6d., would be 6,210,595 l. 2s. 0d. At 8d., it would produce 8,268,293 l. 9s. 4d., exclusive of bacon, hams, and all salted provisions brought from a distance (the importation of Irish bacon and hams into Great Britain is 500,000 cwt.), and also fish and poultry.
This calculation will enable us to determine another curious question,- what is the average quantity of meat consumed by each individual in the course of a year? If we divide the gross number of pounds 248,423,804 by 1,450,000, the estimated number of inhabitants in London and its environs, the quotient will be 170, or each individual consumes nearly half a pound of meat every day. This is a very high calculation compared with that of Paris, where each person is supposed to consume but 80 pounds in the year; and Brussels, where 89 pounds form the allotment of each; but ours is a meat-eating population, and composed chiefly of Protestants; and when we remember that this includes the bones as well as the meat, half a pound per day [0.4 pounds net edible weight] is not too much to allow to each person.”
(Youatt, William; Cattle: their Breeds, Management and Diseases, Baldwin and Cradock, London, 1834, p. 256, p. 257)
We have the following general considerations about the amount of meat consumed, by the eminent Scottish economist, John Ramsay McCullogh, in 1837:
“The change that has taken place during the last half century in the consumption of butcher’s meat, is still more extraordinary than that which has taken place in the consumption of corn. The quantity made use of has been wonderfully increased, and its quality signally improved. From 1740 to about 1750, the population of the Metropolis fluctuated very little; amounting, during the whole of that period, to about 670,000 or 675,000. Now, during the ten years ending with 1750, there were at an average, about 74,000 head of cattle, and about 570,000 head of sheep sold annually in Smithfield Market. In 1831, the population increased to 1,472,000, or in the ratio of about 218 per cent. : and at an average of the three years ending with 1831, 156,000 head of cattle, and 1,238,000 head of sheep were sold annually at Smithfield; being an increase of 212 per cent. on the cattle, and 217 per cent. on the sheep, as compared with the numbers sold in 1740-50. It consequently appears that the number of cattle and sheep consumed in London has increased, since 1740, about in the same proportion as the population. The weight of animals has, however, a good deal more than doubled in the interval. In the earliest part of the last century, the gross weight of the cattle sold at Smithfield did not, at an average, exceed 370 lbs., and that of the sheep did not exceed 28 lbs.; whereas, at present, the average weight of the cattle is estimated at about 800 lbs., and that of the sheep at about 80 lbs. Hence, on the most moderate computation, it may be affirmed, that the consumption of butcher’s meat in the Metropolis, as compared with the population, is twice as great at this moment as in 1740 or 1750.
In most other parts of the country, the increase in the consumption of butcher’s meat has been even greater. In thinly peopled agricultural districts, very little is consumed, but in manufacturing and commercial towns it is quite the reverse; and their vast increase, during the last half century, more than justifies the inference, that there has been, at least, a corresponding increase in the consumption of butcher’s meat.”
(John Ramsay McCulloch, A Statistical Account of the British Empire, Charles Knight, London, 1837; quoted in Love, 1839, note to page 159)
We can say that during all this period, the average inhabitant of Great Britain ate sufficient cereal and meat; the agricultural workers did not eat much meat. Obviously, there were many people who did not eat enough. Further, the amounts of cereal and meat per person remained practically the same from 1800 to 1850. The cases of large-scale hunger in certain regions or certain occupations were not due to insufficient production of cereals, but to extremely low incomes or extensive unemployment.
Herr Meidinger, who visited England in 1828, noted that the food consumed by the working classes varied considerably, depending on the income level:
“The main food of the local factory workers consists of potatoes, oatcakes and buttermilk and sometimes “bacon”. This is however only the case for the really poor. Those, who have a good enough employment, live at a better and more decent level, than the factory workers in France and Germany, as the wages in England are always in a good relation to the expenses.”
(Meidinger, 1828, p. 302)
Friedrich Engels observed the same situation:
“The habitual food of the individual working-man naturally varies according to his wages. The better-paid workers, especially those in whose families every member is able to earn something, have good food as long as this state of things lasts; meat daily and bacon and cheese for supper. Where wages are less, meat is used only two or three times a week, and the proportion of bread and potatoes increases. Descending gradually, we find the animal food reduced to a small piece of bacon cut up with the potatoes; lower still, even this disappears, and there remain only bread, cheese, porridge, and potatoes, until on the lowest round of the ladder, among the Irish, potatoes form the sole food. As an accompaniment, weak tea, with perhaps a little sugar, milk, or spirits, is universally drunk.”
(Engels, 1845, Ch. 4, The Great Towns)
The rapporteur to the Poor Law Commissioners in Lancashire in 1834, Mr. Tufnell, gave the following information as to the amount of food eaten:
“The mode of living of the factory workmen will be seen from the following extracts (page 130, First Report):-
“What do the factory operatives usually live on?” “They won’t take anything but the best of flour, potatoes, and mutton. I hardly go into one house but what I see they have beer; and they have five meals a day; breakfast at eight, lunch at eleven, dinner betwixt twelve and one, their bagging at four, and supper about seven.”
“For how many of these meals do they leave the mill?” “Breakfast, dinner, bagging, and supper; they only lunch in the mill, on beer, and bread and cheese.”
Do they eat meat every day for dinner?” “I think generally they do; they live full as well as most labouring people; better than farmers in general; they would not eat the same flour as is eaten in farm-houses.”
“Do they live better than the hatters and hand-loom weavers?” “Yes, they do; the hand-loom weavers are the most miserable part of the population; they scarcely eat meat once a week.”
Mr. Butcher, overseer [Poor Law administrator] of Salford, Hulme, and part of Manchester, says (page 62, First Report), that the factory operatives “in a general way have fresh meat about twice a week, fried bacon two days a week, and liver and a little bacon generally on a Friday, and the other two days bread and cheese, bread and butter, and water-gruel”. The overseer of the township of Heap, in answer to my question concerning the usual diet of the factory operatives, says, (page 142, First Report), they have either tea or coffee for breakfast, and fresh meat for dinner, and tea in the afternoon; and for supper, porridge, which some of the poorer classes have in the morning. The same witness also states, that the factory operatives are better off than any other class, except perhaps general mechanics, and that he has not had to relieve one spinner since he came into office.””
(Factories Enquiry Commission, Supplementary Report, Part I, D2 Lancashire District, 1834; Report by Mr. Tufnell, pp. 203-4)
In the case of the mill owners who had to give food and lodging to their employees, which means those in the areas outside of the towns, these obviously had to feed their people well. The spinning mill at Caton, in the uplands near Lancaster, gave more than sufficient food (oatmeal eight pounds per week; beef nearly one pound per week; milk 7 quarts per week; potatoes 6 pounds a week):
The mill had a schoolmaster for teaching the children, who lived in two houses (separate for boys and for girls).
(Board of Agriculture, General View of the Agriculture of Lancashire, 1815; Sect. VII, Price of Products and Expenses, pp. 626-628)
The inspectors working for the Poor Law Commissioners in their report of 1842 found that the industrial workers in Birmingham ate very well:
“Many of the workmen are supplied with their dinner from small cook-shops, cooked meat is sold to them at the rate of 1s. per pound; a workman will pay 3d. for a plate of meat and 1d. for potatoes or bread, and this constitutes his dinner, and he is well satisfied with it. Many publicans retail cooked meat at the above-mentioned price, and they remark that this quantity of meat quite satisfies the mechanic for his dinner, but it would require double the quantity to dine an agricultural labourer. The meat of the working man is more frequently roasted or fried than boiled, although one-half more fuel is expended in roasting a joint than would keep the pot boiling. The inferior joints of meat are sometimes cooked with vegetables, and made into a stew, and sold at the rate of 9d. per pound; but this is much less frequently purchased at the cook-shops by the working man, than the roasted meat. Soup is sold at these shops at 1d. per pint; a half-pint of soup and a piece of bread often comprises the dinner of an elder working man. There are as many as 95 of these cook-shops in this town. The wives and children dine principally on bacon and potatoes. The more careful housewife buys what are called bits of meat at 5d. a pound – these she stews with potatoes and onions, and forms a wholesome and nutritious meal for herself and her children.
The workmen in this town drink principally beer and ale, which, generally speaking, is very wholesome and well brewed. They drink large quantities of low-priced beer sold at 2d. or 3d. per quart. Spirits are not much drank [sic] by the working mechanic. The habit of drinking foreign wines is growing among the better class of workmen.”
(Poor Law Commissioners, Local Reports, 1842, Birmingham, p. 212)
The most pessimistic report about the amount and the quality of food consumed in the industrial towns, is to be found in the short book “The Moral and Physical Condition of the Working Classes employed in the Cotton Manufacture in Manchester”(1832) by Dr. Francis Kay. The book served as a source for Engels’ statements about the horrible conditions of the working classes. Dr. Kay worked as a doctor in Manchester for a few years, and was later a well-known politician of liberal leanings, and very interested in improving the education of the lower classes. He gives us a number of insulting descriptions about the life and habits of the workers in Manchester, particularly the Irish. The living and sanitary conditions are disgusting. According to his data, the operative works in the factory from 6 to 8 a.m., returns home for a breakfast of tea or coffee with a little bread, for lunch he has a mess of potatoes with melted lard or butter and sometimes pieces of fat bacon; for supper he has tea and a little bread sometimes with oatcakes. Those with better incomes may eat a little animal food, but no more than three times in the week. It seems to be impossible that a man could do hard physical labour on so little food.
But the explanation is in the preface.
This means that the very bad image that we have of Manchester in the early Industrial Revolution, comes from a list of descriptions which only refer to the worst part of the city.
a
CONCLUSIONS
The real conditions during this this period were:
There was a considerable increase in the amount of meat eaten in England from 1770 to 1790;
In the decade of the 1800’s, the populations in London and in the Northern Industrial Towns ate well (10 to 17 pounds of meat per family per week), and the professional persons and the skilled workers ate about 6 pounds, but the rest of the population ate only 2 pounds;
By 1854, all of the population ate about 9 pounds per family per week, except the agricultural families, who still ate 2 pounds per week;
9 pounds of meat per family per week, corresponds to the content of a McDonald’s quarter pounder for the father of the family;
The major part of the increase per capita was due to the imports from Ireland and from Northern Europe (300 million pounds per year);
Imports of livestock from the United States only began in 1877.
10 pounds per family per week is 4.6 ounces per average family member daily, or 9 ounces per family head per day. 9 ounces “carcass” is 5.5 ounces “without the bone”, i. e. 1 ½ MacDonald “quarter pounders” per day.
The population of Manchester Township (the sum of the 14 Police Districts) was 142,000 in 1831, and of the whole of Manchester plus Salford plus suburbs 270,000. In 1841 the population of the Township was 163,000, and of the conurbation, 354,000.
From the different chapters of this work, we can present a table of the weekly consumption per family of “butchers’ meat”, also the daily input of calories per average person.
But in 1840-60, the people in the London “sweated trades”, and in the domestic industries in the smaller towns, ate less than 2 lbs. of meat per family per week, i.e. less than 0.4 lbs. per person.
The pattern of consumption of cereals for bread changed from 1800 to 1850. In 1800 wheaten bread was generally eaten in the South and East of England, rye in Yorkshire and the northeast of England, oats in Lancashire, and barley in Wales, the East Midlands, and the southwest of England. But by 1850, practically all England was eating wheaten bread.
“This enormous Consumption [of wheat] may not only be attributed to the great Increase of Consumers, but the different Habits of living, and the almost general Adoption throughout England and Wales, of the finest Flour, instead of Household; and that the lower Class, or labouring Poor, consume a greater Proportion of Bread Corn than they otherwise would, through the high Price of all Kinds of Animal Food.
This Change of Bread Corn is particularly observable in, and felt by the County of Yorkshire alone. The West Riding of that County alone, containing 565,000 People, and nearly as populous as London as Westminster.
The Vicar of Wakefield attributes the principal Cause of Scarcity, in the Difference of the Consumption, more especially in that County, and observes that the prodigious Number of Tradesmen, Mechanics and Husbandmen, who twenty Years back subsisted on Oat and Barley Cakes, as their favourite Diet, now consume none but the best Wheaten flour.”
(Benjamin Pitts Capper, A Statistical Account of the Population and Cultivation, Produce and Consumption, of England and Wales, G. Kearsley, London, 1801)
As the largest part of the expenses of the labourers and their families was for cereals and breads, and the prices were very different between wheat on the one hand and barley, rye and oats on the other hand, it is important to define the percentages used for each one. The figures would also have to reflect the change from the inferior cereals to wheat in some regions of England during the eighteenth century.
For the period 1760 to 1780, it appears that the proportions should be:
Wheat 63 %, rye 15 %, barley 12 %, oats 10 %.
“ … But the most minute and curious statement we can find upon this statement is that given in the second edition of Mr. Charles Smith’s Three Tracts on the Corn Trade and Corn Laws, which although not published till 1766, may be regarded as referring rather to a date a few years earlier, when the inquiries upon which the calculation is founded were made.
…..
To obtain all the certainty possible in the matter, inquiries were made in every direction; the supply of several sorts of grain to the London market was taken into consideration; communications were opened with persons living in or travelling into each county; and in particular conversations were held with the labouring people themselves of various districts, as being best acquainted with their own circumstances and the food they lived upon. By combining the results of all these modes of investigation Mr. Smith and his coadjutors arrived at the following conclusions:- 1. That in Wales, the number of inhabitants being calculated from the number of houses at 270,450, of these 29,344 eat wheat, 127,585 barley, and 113,521 rye; ….. . On the whole, then, according to this calculation, the entire population of England and Wales being taken, in round numbers, at 6,000,000, the eaters of wheat about the end of the present period [1760] would be 3,750,000, of barley 739,000, of rye 888,000, and of oats 623,000. In other words, fully five-eighths of the people of England at this time lived upon wheat; and of the remainder, rather more than an eighth on rye, about an eighth on barley, and rather less than an eighth on oats. …… Wheat, it appears, already constituted the food of the great majority of the people in all the southern and midland counties; barley was consumed by the majority of the people only in Wales; rye was not eaten at all in the five south-western counties, but in the five northern counties was the ordinary food of about a third of the people; oats were the food of another third of the people in the northern counties, and of considerably more than a third of those of Lancashire and the rest of that group, but were only used to a very small extent in the midland counties, and not at all in any other part of the kingdom.
George Lillie Craik, Charles MacFarlane; A Pictorial History of England, 1688-1760, Vol. IV, Chap. VII History of the Condition of the People; Charles Knight & Co., London, 1841; p. 850
In order to take measures to reduce the suffering due to the scarcity of wheat in 1800, the House of Lords requested an investigation into the consumption of wheat, which gave information which leads to percentages which could be used for 1780 to 1799:
Wheat 60 %, rye 10 %, barley 15 %, oats 15 %.
“With a view to bring more particularly before your lordships the consideration of the different resources to which recourse may be had on this occasion, to economize the consumption of wheat, the Lords’ Committees have entered very extensively into this branch of the subject referred to them. The most natural and obvious substitutes for wheat are the other grains of the growth in this kingdom, barley, oats and rye. With respect to these, the Lords’ Committees have been informed, that a much larger proportion than is perhaps generally understood, of the northern parts of England, has always continued in the habit of consuming oaten bread, and that in the midland and western counties, barley enters largely into the food of the labouring classes; and they trust that these facts, strongly urged and impressed upon the public mind, will tend to remove an ill-founded prejudice which your Committee are informed still exists in this metropolis, and in its neighbourhood, against the use of any other bread other than that made from the finest wheaten flour.
The Lords’ Committee have found, that, in most parts of the kingdom where the inhabitants had formerly been accustomed to the use of bread made with a mixture of barley, or with barley alone, and where, within a few years, that diet had been partially changed for wheaten bread, recourse had almost universally been had to their former food; and that, in some parts of the kingdom, where mixed bread had not before brought into general use, this mode (which your Committee, conceive to be far the best) of economizing wheat, has recently been adopted.
Barley– The testimonies of all the persons from the different counties, who have been examined on this point, are uniformly in favour of barley, as the most nourishing and cheapest article of food, whether as an entire substitute for the use of wheaten bread, or in mixtures with wheaten or other flour.
It is stated to your Committee, that in a considerable part of Devonshire little else is used among the poorer classes than bread made entirely of barley; that in ordinary years one-eighth part of the consumption of the county of Dorset is in barley, and that in this year it has been one-fourth; that on the hills, in Gloucestershire, it has been used with wheat, in the proportion of one-half, and in the vale part of the same county, in that of one third. That in some parishes of Nottinghamshire and Huntingdonshire, and other of the midland counties, they use bread made entirely of barley; that the use of mixed bread has become general in parts of Bedfordshire and Buckinghamshire; that in Lincolnshire the poorer classes who (within the memory from whom this testimony was received) had exchanged the use of barley bread for wheaten, returned last year to barley bread; that in Yorkshire and Lancashire the use of it has been much extended; and that in Scotland a considerable quantity of barley meal was substituted for oats during the last season, and has given satisfaction.
…..
Oats.- With respect to oats, the crop of which, in England, appears to have been equal to an average crop, the committee find, that the consumption of this article which, is used almost universally in Scotland, and in some of the bordering counties of England, has also been extended in Lancashire and in other parts of the kingdom; …
…..
Rye.- Rye is an article less generally consumed in this kingdom than either of the preceding grains; but it is used alone in bread amongst the pitmen and other labourers of the county of Durham and Northumberland. It is mixed with wheat in some parts of the North, and experiments have been made by mixing it with other grain for bread.”
Lords’ Committees on the Dearth of Provisions; Second Report, Dec. 15, 1800; Cobbett’s Parliamentary History of England, Vol. 3
But taking into account the information above, that “where, within a few years, that diet had been partially changed for wheaten bread, recourse had almost universally been had to their former food”, and also from the note below, that there was a large change to barley in the years after 1800, in order to economize the cost of food in the family budget, the percentages for England should be changed to:
Wheat 40 %, rye 10 %, barley 30 %, oats 20 %.
The change in food choices is commented by E. J. T. Collins:
“That choice of cereal was price and income elastic, and that pre-industrial patterns endured until at least the early nineteenth century is verified by the government inquiries of 1796 and 1800, which show not only a marked decline in per capita cereal consumption, but also a widespread substitution of barley, and to lesser extents, of oats, pulse, and rye, for wheat, and of browner for whiter flours.
Positive aversion to the use of wheat substitutes was more apparent in 1796 than in 1800, but was in both years confined to a few southern and eastern counties, in particular, London and Middlesex, Berkshire, Buckinghamshire, Essex, Hampshire, Hertfordshire, Kent, Oxfordshire, Surrey, Sussex, and Wiltshire. Here it was probably true, as at Wootton Bassett, that the “lower orders” preferred “half a loaf of fine Wheaten Bread, to a pound of mixed with any substitute.” The only important concession was a switch from first- to second- and third-quality flours.
Elsewhere in Britain, and even in parts of the above-mentioned counties, substitution was the general rule. In 1796 one-third of the population of Calne (Wiltshire) ate barley bread alone, and another third a two-to-one mixture of wheat and barley. In 1800, partly because cereal prices were higher and partly because the backbone of resistance was already broken by the earlier crisis, coarser grains were more extensively resorted to than in 1796. Of the almost 500 towns and villages replying to the government circular, most claimed a reduction in wheat consumption of between 30 and 50 per cent. The greater part of the “labouring population” of southern Britain then subsisted, largely if not completely, on barley, while in the north wheat lost most of the ground it had gained there since the mid-eighteenth century. Large quantities of rye were imported to help bridge the gap. In Barkway (Hertfordshire) a “wholesome nutricious [sic] Bread made of Half Wheat and Half Rye” was employed by the “poor People, many Farmers and the little Tradesmen””
(Dietary Change and Cereal Consumption in Britain in the Nineteenth Century, 1975, pp. 104-105)
For the period 1816 to 1825, the same proportions as for 1780 to 1800 should be used, as the price of wheat returned to normal levels.
Wheat 60 %, rye 10 %, barley 15 %, oats 15 %.
The use of these parameters impacts strongly on the ratio of earnings to expenses in the period 1800 to 1815. If we use the numbers above, we have a situation in which the farm worker population can buy enough to eat, but if we continue with wheat at 60 %, there is a large negative gap. The labourers could buy enough to eat, but at a cost of reducing their “food standard of living”, eating barley bread instead of wheaten bread, and (the poorest segment) eating large quantities of potatoes.
Equivalent Proportions of the Population of Great Britain consuming the different Quantities of Grain (per cent)
England and Wales
Scotland
Great Britain
Wheat
1800
66
10
58
1850
88
44
81
1900
97
84
95
Barley
1800
17
10
16
1850
3
5
4
1900
1
1
1
Oats
1800
15
72
24
1850
9
50
15
1900
3
15
5
(Collins, 1975, p. 114)
The increase required in wheat production, in order to compensate for the difference in proportions between the cereals, would be about 15,000,000 persons times 25 % change in preferences times 1.0 quarters / person, equals 3,750,000 quarters per year.
A very important group of data for the quantification of the living standards of the population in nineteenth century England and Wales, would be the calculation of the per capita consumption of cereals (in particular, wheat). This, naturally, is derived from the sum of domestic production and imports, divided by the number of the population. It may be expressed as pounds of grain per person per day, or pounds of bread per person per day.
There are no series of figures in academic publications for domestic production in quarters (480 lbs.) per year, or imports in quarters per year, for the nineteenth century. There is only one investigation which gives the estimated yearly sales (Susan Fairlie, 1976). There are also no figures responding to the question: was the sum of domestic production and imports enough to cover the requirements of the population?
This situation has given rise to the ideas:
The people had an insufficient consumption of wheat for their biological necessities, in the period 1815 to 1846 (abolition of the Corn Laws), because the domestic production was low, and imports were not permitted;
The people had an insufficient consumption of wheat for their biological necessities, in the period 1846 to about 1870, because the domestic production was low, and the imports from Europe were not enough;
The situation from 1870 onwards, was of sufficient wheat, and this improvement was caused by massive imports from the United States, and other countries outside Europe.
All the figures in this investigation come from sources of the nineteenth century. They are either officially reported figures, or quantitative verbal expressions by experts of the time. These last are certainly valid, because THOSE PEOPLE WERE THERE, AND WE WERE NOT THERE.
The arithmetical conclusions of this investigation are:
From 1816 to 1838, domestic wheat production was enough to cover the requirements of the population; in only four years were there imports of more than 5 per cent of the demand;
In 1820 to 1825, and from 1833 to 1837, there were practically no imports; in 1833 to 1836, there was such an excess of production from the harvest, that large quantities of wheat had to be given to horses and cattle;
From 1839 to 1880, wheat was imported in large quantities, increasing from 25 per cent to 40 per cent of the total consumption;
Domestic wheat production was maintained at between 10,000,000 and 15,000,000 quarters during the whole period;
Per capita consumption was in the range of 6.0 to 7.2 bushels yearly per average person, or 1.0 to 1.2 pounds of bread daily per average person, or 1.3 to 1.6 pounds of bread per adult male.
The above amounts were taken to be enough for the energy requirements of the average person;
It is not possible to find data for the years in the period 1816 to 1880, as to the additional human consumption of oats, barley, and rye.
Previous investigations
There are a few calculations of production of wheat in pounds / total population / day (data points of every 50 years) based on estimates of acreage and of yields per acre, by: Broadberry (2011); Floud, Fogel, Harris, Hong (2011); Muldrew (2011); Harris, Floud, Hong (2015). These estimations do not make use of reports describing harvest volumes, or of contemporary observations as to amounts eaten by the people.
An important improvement in this investigation, is that the proportions for seed reserve, milling, distribution, and wastage are taken from nineteenth-century sources (see the discussion some pages below: “Parameters”). This proportions are much less than those used in the investigations noted in the table above. The following table shows in each first line of numbers, the production as calculated in the investigations, and in the second line, the corrected values according to the contemporary information.
Broadberry (2011)
1800/9
1850/9
Production volume, net of seed reserve
0.61
0.66
Floud, Fogel, Harris, Hong (2011)
1800
1850
Seed reserve 14.5 %, milling and distribution 38 %
After the adjustment, the values per diem for 1800 and 1850 are 0.65 to 0.70 pounds / total population / day.
The present investigation gives us figures to compare with the data in the above table, of production in 1800 = 1.00, in 1850 = 0.80; and consumption in 1850 including imports = 1.20.
Inspected Markets
From 1829 onwards we have as a data source, the Corn Returns, which were the quantities in bushels and the prices registered of the farmers’ sales in the main towns in England and Wales. The list of towns from 1829 to 1842 included 150 points of sale, in 1843 to 1864 there were 290 towns, and from 1865 there were the same original 150 towns.
One might suppose that it would be possible to estimate the total amount of domestic wheat sold in a year, in all the markets of the country, taking the sales in the Inspected Markets, and multiplying by a constant.
Mr. J. T. Danson did this for the years 1844 to 1854, multiplying the sales in Inspected Markets by a factor of 14 / 5. Unfortunately, we do not know how he decided the factor of 14 / 5.
(On the Current Price, and the Cost Price, of Corn, in England, during the Last Ten Years, as Illustrating the Value of Agricultural Statistics; Journal of the Statistical Society of London, Vol. 18, No. 1 (Mar., 1855), pp. 3-20; https://www.jstor.org/stable/2338121)
Susan Fairlie in 1969 suggested using a factor of four times, for the periods 1829-1830 to 1841-1842, and for 1865-1866 and later. But also here, we do not know the origin of the multiplication factor.
We cannot be sure that these multiplicative factors correspond to the relation (generalized over a number of years) between the total wheat sales in the country and the sales in the Inspected Markets. But the advantage is that these are actually sales of each year, and thus show the consumption by the population. The yearly numbers in this investigation are based on the estimated harvest production in each case, and thus are inflated in the cases of high harvest amounts, which could not be eaten in the same harvest year.
But the good news is that the “Danson/Fairlie” figures and the numbers in this investigation, are close to one another. This gives us a high probability that these numbers do correspond to the real total harvests / sales in each year. There can be differences between the two series in some cases, because one is physical harvest, and the other is sales.
GRAPH 1: Wheat Sales Domestic Production, Comparison Available for Sales against Danson / Fairlie (Quarters per Harvest Year).
The Available for Sales curve and the ‘Danson / Fairlie’ curve both show the high amounts in 1833 to 1836, when the harvest was very large, to the extent that the excess amount had to be given to pigs, cattle, and horses; also the low amounts in 1838-1839 which caused deaths in those and subsequent years, and were part of the recession up to end 1842. There are differences in the absolute figures for the period from harvest years 1835-1836 to 1845-1846. We can be sure that the ‘Danson / Fairlie’ numbers in these years are wrong in an absolute sense; the imports were high in those years, and if the ‘Danson / Fairlie’ numbers were right, then the total amount available for consumption would be excessive.
Liam Brunt
Liam Brunt published a paper in 1999, on Estimating English Wheat Production in the Industrial Revolution. This attempted to calculate the yearly wheat production from 1700 to 1860, using estimated inputs from yields, crop rotation, acreage, and “weather shocks”.
a
Unfortunately, the resultant graph gives us values of 1.2 to 1.4 quarters per person per year (1.5 to 1.8 pounds per day) in 1700 to 1780, that is, in a period when only 60 per cent of the population ate wheat (the rest: barley, oats, rye); this would mean a total consumption of all types of cereal of 2.6 pounds per average person per day, which would not be possible to digest.
Further, it is not clear how the yearly domestic output increased by 50 per cent from the 1820’s to the 1840’s (in 1822, the real harvest was so large, that the price of wheat was at its lowest in 25 years).
Parameters
The investigations commented at the beginning of this paper, and which used the gross and net amounts of harvest, required assumptions for: reserve for seed, loss in milling the grain, wastage from storage and transport. Following we have amounts for these parameters, taken from publications of the period. These numbers are much smaller than those utilized in the investigations alluded to, and thus the net amounts available, as there shown, are much too small.
Reserve for seeds for the following year
“The quantity of grain used for seed corn is generally estimated at about six weeks consumption.” [12 %]
Commons Committee, First Report on the High Price of Provisions, 1800
In a number of tables of the following report, the figure of 2 ¼ bushels per acre is given as a component of the operating costs. Batchelor, Thomas (Farmer), Expense and Profit of Arable Land, in: Board of Agriculture, General View of the Agriculture of the County of Bedford, 1808, p. 70 et seq.
In the “Home Produce, Imports, and Consumption of Wheat” by Lawes and Gilbert, an amount of 2 ¼ bushels per acre was subtracted from the gross yield.
In this report, we use a subtraction of 10 %.
2. Loss in milling the grain.
The absolute maximum amount (biological) of endosperm which can be extracted from the seed is 83 per cent.
In 1800, experiments were carried out by instruction of the Select Committee of the Commons on the High Price of Corn, which gave figures very close to 80 per cent.
According to the following source, the fraction which was generally extracted was 80 per cent.
“H” (not identifiable), Of the Quantity of Bread-corn required yearly to maintain the Inhabitants of Great Britain, The Farmer’s Magazine, Edinburgh, 1801, p. 132
3. Wastage
There could not have been much wastage due to animal pests. The sheaves were kept in places where it was difficult for the rats and mice to enter (some buildings were on posts). The grains after threshing were kept in closed sacks, both in the barn and in transport. About one half of the wheat was consumed on the farm or in the nearby village, so only the other half might have had some sort of damage in the journey to the place of consumption. In any case, in the great part of our period, the medium length journeys were made in canal boats, so there could not be much damage from the movement. There are no mentions of mold on the grains (a few cases on the growing plants).
It does not seem plausible that the inhabitants of the technologically most advanced country in the world at that time, would accept a 10 to 15 % reduction in the volume of food that they could eat – or that the farmers could sell – just because they did not know how to take precautions in storage and transport.
See “Practical Agriculture; or a Complete System of Modern Husbandry” (1805) by R. W. Dickinson, in which the author devotes 25 pages (pp. 788 – 813) to all the necessary precautions to avoid losses in cutting, collecting, thrashing, and storing the wheat.
Detailed contemporary calculations of production and consumption do not mention any losses due to “wastage”.
Units
A quartern loaf of bread was – by statute – made from 3 lbs. 8 oz. of flour, and weighed 4 lbs. 5 oz. for sale to the public.
1 quarter = 8 bushels = 480 pounds
1 bushel = 60 pounds
1 million quarters of wheat was food enough for 1,200,000 persons in one year.
The «Harvest Year» was counted from the date of the harvest, i. e. the Harvest Year 1829-1830 was from September 1829 to August 1830.
Sources
The first estimate that we have of the real human consumption of cereals is from Charles Smith in 1758, as follows. He made the calculation on the basis of the real food habits of laborers (he has about 20 pages of detailed information).
Numbers of the People. Consume annually each. quarters bushels
3,750,000 Wheat 1 0
739,000 Barley 1 3
888,000 Rye 1 1
623,000 Oats 2 2
(Charles Smith, Three Tracts on the Corn-Trades and Corn Laws, J. Brotherton, London, 1758, p. 140)
For the year 1800 we have a detailed estimation of the quantity of cereals required in Great Britain: “H” (not identifiable), Of the Quantity of Bread-corn required yearly to maintain the Inhabitants of Great Britain, Farmer’s Magazine Edinburgh, 1801, pp. 131-139.
The calculation is made out for an assumed population of 10,000,000, in a normal year around 1800 (exactly 1799 and 1800 were bad years, with harvests 25 per cent below normal).
Production of wheat 7.5 million quarters, and of other grains 4.1 million quarters.
Consumption of wheat bread per person who ate wheat = 22.7 ounces per day (p. 133), and over the whole population = 16.8 ounces (p. 137).
It is supposed that no imports are necessary.
For the years 1801 to 1815, it was/is impossible to quantify the production, as we do not have any contemporary statements of the format: “the harvest was X % less/more than a normal year”.
The sources for the volumes of harvest production and of sales from the farmers are the following. The difference between the two numbers was the amount of seed retained for a reserve for planting for the next year, and this was about 10 per cent of the harvest figure.
Year
Harvest Production and Sales Wholesale
1816-1817 to 1828-1829
Mr. Jacob, Inspector of Corn Returns, own official investigation, Available for Consumption
1828-1829 to 1831-1832
Mr. Jacob and Mr. Hodges, Select Committee on Agriculture, 1833
1832-1833 to
Mr. Tooke, A History of Prices,
1854-1855
Yearly changes in harvest quantities
1855-1856 to 1867-1868
Lawes and Gilbert, On the Home Produce …., 1868, available product
1868-1869 to 1879-1880
Agricultural Statistics, The Corn Crop, Journal of the Statistical Society of London, Dec. 1880, Available Product
In the third case, the original document gives the production figure, and this text subtracts 10 per cent seed reserve to give the sales quantity. In the other cases, the original document gives the sales figure, and this text adds 10 % seed reserve to give the production quantity.
Mr. William Jacob, Inspector-General of Corn Returns, 1816-1827
The first data that we have on an annual basis, are those of Mr. William Jacob, the Inspector-General of Corn Returns, who in 1828 made a detailed calculation to be presented to Parliament (having corresponded in writing with many of the important landowners and traders) of the production for the years 1816-1827. He gives figures from 11,000,000 to 13,000,000 quarters for England and Wales, with the exception of 1816 of 9,000,000 (the “Year without a Summer”) and of 1820 with 16,000,000 million. He says that he is convinced of the exactness of the relation between the production of the different years, and takes as a basis a consumption of 12,000,000 quarters in a normal year, “though I have reason to believe that what is used as food somewhat exceeds that quantity”. He also gives an arithmetical conciliation of production, consumption, imports, seed reserve, and stocks for these years.
(quoted in Tooke, Vol. V., p. 103.)
Mr. Jacob and Mr. Hodgson, Select Committee on Agriculture, 1833.
“Do you bear in mind how much the harvest of 1816 was deficient?” “I believe very nearly three months’ consumption, perhaps four months; the harvest of 1828 was deficient, in my judgment, rather more than six weeks’ consumption.”
(Select Committee Agriculture, 1833, Mr. Jacob, Q. 52, p. 5)
“Is it not the case that the seasons since 1828 have been all deficient, and pretty nearly equally so?” “No, the year 1828 was certainly deficient; the year 1829 was deficient about its average; the year 1830 about the same; the year 1831 about the same; 1832 would have been deficient, but that the harvest happened one month earlier than usual.”
(Select Committee Agriculture, 1833, Mr. Jacob, Q. 72, p. 8)
“Is the Committee not to infer that the diminish [sic] in supply of home growth must be ascribed to some other cause than the seasons?” “I mean to say that I am unable to ascribe the deficiency to season, or any other particular cause, but to state the fact that the four years from 1828 to 1831 have been seriously below an average; on the aggregate 9 per cent., and 1828, the most defective of the series, about 15 per cent. below an average.”
(Select Committee Agriculture, 1833, Mr. Hodgson, Q. 719, p. 38)
Mr. Tooke, “A History of Prices”
Mr. Tooke was a corn merchant, a writer on finance, and an expert witness to Parliamentary Committees; he wrote “A History of Prices” in six volumes referring to financing, banks, liquidity in the country, and the corn trade. For the years 1832 to 1855, we use the reports of Mr. Tooke about the volumes of wheat brought to market, usually as comments of the increase or decrease against previous years.
The basis for the absolute harvest volumes, comes from his information about the years 1834 to 1838, as follows:
“As every part of the ground of the estimate of the supply is vague, so likewise is that for an estimate of consumption. The average consumption of wheat as food for man, and consequently excluding the extra consumption of it for cattle and other purposes, in 1834-35, has been variously estimated by some as 8 bushels per head of calculation, while by others it has been thought to be more nearly 6 bushels. This last, which appears to me to be the most reasonable computation, would, for the present estimated population of Britain, (being, if the ratio of increase has continued since 1831, about 18 millions of souls,) at 6 bushels each, be 13,500,000 quarters, which, with the quantity requisite for seed, would make the aggregate produce required for consumption as food and seed about 15,000,000 of quarters, rather perhaps more than less. The produce of 1835-6-7 having been, by the excess of the two former seasons, against a bare average in 1837, probably an aggregate average of 16,000,000 of quarters, the deficiency of 1838, if taken in comparison with those three years, and estimated at one fourth less, would be 4 millions of quarters, and if taken with reference to the mere necessary consumption, would leave a deficiency of somewhat about 3 millions of quarters, as the minimum to be made up by foreign supply.
……
There is reason to believe, from the surveys at the time, from concurrent testimony of farmers, and from the large quantities of wheat of 1834 which were in the markets during the two or three following years, (not only as may be supposed by the population being in the fullest employ at good wages, but for cattle-feeding and other unusual purposes) that the produce of that crop was more nearly a third than a quarter, that is, more nearly 5 millions than between 3 and 4 millions of quarters, above an ordinary crop. The difference, therefore, between the crops of 1834 and 1838, must have been something like 7 to 8 millions of quarters.” (Vol. III, pp. 12-13)
The population of England and Wales in 1835 was about 15,000,000, and that of Scotland was 2,700,000. Then the ‘normal’ consumption in Britain in 1834-1835, on the basis of 6 bushels would have been about (15,000,000 + 2,700,000) x 6 = 106,000,000 bushels or 13,275,000 quarters. Practically 100 per cent of the population of England and Wales, but only about 30 per cent of the population of Scotland ate wheaten bread, so that in all Britain the consumers were 15,000,000 + (2,700,000 x 0.30) = 15,810,000. The per capita consumption of the wheat-eaters in Britain would have been about 13,275,000 / 15,810,000 = 0.84 quarters or 6.7 bushels. The total normal consumption in England and Wales would have been 15,000,000 x 0.84 = 12,600,000 and thus the harvest quantity would have been 12,600,000 / 0.9 = 14,000,000 quarters.
But Tooke estimates that the real production from the harvest of 1834 was about 30 per cent above a normal crop, and thus would have been 14,000,000 x 1.3 = 18,200,000 quarters. In our calculations, we have put a round figure of 18,000,000. The figure for the 1838 harvest is given as 9,500,000 quarters, which is 6,500,000 less than 1834.
Lawes and Gilbert, 1855-1856 to 1867-1868
These gentlemen were two agricultural scientists who had some plots of land at Rothamsted, on which they grew wheat, with different characteristics of the soil, and of the manure, and of the general maintenance of the plots. The characteristics for each plot were held the same over many years. Particularly, the variety of wheat was the same in each plot. Each year, they calculated the yield per acre, and the average over all the plots.
They made a calculation of the theoretical production of each harvest-year, as per the following definitions.
The acreage for the country in their report was formed by interpolation between the estimate of Mr. Caird in 1850 of 3.4 million acres in England and Wales, and the Agricultural Returns of 1866 of 3.1 million acres.
The Yields per Acre were taken from the yearly data of the plots at Rothamsted.
Harvest Production is the multiplication of Acres with Yield per Acre
Available for Consumption results from subtracting 2 ¼ bushels per acre for the seed reserve.
The principal report of Lawes and Gilbert gives us a reverse-calculation of some of the data for the periods of Harvest Years 1852-1853 to 1859-1860, and 1860-1861 to 1867-1868.
Agricultural Returns of 1866 and 1867
Very important documents for “anchoring” our data are the Agricultural Returns of 1866 and of 1867. These gave a large number of figures as to acreage and gross yield per acre, and thus the total harvest production, in that year. They reported upon the whole country on the basis of physical count (the total printed report was 500 pages). See the section of ‘Acreage’ below. The acreage of wheat in England and Wales in 1866 was 3,240,000.
Agricultural Returns 1868-1869 to 1879-1880
For 1868-1869 to 1879-1880, we have numbers taken by physical count of acreage and estates of yield per acre, each year, in the official Agricultural Returns, with the same processes as the Agricultural Returns of 1866-7.
Harvest (net of seed), England and Wales
Yields in Bushels per Acre
Our contemporary sources are:
Year
Yields in Bushels per Acre
1816 to 1838
Physical counts in different parts of the country by Cropper, and by Sandars
1839 to 1841
[Interpolation of the value “28.0”]
1842 to 1866
Average of 22 farms and experimental stations, as given in the “Agrarian History of England and Wales”
1867 to 1880
“The Corn Crops of 1880”, Journal of the Royal Statistical Society, Dec. 1880
The yields of wheat, measured in bushels per acre, changed considerably from year to year, and from county to county. Thus it is/was difficult to assure a figure over the average of the country in a given year, and to distinguish a continuous movement of the figure through the years.
The figure quoted for production was usually “before reserve for seed” (for the next year’s planting), but for our reconstruction of food consumption we have to use “after reserve for seed”, which was about a 10 % decrement.
As to an estimation of the real unit yield of wheat in each year, Mr. Thomas Tooke describes a physical investigation made yearly by wheat merchants, Cropper, Benson, and Company, from 1813 to 1836, and a Mr. Sandars (who took over their company) from 1837 to 1855.
“The surveys were set on foot for a purely business purpose – namely, of placing before the members of the firm, as authentic a statement as possible of the probable yield of the harvest of England in each year; the materials of the statement being collected by persons more or less competent – travelling for the express object, a short time before the harvest, always through the same selected districts of country; pursuing year by year the same methods of observation and confining themselves rigidly to the single question of the yield per Acre of Wheat, as stated in Bushels of a weight of 60 lbs. each.”
(Tooke, A History of Prices … 1848-1856, 1857; p. 119)
“What are the districts of country generally included in this survey of 1,000 miles?”
“We have generally commenced in Kent, and gone down the whole of the east coast down to Berwick, and once or twice to Edinburgh, as one part of the survey; the others we have taken from Liverpool through Cheshire, Shropshire, Worcestershire, Herefordshire, round by Birmingham, and taken in the whole of Warwickshire and Staffordshire, and come round in that circuit here again.”
(Agricultural (Commons) Committee, 1821, page 263. Evidence of David Hodgson, Esq., 12th April, 1821; quoted in Tooke, op. cit., p. 121)
“In what way did you make that Survey?” “Men are sent all over the country, and they are provided with a machine that cannot err; by a movement made it embraces a certain space, the stalks in that space are counted, the number of grains is counted and then weighed.”
(Agricultural Commons Committee, 1836, Evidence of Mr. Sandars; quoted in Tooke, op. cit., p. 121)
(Actually a metal grid one yard square was thrown at a random position in the field)
It must be clear that this survey was the most exact that could have been made in those years, and that the merchants were convinced of the usefulness of the work, otherwise they would not have paid out the salaries of the employees.
For 1842 to 1866, we use here a study of the average values in 22 farms and experimental stations (The Agrarian History of England and Wales, ed. E. J. T. Collins, Joan Thirsk, Vol. VII, Part 2, p. 134). This is to be preferred to the Rothamsted data, which refer to the same wheat variety and the same soil, from year to year, and therefore only show the effect of the weather from each year. The following information shows the real changes in the farming techniques in the country.
Acreage
Year
Acreage under Wheat
1816-1817 to 1851-1852
Division of data of production by gross yield per acre
1852-1853 to 1867-1868
Lawes and Gilbert, On the Home Produce …., 1868, Area under Crop
1868-1869 to 1879-1880
“The Corn Crops of 1880”, Journal of the Royal Statistical Society, Dec. 1880
The experts on the matter – Mr. Jacob, Mr. Porter, Mr. McCulloch, and Mr. Caird – all said that they had no idea how one could proceed to a true calculation of the acreage under wheat. Fairly close figures are only available from 1852-1853 onwards, calculating backwards from the physical count in the Agricultural Returns of 1866.
One would expect that the acreage in each of the earlier years could be calculated from the division of the harvest production by the gross yield per acre. Unfortunately, the numbers of acres are not consistent through time; the numbers move between 3,500,000 and 4,800,000. We do know that the amount cultivated each year changed by ten per cent or more, depending on the plans of the farmers, but the differences shown are of a different magnitude.
We do know that there was an impressive increase in the wheat acreage from 1794 to 1815, due to the Enclosures.
“The number of enclosures therefore, during the war [1794 to 1815] exceeded in round figures 1760. Now if we take the average number of enclosures at an extent of between 750 and 1,000 acres, each enclosure, the total number of enclosed acres will exceed a million and a half, of which it is certainly not too an estimate to assert, that at least 1,000,000 acres, of the newly enclosed land were employed in the growth of corn. But if we take the average produce per area so low as two quarters, here will be 2,000,000 quarters of corn added to the annual growth of the country.” (p. 36)
Anon. Inquiry into the Capacity of Government to administer Relief to Agricultural Distress. Printed, J. Hatchard and Son, London, 1822
Imports
Our documentary sources are:
Period
Import Volume from Ireland
1815-1849
Porter, Progress of the Nation, 1851, p. 345
1850-1863
Thom, Statistics of Ireland, 1864
Period
Import Volume from Rest of World
1816-1827
Porter, Progress of the Nation, 1851, pp. 138-139 (calendar years)
1828-1847
Tooke, Vol. IV, p. 416 (harvest years)
1848-1852
Tooke, Vol. VI, Appendix 4, pp. 451-453
1853-1866
Lawes and Gilbert, Home Produce, 1868
1867-1880
Agricultural Statistics, The Corn Crop, Journal of the Statistical Society of London, Dec. 1880; subtracting estimates of imports by Scotland and Ireland
The numbers came originally from the monthly reports of the Customs-Houses. Yearly reports from the British Government show the data per calendar year. Some reports and comments by agricultural experts or corn traders use a total for the harvest year (September to August).
Calculated Consumption per Capita per Day
The consumption of wheat grain per capita per day, is obtained by dividing the consumption of the year by the population (Census of England and Wales, with interpolations), and by 360.
The consumption of wheaten bread per average person, is obtained by reducing the consumption of grain by 20 % (representing the husk), and increasing the weight by (4.3 / 3.5), this being the statutory ratio of the weight in pounds of the quartern loaf to the weight of the grain employed.
Results
Production, Imports, Consumption of Wheat, 1770-1880, England and Wales
The amount harvested in England and Wales (net of seed reserve) from 1816 to 1880, was in practically all the years in the range of 10,000,000 to 15,000,000 quarters, and showed no tendency to increase or decrease.
The data show the low harvest (9,000,000) in 1816, which was the “Year without a Summer”; the extremely high harvests in 1820–1821, which caused the low price in 1822; the low amounts in 1829 to 1830, due to the heavy rains; the high amounts in 1834-1836, which were so high that the excess was fed to cattle and pigs; and the low amounts in 1839, which were a partial cause of the Depression in 1839-1842.
Domestic production / requirement
The following Graph shows the harvest production net of seed, compared with the population of England and Wales. The numbers on the left side refer to the harvest amounts in quarters, and to the population of England and Wales, for the different lines.
If we suppose that the people ate on average 1.0 quarters (8 bushels) of wheat per year, then the comparison between the “Domestic” line and the “Population E + W” line gives an idea as to how much of the food requirements would have been covered by domestic production. If we suppose that the people ate on average 6 bushels of wheat per year, then the comparison between the “Domestic” line and the “Population x (6 / 8)” line shows if the requirements would have been covered by domestic production.
It is probable that the real consumption was around 6.6 bushels per year during the period (1.1 pounds of bread per day).
We see that the domestic harvest production was generally enough for the national food consumption up to 1838, with the exception of 1829 and 1830. The production was absolutely not enough in the period starting in 1838, and thus it was necessary to import grain from Europe, and later, from North America.
Geographic origin of supplies
The following Graph shows the division by geographical origin of the estimated yearly consumption. We show a) the available sales amount, equal to the domestic harvest production less the seed reserve, b) the imports from Ireland, taken from official Customs reports, c) the imports from Europe and North America, taken from official Customs reports.
Up to 1838, there are very few imports from outside the British Isles (only in 1828 to 1830, due to the harvest losses from the heavy rains). From 1838, the domestic harvest plus Ireland remains fairly constant around 10,000,000 to 12,000,000 million quarters. Large-scale exports from the United States began in 1869.
Imports from Ireland and from the Rest of the World, were from 1816 to 1838 a small proportion of the total consumption. From 1838 the total imports were 25 % to 40 % of the consumption.
Up to 1864, 70 % per cent of the imports came from Russia, Germany, and the United States; from 1869, 70 % of the imports came from Russia and the United States.
Yield per Acre
The yearly “Liverpool Survey” figures for 1815 to 1855 are shown in Graph 5.
We see that the yield per acre was around 26 to 35 bushels (of 60 lb.) per acre in the period 1815 to 1839, and from 40 to 50 bushels per acre from 1840 to 1855. The authors of the reports were of the opinion that the above figures were somewhat too high, as these supposed that the whole of each field produced a full quantity of wheat, and the reality was that some parts of fields could not be properly sown; the correction proposed was to reduce the calculated yield by one sixth. Further, if we want to convert the figure of seed produced to the amount consumed by humans, we have to retain one ninth part for the seed reserve for the next sowing. This means that the effective yield, net of seed reserve, was about 20 to 26 bushels in 1815-1839, and 30 to 36 bushels in 1840-1855.
For 1815 to 1840, the numbers are fairly constant, and in some years, do reflect the good or bad harvests.
The figures from 1841 onwards would seem to be too high. But Mr. Tooke informs us that he did believe them, because he actually had a conversation with Mr. Sandars on the subject, and Mr. Sandars showed him the original of the book, where the data collected by his employees were noted. We do actually have today, the original of this book. This was discovered by Mr. Healy and Mr. Jones in 1962 in the archives of the Royal Statistical Society. The revision of these papers by Mr. Healy and Mr. Jones leaves no doubt that the work was carried out in a conscientious, exact, and consistent manner.
Wheat Yield bushels / acre («Liverpool Surveys»)
(The figures for 1841 are doubtful, see above)
(Multiply «yields» by 0.70, see above)
Mr. James Caird, having visited the majority of the counties of England in 1850-51, for a series of reports to “The Times”, calculated the average yield at 27 bushels per acre (Caird, 1852, p. 480). In 1866, the first complete Agricultural Statistics for the whole country were collected. On this basis, Mr. Caird calculated that the yield per acre at that time was close to 28 bushels (Caird, 1868, p. 130). This would be an increase of about 25 % against the 22 bushels in 1800-14.
Amount of wheaten bread per person per day
The daily consumption for each year is given in the Graph following.
“Smoothing” refers to an adjustment which theoretically has to be made, to change the y-coordinates from “harvest production in the given harvest-year”, to “effectively eaten in the given harvest-year”. We do not have these figures. The effect would be to reduce the “peaks” and the “valleys” shown.
There are four principal observations about these data:
The data refer to consumption of wheat, that is, the division of the available amount of wheat in the country, plus the imports, by the number of the total population;
We do not know how much the total population ate additionally of oats, barley, and rye; this may have been ten per cent in 1815, and five per cent in 1850;
The average consumption is given by Caird at 1 ¼ pounds of bread daily (all cereals) for each family member; we may suppose that the persons in a good financial situation ate more of other sorts of food and less of bread; then the poorer persons would have eaten more than 1 ¼ pounds of bread;
The amount of per capita consumption of bread, is a theoretical calculation, supposing that everyone ate fine white bread; in fact, the agricultural labourers ate fine wheat bread, the industrial workers and the middle class ate “household bread”, and the soldiers and the convicts ate “brown bread”; the two last descriptions retained a certain proportion of bran, so that the bread “filled the stomach”, although the calorific content was not much greater.
The resulting consumption numbers are fairly constant during the period 1816 to 1880, at 1.0 to 1.2 pounds of bread daily per average family member, or 1.3 to 1.6 pounds per average adult male. This concurs with descriptions from the period, which mention typical consumption of little more than one pound per day.
In the majority of years from 1794 to 1821, due to weather problems, the harvest was not sufficient in quantity or in quality. This caused hunger, but not deaths from starvation (there were some thousands of additional deaths in 1794-5 and in 1799-1800, from pneumonia and fevers, acting on people weakened by the hunger).
Year
Harvest Quantity
Harvest Quality
1790
Peace and favourable Seasons
1791
“ “ “ “
1792
“ “ “ “
1793
War but favourable Seasons
1794
Deficiency of crop
1795
“ “ “
1796
Season less unfavourable
1797
“ “ “
1798
“ “ “
1799
Bad season
1800
» «
1801
Good crop followed by Peace
1802
Favourable crop
1803
“ “
1804
Deficient crop
1805
Average Crops
1806
“ “
1807
“ “
1808
Partial deficiency
1809
Great deficiency
1810
Good crop
1811
Deficiency
1812
Favourable Crop
1813
“ “
1814
Nearly average crop
1815
Full average Crop
Quality good
1816
Great and General Deficiency
Very bad quality; nearly rotten
1817
Not exceeding average Crop
Quality not very good
1818
“ “ “ “
Quality very good
1819
Somewhat below Average Crop
Quality good; but not so good as 1818
1820
Exceedingly average Crop
Sound and dry
1821
Average Crop
Very inferior; much injured by wet
1822
“ “
Very good; harvest remarkably early
1823
Scarcity
Inferior; wet harvest after a cold spring
1824
Average
Quality indifferent
1825
Nearly an Average
Very good; fine dry summer
1826
Average Crop
Quality of the wheat excellent
1827
“ “
Quality various, but mostly inferior
1828
Scarcity
Bad; damaged by wet weather
1829
Average
Bad; fully as much so as 1828
1830
Full Average
Quality various; some injured by wet
1831
Nearly an Average Crop
Very similar to that of 1830
1832
Above an Average Crop
Quality good
1833
“ “ “ “
Quality very fine
1834
“ “ “ “
Quality good; but hardly equal to 1833
1835
Considerably above an Average
Middling; injured by heavy rains
1836
Above an Average
Quality good in England and Wales
1837
Under an Average Crop
Middling
1838
Bad
1839
Bad
1840
Middling
1841
Very inferior
1842
Very good
1843
Various
1844
Moderately good
1845
Indifferent
1846
Indifferent
1847
The quality fair
1848
Bad; worse in the south than in the north
1849
Good
1850
Indifferent
1851
Good
1852
Injured by wet in the south
1853
Very bad
1854
Good throughout
1855
Indifferent
(“Harvest Quantity”: Journal of the Royal Statistical Society, Vol. 1, 1839, p. 56-57)
(“Harvest Quality”: Tooke, A History of Prices … 1848-1856, p. 131)
General Idea of Consumption per Capita
The figure of 1.0 quarters per year per person (9.3 lbs. a week, or a little more than 2 quartern loaves), or a little less, was taken to be a reasonable amount to be eaten by an average person, at the end of the eighteenth century. It was the amount of bread to be given to a pauper without family, but often without any other food; also the menservants in houses were given 2 quartern loaves per week, plus some meat and vegetables.
“In our present established modes of living, bread is an indispensable article, of which every one expects his fill, which cannot in general be restrained, or limited in quantity, without causing clamour and complaint; and this generally made of good wheat, without any mixture; the quantity made from oats, barley, and other grain or pulse, being but a small proportion of the whole. Respecting the quantity necessary to each individual, various estimates have been formed; eight bushels per annum has been reckoned, but this is certainly too much, and more than necessary. The late Dr. Withering reckoned that a labouring man, who lived chiefly on bread, would consume a pound weight a day; this allowance for a year, I believe, he made from six bushels of good wheat; but women and children require, in general, less. In a Report from the Birmingham Union Mill, a quartern loaf and a half per week, to each individual of a family, is stated as a good allowance; and this agrees with my own observations upon the consumption by grown persons; but I think that children and old persons require less, where they have plenty of potatoes, as well as others who have plenty of animal food and beverage; and am of the opinion that to one half of mankind, the full grown, healthy and active, one pound of bread each day may be required; and that to the other half, women, children, and those who have plenty of other food, ¾ lb. per day is sufficient, making the average 14 oz. per day, or 320 lb. per annum.»
(Pitt, 1806, p. 284)
“What do you conceive to be the average consumption of wheat in the British islands?” “I have looked at the subject; formerly, five or six years ago, I calculated it was about six bushels per head for the population.” (Select Committee on the State of Agriculture, 1837, p. 13; question to Mr. W. Jacob, Comptroller of Corn Returns in the Board of Trade).The figure is only for wheat, not the total of cereals, and averaged over all the United Kingdom; thus the figure for England and Wales, and for all cereals, would be somewhat higher.
The question as to whether this amount of wheat produced was sufficient for the appetites of the population, is resolved by Mr. Tooke for the years 1833-1835, in which he says there was a surplus that was actually not eaten by the people:
“The hypothesis, that an unusual abundance of wheat causes an immediate expansion of its consumption as bread, would have entitled us to expect that the surplus wheat produce of the years 1833 to 1835, or the greater part of it, would have been applied in that way. But the facts of the case did not bear out such an anticipation; for so little impression did the extra consumption, as food for man, make upon the extra supply, that wheat in 1834 and 1835 was used to a considerable extent for the purpose of feeding cattle, and sheep, and pigs, and for brewing and distilling. It is true that in consequence of the dryness of the summers of 1833 and 1834 the crops of spring corn were short, and fetched higher prices than usual, relatively to wheat. But still the fact remains, that Wheat, cheap as it was, cheaper than it had been for fifty years before, with a greatly increased population to feed, proved to be, even at extremely reduced prices, so unequivocally in excess of thedemand for it as human foodas to render necessary the adoption of unusual and inferior methods of absorption; …”
(Tooke, op. cit.; p. 74)
Corroborated by:
“Are you aware that any quantity of wheat has been consumed in feeding cattle?” “Immense quantities of all descriptions of corn.”
(Select Committee on Agriculture, 1837, Mr. George Trumper, Land agent, Middlesex, p. 170; examined on 8th March 1836)
“Have you the means of knowing if the increase in wheat has not been occasioned in those counties by its being grown on that land on which they used to cultivate oats?” “I think not; the crops of wheat for 1832 and 1833 I compute as having been crops yielding a supply sufficient for the consumption of the country.”
“From England and Ireland?” “Yes; 1834 the crop greatly exceeded the consumption.”
“What do you say of 1835?” “It was an average, and not producing what I should think would be equal to the consumption of the year.”
(Ibid, p. 102; Mr. David Hodgson, Corn merchant, Liverpool)
It is not exactly true that the consumption of cereals per capita remained constant. The proportion of (eaters of wheat + barley + oats + rye) to only eaters of wheat changed from 1.50 in 1800 to 1.15 in 1850. On the other hand, the population was eating more meat, dairy products, vegetables and fruit in 1850.
Mr. James Caird, having visited the majority of the counties of England in 1850-51, for a series of reports to “The Times”, calculated the average yield at 27 bushels per acre (Caird, 1852, p. 480). In 1866, the first complete Agricultural Statistics for the whole country were collected. On this basis, Mr. Caird calculated that the yield per acre at that time was close to 28 bushels (Caird, 1868, p. 130).
Mr. Caird also made a comparison of the minimum healthy diet per person of bread, potatoes, and meat, with the real data calculated from the Agricultural Statistics of 1866. The required consumption was, according to his sources, one pound of bread per day, one pound of potatoes, and six ounces of meat. The real consumption was one pound of bread, one pound of potatoes, and only two ounces of meat, over the average of the United Kingdom. The real consumption in England, Scotland and Wales was 1 ¼ lb. of bread and ½ lb. of potatoes; the real consumption in Ireland was ¼ lb. of bread and 4 ½ lb. of potatoes (unfortunately, no figures per country for meat) (Caird, 1868, p. 142).
He also commented on the logical necessity that the consumption of bread per capita should remain constant through the years. “[the opinion of Mr. Newmarch, with which I concur] … is that the consumption of bread is very constant, that everything is given up before bread, and that bread being the staff of life it must be had by the people whatever the price may be. This view is confirmed by inquiries which I have since made among some of the leading bakers in the most densely peopled quarters in Whitechapel in the east, and the Harrow Road in the north-west, one of whom has been thirty years in the business, and now has three shops in a district entirely inhabited by the working classes. Their testimony is that the consumption of bread is now very large, for, although dear, it is still the cheapest article of food within reach of the poor, the next substitute, potatoes, being scarce and very dear.” (Caird, 1868, p. 134).
Consumption of Wheaten Bread, 1770-1880, by Occupation and by Region
As a “cross-check” to the numbers produced from the harvest estimates, we use numbers of consumption per head per head, from contemporary observations.
“To corroborate the estimate of eight bushels of wheat, I may observe that the magistrates in Suffolk with whom I have the honour of acting, upon the scarcity in 1795 and 6, made numerous and most careful inquiries in forty-two parishes of our division, in order to ascertain the general consumption; and we found it half a stone of flour per head per week, or a pound a day, or 49 lb. in seven weeks; call this a bushel a week, and it is 7 1-half bushels a year; but as an average bushel of wheat does not produce 49 lb. of flour, it is sufficiently near 8 bushels of wheat per annum.” [One pound of flour a day, is 1.3 pounds of bread per day]
(Arthur Young, The Question of Scarcity plainly stated, and Remedies considered, 1800, p. 43)
Mrs. Rundlell in the 1820´s wrote a series of well-received books on the management and costs of a house and family.
“It has been ascertained, in times of scarcity, that every adult person, having a due portion of other food, consumes more on average than a quartern loaf [4.3 lbs.] of Bread in a week. We state the consumption at upwards of one-fifth more, including flour for pastry and the other purposes of a family. …… At all times, 6 lbs. of Bread per week, per head, may be considered as the average consumption in a family.”
Rundell, María Eliza (attributed), A New System of Practical Domestic Economy: Founded on Modern Discoveries, and the Private Communications of Persons of Experience, A New Edition, revised and enlarged, with Estimates of Household Expenses, adapted to Families of Every Description, 1827, p. 450
Mrs. Rundell gives us a number of weekly budgets for home expenses for workers with good incomes, or lower middle-class (21 to 24 shillings income per week), in which she estimates bread at 24 lbs. per week for two adults and three children, and meat at 6 lbs. per week.
Mr. Charles Mott, who was the Assistant Poor Law Commissioners for Middlesex and Surrey in 1836, and reported on the conditions in the workhouses, decided that it would be useful to know the real consumption of bread and meat by the agricultural workers, in order to compare this with the food amounts in the workhouses; he had a survey carried out, of which unfortunately we do not have the details. It was generally supposed – and the survey confirmed this – that the daily amounts in the workhouses were larger than those eaten by the agricultural laborers.
“The agricultural labourers are unable to procure for themselves and families more than an average allowance per head of 122 ounces of food (principally bread) per week [1.0 pounds per day], of which we will suppose that the man consumes, as his proportion, 140 ounces per week, say 134 ounces of bread and six ounces of meat. Bread contains in round numbers 800 parts in 1,000, or four-fifths of nutritive matter, whilst the meat will yield but 333 parts in 1,000, or about one-third; they will give together 109 ounces per week, about 15 ½ ounces of nutritive matter per day as the consumption of an able-bodied labourer. These results were obtained from returns from labourers in the southern agricultural counties, and as they were selected with care, they may be fairly relied upon; they may, nevertheless, be objected to as insufficient data upon which to ground any general conclusion, inasmuch they may be said to be confined to one class, whose income does not average for the family more than 2s. per head per week, and to show what labourers can obtain, and do not prove that labourers would not consume more if they could get it.”
An extension of the survey to industrial workers with decent incomes in towns, showed that although these people did eat more meat (no figures given) than the agricultural labourers, they then ate less bread, so that the medical calculation of the total of nutritive matter was about the same.
(Second Annual Report of the Poor Law Commissioners for England and Wales, 1836, Report by Mr. Mott, p. 336)
“As a general expression it may be stated that the food obtained by the labouring classes in my district [Yorkshire, Notts, Cambridgeshire, Lincolnshire], consists of from 1 ¾ to 2 lbs. of bread-stuffs daily; ½ lb. of sugar or treacle weekly; ¼ to ½ lb. of butter or other fats weekly; 1 lb. to 1 ¾ lb. of meats weekly; ½ pint to 4 pints of milk weekly; 1 oz. of cheese weekly; and ½ oz. of tea weekly.”
(Smith, Dr. Edward, Dietaries for the Inmates of Workhouses, 1866, The ordinary Food of the Labouring Classes, pp. 55-57)
(These were workers in the rural areas of the stated counties. But the agricultural workers in the South and South-West were paid much less, and ate less.)
The amount of 1.1 pounds of bread per capita per day for the average person, concurs with the 1.1 pounds eaten by the workers in Lancashire in 1861, just before the Cotton Famine. Although the Lancashire workers had a position above the middle of the working class, their situation must have been close to the average of the whole population, i. e. including professional persons and the upper class.
Oddy, D. J., Urban Famine in Nineteenth-Century Britain: The Effect of the Lancashire Cotton Famine on Working-Class and Health, The Economic History Review, New Series, Vol. 36, No. 1 (Feb., 1983), pp. 68-86, see Table 3, p. 78. https://www.jstor.org/stable/2598898
Dr. Lawes wrote an article in 1855 in which he says that he investigated the daily consumption of foods by different groups in one day; the data were extracted from 86 different dietaries. The average yearly consumption of bread was 6 1/2 to 6 3/4 bushels [1.06 to 1.11 pounds per average person per diem]. It would have been very interesting to have the real consumption of bread in each case; unfortunately, the original documents of the dietaries could not be found in the Rothamsted archives. The list of groups is given in Figure 11.
(“On the Sewage of London”, Dr. J. B. Lawes, Journal of the Society of Arts, No. 120, Vol. III, 1855; Table II, pp. 265-267)
Mr. Caird made a comparison of the minimum healthy diet per person of bread, potatoes, and meat, with the real data calculated from the Agricultural Statistics of 1866, plus registered imports. The required consumption was, according to his sources, one pound of bread per day, one pound of potatoes, and six ounces of meat. The real consumption was one pound of bread, one pound of potatoes, and only two ounces of meat, over the average of the United Kingdom. The real consumption, as he calculated it, in England, Scotland and Wales was 1 ¼ lb. of bread and ½ lb. of potatoes; the real consumption in Ireland was ¼ lb. of bread and 4 ½ lb. of potatoes (unfortunately, no figures per country for meat) (Caird, 1868, p. 142).
Discussion
The important points to be revised are:
Are the arithmetical results reliable?
Did the country produce enough wheat?
By how much did the yield increase?
Do the arithmetical results coincide with the information about consumption per person?
Was the amount per person enough?
Were there groups of people who ate less than the one pound of bread per day?
Are the arithmetical results reliable?
The harvest production figures, as given directly by Jacob, Lawes and Gilbert, and Lawes, are the best calculations that these people could make. The numbers in the “Tooke years” are estimated by this author, on the basis of Mr. Tooke’s information as to the increases or decreases in each year. No one at the time could have made better calculations.
The amounts imported are taken from official reports, which give the numbers of quarters of wheat in the custom-house returns.
An important difference against the previous academic investigations, comes from the parameters for loss through milling, reserve for seeds to be used in the following growing season, and general wastage. The figures used in this document are considerably lower than those of the previous investigations, and thus the volume of wheat available for human consumption is larger. The loss due to milling, at 20 per cent, is equal to the weight of the husk, and was demonstrated in experiments reported to a Parliamentary Committee. The reserve for seed, at 2 ¼ bushels per acre, is taken from contemporary estimates by experts. The wastage is taken to be zero, as it is difficult to see, given the modes of storage and transport, where losses might have been caused; illustrative calculations of the available amounts available for eating, starting from a given production amount, do not mention these differences.
The yearly population numbers are based on the Censuses for England and Wales.
Did the country produce enough wheat?
It was generally understood, that – from 1815 to 1838 – the wheat eaten in England and Wales was a little more than the production of the country. The missing amount was about nine per cent, or about four per cent if the production of Ireland was included:
“Will you specify which of these four years you allude to?” “The last four, say 1828 to 1831, were 18 per cent. below the consumption of the country. By consumption of the country, I must be understood as not meaning an average crop, for an average crop is not equal to the consumption.”
“How much is regarded as the consumption of the country?” “An average crop may be about nine per cent. less than the consumption.”
…..
“At what do you estimate the annual consumption now?” “The scale on which I go is assuming it to be about twelve millions.”
(Select Committee on Agriculture, House of Commons, 2 August 1833, David Hodgson, corn merchant, QQ. 693-694, p. 36, Q. 707, p. 37)
“Taking this as one country, supposing an average crop of England and Ireland, would the average crop supply the consumption, or what is required in addition from abroad?” “It would require an importation from abroad of about 500,000 quarters.”
(continuation, David Hodgson, corn merchant, Q. 727, p. 38)
“What do you conceive to be the average consumption of wheat in the British islands?” “I have looked at the subject; formerly, five or six years ago, I calculated it was about six bushels per head for the population.”
(Select Committee on the State of Agriculture, 1837, p. 13; question to Mr. W. Jacob, Comptroller of Corn Returns in the Board of Trade).
Mr. George Porter, at the time Head of the Statistical Section of the Board of Trade, wrote in his “Progress of the Nation” in 1851, that the increase in the number of inhabitants from 1801 to 1841 had been more than paralleled by the increase in the quantity of agricultural produce. Further, that the amounts of wheat imported had been low, in comparison with the total wants of the population:
Porter, 1851, pp. 138-139 (amounts per calendar year, not per harvest year)
Until 1846, the imports were artificially restricted, and were not allowed, unless the domestic price was very high. From 1846, imports were unrestricted in volume, and did not pay any tariff.
By how much did the yield per acre increase?
There can be no doubt that the production of farms increased in efficiency from 1790 to 1860. There were continual improvements in the farms, which were communicated between the farmers; these improvements were, for example, new implements, new ploughs, new methods for preparing the food for the animals; often the improvements were only introduced after comparative experiments; Farmer’s Associations were set up in each county; these Associations gave out prizes for the largest animals, or the most productive milk cow, etc.; the Board of Agriculture required reports about each county.
There was a considerable increase in the use of mineral fertilizers, which improved the volume of the harvests. See: O’Connor, J., Origins, Development, and Impact of Britain’s 19th Century Fertiliser Industry, Fertiliser Manufacturers’ Association, Peterborough, 1993.
The farmers and landlords would not have undertaken these activities, if they could not see real improvements in production.
“The vast increase of agricultural produce has not only proceeded from any greater number of people being employed, but chiefly from the use of improved implements, better courses of cropping, the reclaiming of waste land, melioration of every species of soil, and improved farm stock. By such means farm produce has been doubled, and the condition of the soil, the occupiers of land, and every description of labourers, has been much improved during the present generation.”
(William Aiton, Remarks on Mr. Malthus’ Opinions on Agricultural Subjects, The Farmer’s Magazine, Vols. 25-26, 1824, p. 464)
But the estimated yields in different years are less than what one would expect from this catalogue of improvements. From 1800 to 1880, the average yield only increased from 22 bushels per acre to 28 bushels per acre (See the information in Figure 5), that is, 25 per cent. THIS IS AN OPEN QUESTION.
Do the arithmetical results coincide with the contemporary information as to consumptionper person?
The amount of bread consumed per average person per day, according to the calculations commented above, was during practically the whole of our period, between 1.0 and 1.2 pounds.
As a “cross-check” to the numbers produced from the harvest estimates, we use numbers of consumption per head per head, from some contemporary estimates and observations. These are shown above in the section: “Consumption of Wheaten Bread, 1770-1880, by Occupation and by Region”, and are here resumed.
According to Arthur Young, in a survey in Suffolk in the year 1800, the consumption was found to be a pound of flour per day [equal to 1.3 pounds of bread].
Mrs. Rundell, in her book of Domestic Economy, gives an amount of 1.2 quartern loaves per week for adult persons, “having a due portion of other food”, that is, they are in comfortable circumstances, which is 0.75 pounds per day. For a family, it would be 6 pounds per week, per head, i. e. 0.85 pounds per average family member per day. [The numbers would seem to be incongruent]
Mr. Mott, the Assistant Poor Law Commissioner for Middlesex and Surrey in 1834, estimated an average consumption for agricultural families in southern districts, of 122 ounces of food (of which, 95 % bread) per week, i. e. 1.0 pounds per person per day.
Dr. Edward Smith in a survey of adult members of the laboring classes in the rural areas of Yorkshire, Notts, Cambridgeshire, Lincolnshire, in 1866, reports a consumption of 1 ¾ to 2 lbs. of bread-stuffs daily. But the rural workers in the North ate better than those in the South.
The figure of 1.1 pounds of bread per capita per day coincides with the 1.1 pounds reported by Dr. Smith for Lancashire workers in 1861, just before the Cotton Famine.
Dr. Lawes, he of the experimental plots in Rothamsted, informs us of an investigation which he carried out, extracting data from 86 different dietaries. The average yearly consumption of bread was 6 1/2 to 6 3/4 bushels [1.06 to 1.11 pounds per average person per diem].
Mr. Caird made a calculation based on the real data (physical count) of the Agricultural Statistics of 1866, plus registered imports of wheat. This gave 1 ¼ pounds of bread per person in England, Scotland and Wales.
So we see that these data for large segments of the population, do confirm a consumption of a little more than 1.0 pounds per average person per day.
Was the amount per person enough?
It might be supposed that although the population was effectively eating 1.1 pounds per person per day, this was not enough for their energy requirements given their types of work. But contemporary commentaries do say that this was enough (in the period from 1790, one would have to add the amounts of potatoes eaten).
“In our present established modes of living, bread is an indispensable article, of which every one expects his fill, which cannot in general be restrained, or limited in quantity, without causing clamour and complaint; and this generally made of good wheat, without any mixture; the quantity made from oats, barley, and other grain or pulse, being but a small proportion of the whole. Respecting the quantity necessary to each individual, various estimates have been formed; eight bushels per annum has been reckoned, but this is certainly too much, and more than necessary. The late Dr. Withering reckoned that a labouring man, who lived chiefly on bread, would consume a pound weight a day; this allowance for a year, I believe, he made from six bushels of good wheat; but women and children require, in general, less. In a Report from the Birmingham Union Mill, a quartern loaf and a half per week, to each individual of a family, is stated as a good allowance; and this agrees with my own observations upon the consumption by grown persons; but I think that children and old persons require less, where they have plenty of potatoes, as well as others who have plenty of animal food and beverage; and am of the opinion that to one half of mankind, the full grown, healthy and active, one pound of bread each day may be required; and that to the other half, women, children, and those who have plenty of other food, ¾ lb. per day is sufficient, making the average 14 oz. per day, or 320 lb. per annum.”
(Pitt, 1806, p. 284)
The question as to whether this amount of wheat produced/imported was sufficient for the appetites of the population, is resolved by Mr. Tooke for the years 1833-1835, in which he says there was a surplus that actually could not completely be eaten by the people:
“The hypothesis, that an unusual abundance of wheat causes an immediate expansion of its consumption as bread, would have entitled us to expect that the surplus wheat produce of the years 1833 to 1835, or the greater part of it, would have been applied in that way. But the facts of the case did not bear out such an anticipation; for so little impression did the extra consumption, as food for man, make upon the extra supply, that wheat in 1834 and 1835 was used to a considerable extent for the purpose of feeding cattle, and sheep, and pigs, and for brewing and distilling. It is true that in consequence of the dryness of the summers of 1833 and 1834 the crops of spring corn were short, and fetched higher prices than usual, relatively to wheat. But still the fact remains, that Wheat, cheap as it was, cheaper than it had been for fifty years before, with a greatly increased population to feed, proved to be, even at extremely reduced prices, so unequivocally in excess of the demand for it as human food as to render necessary the adoption of unusual and inferior methods of absorption; … “
(Underline by this author)
(Tooke, op. cit.; p. 74)
Corroborated by:
“Are you aware that any quantity of wheat has been consumed in feeding cattle?” “Immense quantities of all descriptions of corn.”
(Select Committee on Agriculture, 1837, Mr. George Trumper, Land agent, Middlesex, p. 170; examined on 8th March 1836)
“Have you the means of knowing if the increase in wheat has not been occasioned in those counties by its being grown on that land on which they used to cultivate oats?”
“I think not; the crops of wheat for 1832 and 1833 I compute as having been crops yielding a supply sufficient for the consumption of the country.”
“From England and Ireland?” “Yes; 1834 the crop greatly exceeded the consumption.”
“What do you say of 1835?” “It was an ave
“What do you say of 1835?” “It was an average, and not producing what I should think would be equal to the consumption of the year.”
(Ibid, p. 102; Mr. David Hodgson, Corn merchant, Liverpool)
Mr. Caird commented on the logical necessity that the consumption of bread per capita should remain constant through the years. “[the opinion of Mr. Newmarch, with which I concur] … is that the consumption of bread is very constant, that everything is given up before bread, and that bread being the staff of life it must be had by the people whatever the price may be. This view is confirmed by inquiries which I have since made among some of the leading bakers in the most densely peopled quarters in Whitechapel in the east, and the Harrow Road in the north-west, one of whom has been thirty years in the business, and now has three shops in a district entirely inhabited by the working classes. Their testimony is that the consumption of bread is now very large, for, although dear, it is still the cheapest article of food within reach of the poor, the next substitute, potatoes, being scarce and very dear.” (Caird, 1868, p. 134).
Graph 3 does not show exactly a calculation of the consumption of wheat bread, but actually a sum of the harvest production and the imports. In those years of high production, the excess wheat was not eaten by the population, but stored in barns and warehouses. It was carried over to the next year, and would be used if there was a shortfall. Equally the insufficient harvests that we see in the graph, were in general compensated with the amounts in the barns.
Therefore, although the graph shows from 1822 onwards, numbers in the range of 0.9 to 1.3, the reality of the amounts eaten would have been probably in the range of 1.0 to 1.2 pounds per dayThe fact that the amount eaten – according to the present calculations – moves little from year to year, in the range between 1.0 pounds and 1.2 pounds, demonstrates that these amounts were those which the population actually required. In years of less harvest production or of more poverty, they did not eat much less; in years of excessive production or of better income levels, they did not eat more.
Were there groups of people who ate less than the one pound of bread per day?
Obviously the fact that we have calculated an average of one pound of bread per person per day, does not necessarily mean that everyone in the country was eating enough bread. (But on the other hand, many of the persons who were eating one pound of bread, were not eating enough food in total).
The really poor, in general, did not always eat enough bread. Here we have the persons who slept in doss-houses, the unemployed for long periods, the Irish in Lancashire in the years after the Famine, the needlewomen who lived alone (who were generally supposed to have to prostitute themselves), those with very large families.
The agricultural workers, in the South and South-west of England and in the Eastern counties, in the period of 1840 to 1870, did eat their one pound of bread, but not much else. And this was often barley bread, and/or was covered with lard or dripping to make it palatable. In the winter, the food situation was worse. (see A. Wilson Fox, “Agricultural Wages …”, 1903, pp. 291-292 and page 343).
We might think that, for example, the upper classes ate 1.7 pounds per day, and the working classes ate 0.8 pounds per day, thus respecting the average consumption of 1.1 pounds per day. But it is difficult to imagine the average family member of the upper classes eating this amount. Further, if they wanted to eat more in total, they would eat more meat.
Conclusions
This investigation shows that the population of England and Wales on average ate sufficient bread in each year from 1816 to 1880. Until 1838, the average of the home production amounts was slightly less than the required amount, but the difference was made up by imports of wheat from Ireland and from Europe. From 1838 onwards, the domestic production could not cover the requirements of the population, and medium volumes were imported from Europe. From 1850, large amounts were imported from the United States and other countries outside Europe. The average per day consumption per person, calculated from amounts of domestic production plus imports, was about 1.1 pounds of wheaten bread. This corresponds to reports of consumption in some segments of the population. This was taken to be the amount corresponding to the biological requirements of the people. The fact that the consumption of bread was close to constant during the whole period, shows that it was not affected by price or availability, nor by the proportion of agricultural and industrial families, and thus that the 1.1 pounds per day was the amount that was naturally eaten by the people. Since the amount of bread eaten over the years does not change, this report does not tell us anything about changes in living standards. For this, we need as a next phase, yearly information about the amounts eaten of the inferior cereals, potatoes, meat, dairy products, etc.
Potatoes
These were very important for the poorer part of the agricultural population, especially in the years of poor harvests and high wheat prices from 1795 to 1815. If they had not had the possibility to buy or to cultivate potatoes, they would have faced a situation of starvation. Probably these people consumed half of their requirement of eating volume with the cheaper type of wheat, or with rye/barley/oats, and the other half with potatoes. From 1820 onwards, a number of agricultural families cultivated potatoes in “allotments”, on plots of half an acre, given to them, or rented to them, by the farmer. But some of the potatoes were sold for cash, or fed to the pig. Starting at a date of possibly 1830, potatoes were a common food for the urban working class in their houses.
There were also many farmers who produced potatoes, but the larger part would have been for their animals.
There are no useful statistics for the production of potatoes for human consumption, neither from allotments, nor from farms. The following figures from Harris, 2015, p. 25, seem reasonable, especially as they are close to the information of Caird from the Agricultural Statistics of 1866, that the consumption in Britain in that year was half a pound per person per day.
Having seen the movements of nominal incomes and of inflation-adjusted incomes, at least in the industrial employments, we can pass to other methods of measurement of living standards. The numbers referring to wages are somewhat suspect since we cannot know if we are adjusting correctly for the cost of living. What we can do, is to investigate the physical consumption of food per person.In advanced economies, we have to evaluate the Gross National Product – that is, the total value of goods and services produced – because there are many different types of expenses of the people, and using the ratio of incomes to food costs would not tell us much. But when we look at the period of the Industrial Revolution, the majority of the people did not have many expenses except food, rent, fuel, and clothing, and a certain percentage did not sufficient food. Thus we should collect data as to the food consumption of the people, and see the development of these figures during this period.
There can be no doubt that the production of the farms increased in efficiency from 1790 to 1860. There were continual improvements in the farms, which were communicated between the farmers; these improvements were, for example, new implements, new ploughs, new methods for preparing the food for the animals; often the improvements were only introduced after comparative experiments; Farmer’s Associations were set up in each county; these Associations gave out prizes for the largest animals, or the most productive milk cow, etc., the Board of Agriculture required reports for each county. The farmers and landlords would not have undertaken these activities, if they could not see real improvements in production.
«The vast increase of agricultural produce has not only proceeded from any great number of people being employed, but chiefly from the use of improved implements, better courses of cropping, the reclaiming of waste land, melioration of every species of soil, and improved farm stock. By such means farm produce has been doubled, and the condition of the soil, the occupiers of land, and every description of labourers, has been improved during the present generation.
(William Aiton, Remarks on Mr. Malthus’ Opinions on Agricultural Subjects, The Farmer’s Magazine, Vols. 25-26, 1824, p. 464)
Friedrich Engels and “The Condition of the Working Classes in England in 1844”
November 2025
[Page references of English texts are to the first English language edition, 1887, translation by Florence Kelley Wischnewetzky, authorized by Friedrich Engels, https://archive.org/details/conditionofworki00enge_0]
[Page references of German texts are to «Die Lage der arbeitenden Klasse in England», (Zweite Auflage), 1848, Google = «Hathitrust Die Lage der arbeitenden Klasse in England 1848»]
Contents
Engels gave Marx diametrically opposed information
Lack of information from Working Class persons
The data which Engels takes over from Dr. Kay’s booklet, referred only to the Township, which had a large proportion of Irish;
Consumption and Quality of Meat;
Wages compared with Food Costs;
Number of Rooms per House;
Different Levels of Housing in Manchester;
Poor Areas of the City;
Health and Hospitals;
Geography of Manchester;
Bolton;
The Potteries;
Unfounded Accusations against progressive Mill-owners;
Financial and Housing Properties;
Reported Indifference to Religion;
Physical Aspect of the Workmen;
Group of Manchester Workmen 1848 (photograph);
Reading and Writing;
Positive Effects of the Industrial Revolution, according to Engels;
Error in the «Sob Story»;
Engels’ Intention and Tactic;
Contemporary Criticism of the Book by German Academics.
INTRODUCTION
It is / was difficult to formulate a simple description of Manchester in 1844, with reference to its working-class persons. There were large differences between the better-situated workers and the really poor.
As we shall see in the contemporary evidence adduced in this document, a large part of the factory population in the 1840’s had a decent life, with earnings of 20 to 30 shillings per family, enough bread and meat, reasonable housing, and without bad treatment in their workplace. A large minority of the working-class were treated very badly, either by their employers or by the economic and social system; these people had insufficient incomes to eat enough, could not be sure that they would have income in the next week, lived in cellars or in small badly-built houses, with inexistent sanitary arrangements, sometimes with 10 persons per house. In addition to the bad sanitary conditions, the rooms of the houses of the poor were often in horrible conditions, because the inhabitants had very uncivilized habits.
Friedrich Engels gives us – as it were – a “skewed” picture:
“Such are the various working-people’s quarters of Manchester as I had occasion to observe them personally during twenty months. If we briefly formulate the result of our wanderings, we must admit that 350,000 working-people of Manchester and its environs live, almost all of them, in wretched, damp, filthy cottages, that the streets which surround them are usually in the most miserable and filthy condition, laid out without the slightest reference to ventilation, with reference solely to the profit secured by the contractor. In a word, we must confess that in the working-men’s dwellings of Manchester, no cleanliness, no convenience, and consequently no comfortable family life is possible; that in such dwellings only a physically degenerate race, robbed of all humanity, degraded, reduced morally and physically to bestiality, could feel comfortable and at home.” (Chapter II, The Great Towns, p. 43)
The explanation for the difference is:
a) the majority of people had an average or good life; b) a large minority of the people had a bad or a very bad life; c) the individual cases presented by Engels, as to the horrible circumstances of the poor, are practically all probably true; d) Engels carefully selected the information for his book, to give a uniformly negative impression.
In his Preface (German Edition: Vorwort S. 10; this Preface does not appear in the first English Edition), Engels takes a tactical decision, as to the words to be used in referring to the persons of the working class:
“Similarly, I have continually used the expressions workingmen (Arbeiter) and proletarians, working-class, propertyless class and proletariat as equivalents.”
This enables him to:
suppose that all of these persons have roughly the same (low) weekly income, and food consumption;
suppose that all of these persons have no property;
suppose that all of these persons live in the same low level of housing;
suppose that the regions of the towns where each part of this group lives, are all similar.
This also has the effect on ourselves, the readers, that when we form a “mental image” of one of the groups, we easily make it extensible to the other groups.
But we will see that in Manchester at least, in Engels’ time, there is a geographical division between the poor, who live in the Township (old, central area), and the workers with good jobs, who live in the surrounding suburbs (which are not the “upper class” suburbs!).
There is also a division given by the wage levels. It would appear that Engels does not want to admit the existence of a group of better-paid and better-employed workers.
I. Engels gave Marx diametrically opposed information
First we show that Engels did know that the working class with employment ate well, ……… :
“From Lancashire, December 20. The condition of the working class in England is becoming daily more precarious. At the moment, true, it does not seem to be so bad; most people in the textile districts have work; for every 10 workers in Manchester there is perhaps only one unemployed, the proportion is probably the same in Bolton and Birmingham, and when the English worker is employed he is satisfied. And he can well be satisfied, at any rate the textile worker, if he compares his lot with the fate of his comrades in Germany and France. The worker there earns just enough to allow him to live on bread and potatoes; he is lucky if he can buy meat once a week. Here he eats beef every day and gets a more nourishing joint for his money than the richest man in Germany. He drinks tea twice a day and still has enough money left over to be able to drink a glass of porter at midday and brandy and water in the evening. This is how most of the Manchester workers live who work a twelve-hour day.” (Underline by this author) (Engels, Friederich (signed as “X”) The Condition of the Working Class in England Written December 20, 1842, Published in the “Rheinische Zeitung”, No. 359, December 25, 1842 Marx and Engels Collected Works, digital edition Lawrence & Wishart, 2010, Volume 2, p. 378; search, specifying «1842»)
[This is Engels’ first month in England, and he does not seem to be surprised!]
…… had good incomes, ….. :
“…. But the colonies are far from being large enough to consume all the products of England’s immense industry, while everywhere else English industry is being increasingly ousted by the German and French. The blame for this, of course, does not lie with English industry, but with the system of protective tariffs, which has made the prices of all prime necessities, and with them wages, disproportionately high. But these wages also make the prices of English products extremely high compared with those of continental industry. Thus, England cannot escape the necessity of restricting her industry.” (Underline by this author) (Engels, Friederich (signed as “X”), The Internal Crises, Written November 30, 1842. Published in the “Rheinische Zeitung”, No. 344, December 10, 1842, Marx and Engels Collected Works, digital edition Lawrence & Wishart, 2010, Volume 2, p. 373)
…… were well informed about politics, and used their free time well ….. :
“While the Church of England lived in luxury, the Socialists did an incredible amount to educate the working classes in England. At first one cannot get over one’s surprise on hearing in the Hall of Science the most ordinary workers speaking with a clear understanding on political, religious and social affairs; but when one comes across the remarkable popular pamphlets and hears the lecturers of the Socialists, for example Watts in Manchester, one ceases to be surprised. The workers now have good, cheap editions of translations of the French philosophical works of the last century, chiefly Rousseau’s Contrat social, the Système de la Nature and various works by Voltaire, and in addition the exposition of communist principles in penny and twopenny pamphlets and in the journals. The workers also have in their hands cheap editions of the writings of Thomas Paine and Shelley. Furthermore, there are also the Sunday lectures, which are very diligently attended; thus during my stay in Manchester I saw the Communist Hall [actually “Manchester Hall of Science”], which holds about 3,000 people, crowded every Sunday, and I heard there speeches which have a direct effect, which are made from the special viewpoint of the people, and in which witty remarks against the clergy occur. It happens frequently that Christianity is directly attacked and Christians are called “our enemies”. In their form, these meetings partly resemble church gatherings; in the gallery a choir accompanied by an orchestra sings social hymns; these consist of semi-religious or wholly religious melodies with communist words, during which the audience stands. Then, quite nonchalantly, without removing his hat, a lecturer comes on to the platform, on which there is a table and chairs; after raising his hat by way of greeting those present, he takes off his overcoat and then sits down and delivers his address, which usually gives much occasion for laughter, for in these speeches the English intellect expresses itself in superabundant humour. In one corner of the hall is a stall where books and pamphlets are sold and in another a booth with oranges and refreshments, where everyone can obtain what he needs or to which he can withdraw if the speech bores him. From time to time tea-parties are arranged on Sunday evenings at which people of both sexes, of all ages and classes, sit together and partake of the usual supper of tea and sandwiches; on working days dances and concerts are often held in the hall, where people have a very jolly time; the hall also has a café.” (Engels, Friederich, Letters from London, Schweizerischer Republikaner No. 46, June 9, 1843, Letter III, Marx and Engels Collected Works, digital edition Lawrence & Wishart, 2010, Volume 3, p. 387)
…… and, far from working very long hours in Engels’ times, in 1843 had the working week reduced from 6 days to 5 ½ days, by a voluntary decision of the manufacturers and shop owners in Manchester.
This occurred while Engels was working in Manchester, in the sales area of a cotton mill.
II. Lack of Information from Working Class Persons
Engels apparently spent a considerable proportion of his time, talking with working class and visiting them in their homes.
“To The Working Classes of Great-Britain,
Working Men!
to you I dedicate a work, in which I have tried to lay before my German Countrymen a faithful picture of your condition, of your sufferings and struggles, of your hopes and prospects. I have lived long enough amidst you to know something about your circumstances; I have devoted to their knowledge my most serious attention, I have studied the various official and non-official documents as far as I was able to get hold of them –I have not been satisfied with this, I wanted more than a mere abstract knowledge of my subject, I wanted to see you in your own homes, to observe you in your everyday life, to chat with you on your condition and grievances, to witness your struggles against the social and political power of your oppressors. I have done so: I forsook the company and the dinner-parties, the port-wine and champagne of the middle-classes, and devoted my leisure-hours almost exclusively to the intercourse with plain Working-Men; …” (Dedication in the original German version of 1845, p. 3, given there in English) (Not present in the English language version of 1887)
We do not have any information from workers, or about them, or about their housing conditions. There is not one quote from a working class person.
These would have been very useful as a form of Field Research. We could have statistical data as to the incomes of the persons, rate of illness, size and number of rooms, hours worked, quality of their food, or expressions as to whether they were happy or not.
But these data have not reached us.
III. The data which Engels takes over from Dr. Kay’s bookletreferred only to the Township, which had a large proportion of Irish
A large part of the pessimistic descriptions of the workers’ living conditions in Manchester is taken over from the short book “The Moral and Physical Condition of the Working Classes employed in the Cotton Manufacture in Manchester” (1832) by Dr. James Kay. The booklet also gives detailed quantitative data as to the sanitation problems in each Police District. This would seem to give evidential bases for Engels’ statement about the 350,000 people in Greater Manchester living in horrible conditions. But Dr. Kay’s book does not refer to the totality of the conurbation (354,000 persons in the 1841 Census), but only to the Township (163,000). Engels did say, that the 6,951 houses examined were «- naturally in Manchester proper alone, Salford and the other suburbs being excluded». But he did not make it clear, that the other suburbs had better standards of living than the Township.
(Taken from the Prologue of Dr. Kay’s booklet)
Obviously, Engels knew that Dr. Kay’s booklet referred only to the Township (it gives data only for the 14 Police Districts). He had no excuse, as he lived in Manchester for nearly two years.
But, further, the proportion of the population in the suburbs increased from 1832 to 1842:
“The great disparity of increase of the three districts under notice [Manchester, Salford, Chorlton] is to be attributed to the centre of Manchester becoming, from year to year, less occupied as family dwellings; for, though its multitude of compact buildings are like a bee-hive by day, yet they are household residences of a very few; the great body of occupiers living in the outskirts, or in the more airy parts of other unions. The comparatively diminished rate of increase in Manchester may, in some degree, be affected by the working classes themselves gradually forsaking their cellar and other confined buildings for the more clean and airy cottages, which have of late years been so numerously built out of the township, as in Chorlton and Hulme. The greater increase in the other two unions are to be accounted for on converse circumstances, – from the inhabitants forsaking the interior of the town, and living in the outskirts; either from views of health, economy, or being displaced from their town dwellings by the extension of warehouses and manufacturing establishments.”
(Benjamin Love, The Hand-Book of Manchester, 1842, pp. 24-25)
[Actually, the descriptions of Dr. Kay as to the filthy habits of the workers were exaggerated, as they referred principally to the Irish:
“Have you seen the work of Dr. Kay on the statistics of Manchester, as to the state of the operatives of that town?” “Yes, I know Dr. Kay, and I believe what he says is correct; but he gives the matter as it now stands, knowing nothing of former times; his picture is a very deplorable one. I am assured that my view of it is correct by many Manchester operatives whom I have seen; they inform me that his narration relates almost wholly to the state of the Irish, but that the condition of a vast number of the people was nearly as bad some years ago, as he describes the worst portion of them to be now. Any writer or inquirer will be misled unless he has the means of comparing the present with former times.”
(Mr. Francis Place, political and educational reformer, Evidence to the Select Committee on Education in England and Wales, 1835, p. 72)]
The municipal authorities in Manchester made a large number of improvements in the sanitary condition of the city between 1830 and 1840. They were congratulated in writing by the rapporteur of the “Local Reports on the Sanitary Condition of the Population”, who wrote that they had done more than any other local authority in England.
(Poor Law Commissioners, Local Reports on the Sanitary Condition of the Population, 1840, 17. Lancashire, Cheshire, Derbyshire and Staffordshire, Comment by Charles Mott, Assistant Poor Law Commissioner, p. 243)
IV. Improvements in Sanitary Conditions from 1830 to 1840
The municipal authorities in Manchester made a large number of improvements in the sanitary condition of the city between 1830 and 1840. They were congratulated in writing by the rapporteur of the “Local Reports on the Sanitary Condition of the Population”, who wrote that they had done more than any other local authority in England.6
6 Poor Law Commissioners, Local Reports on the Sanitary Condition of the Population, 1840, 17. Lancashire, Cheshire, Derbyshire and Staffordshire, Comment by Charles Mott, Assistant Poor Law Commissioner.
‘With these difficulties to encounter, too much praise cannot be given to the committee for the great improvements carried into execution by them. Since 1830, more then 32 miles of sewers have been constructed. The total number of streets sewered and paved, or “on the town’s books”, is 480; but there are still 450 unpaved and unsewered streets of sufficient size to come under the operation of the act .…………
10. The labours of the committee [“The Paving and Soughing (sewerage) Committee” of the town-council of Manchester] have not by any means been confined to the wealthy parts of the town, the poor districts having attracted a large, if not the largest share of their attention. And their labours have not been in vain; Dr. Howard and Mr. Leigh, who were intimately acquainted with these districts some years since, from the connection with the infirmary, kindly agreed to inspect the worst conditioned localities with a view to report on their present state. They both express their astonishment at the better appearance of the inhabitants, and of the physical condition of these districts since the time they were accustomed to visit them. A few years back they were unpaved and unsewered, “and in winter the streets in the district of Angel Meadow were trod up into a thick mud 12 to 14 inches deep, and were almost impassable; the cellars of the houses were flooded, and influenza, cholera or fever, prevailed in succession the year round”. The wards of the hospital were filled with cases from this district. Within the last few years, however, almost the whole of the streets have been put into thorough repair by paving and sewering; the footways have been well flagged, and the cellars have been well protected from the inundations to which they were formerly subject. But they show that there are still many evils connected with this district. “In one part a chandlery sends forth its disgusting effluvia, pigsties are dotted up and down, and heaps of filth are poured a precipitous clay bank to lie and rot.”
Dr. Howard and Mr. Leigh visited carefully all the worst districts of the town in which epidemics had formerly prevailed and cholera raged, and they state their general impression as follows: “These localities are those in which the greatest amount of disease was wont to prevail, and the condition of which is yet such as to attract attention. Still, compared with the appearance which they presented seven or eight years ago, their condition would scarcely be censured by those whose recollections of them extended so far back. Within that period they have nearly all been excellently paved and sewered.”
Mr. Bennett, a surgeon and registrar of deaths in the Ancoats district, in alluding to the health of his district not being impaired in late years with severe distress, states that the reason is “because the draining, paving, &c., is so much improved.”’7
7Commissioners for Inquiring into the State of Large Towns and Populous Districts (1845), Appendix Part II, pp. 4-5.
V. «Privies»
“A Health Commission was appointed at once to investigate these districts, and report upon their condition to the Town Council. … There were inspected, in all, 6,951 houses – naturally in Manchester proper alone, Salford and the other suburbs being excluded. Of these, …. 2,221 were without privies, … Chapter VI, The Great Towns, p. 69
These are by no means bad news. According to Dr. Kay’s Tables, 68 % of the houses in the Township had a private “privy”. In general, in industrial towns, 12 to 16 families had to share one “privy”.
VI. Road Sweeping Machines
«…. hitherto the principal streets in all the great cities, as well as the crossings, have been swept by people out of work, and employed by the Poor Law Guardians or the municipal authorities for the purpose. Now, however, a machine has been invented which rattles through the streets daily, and has spoiled this source of income for the unemployed.» Chapter III, Competition, p. 58
The reproach to be made to Engels, in this respect, is that he does not mention the resulting improvement in daily life, and in health, for the population, starting in 1843. The accumulated general filth in the streets of the working-class areas had reached considerable heights.
The booklet emitted by the company, quotes Edwin Chadwick, who himself quotes the medical officers in Manchester and Leeds, among others:
«That the filthy and disgraceful state of many of the streets in these densely populated and neglected parts of the town where the indigent poor reside, cannot fail to exercise a most baneful influence over their health, is an inference which experience has fully proved to be well founded; and no fact is better established than that a large proportion of the causes of fever which occur in Manchester, originate in these situations. Of the 182 patients admitted into the temporary fever hospital in Balloon-street, 135 at least come from unpaved or otherwise filthy streets, or from confined and dirty courts and alleys. Many of the streets in which cases of fever are common are so deep in mire, or so full of hollows and heaps of refuse that the vehicle used for conveying the patients to the House of Recovery often cannot be driven along them, and the patients are obliged to be carried to it from considerable distances. Whole streets in these quarters are unpaved and without drains or main-sewers, are worn into deep ruts and holes, in which water constantly stagnates, and are so covered with refuse and excrementitious matter as to be almost impassible from depth of mud, and intolerable from stench. In the narrow lanes, confined courts and alleys, leading from these, similar nuisances exist, if possible, to a still greater extent; and as ventilation is here more obstructed their effects are still more pernicious.»8
«The surface of these streets is considerably elevated by accumulated ashes and filth, untouched by any scavenger; they form nuclei of disease exhaled from a thousand sources. Here and there stagnant water, and channels so offensive they have been declared to be unbearable, lie under the doorways of the uncomplaining poor; and privies so laden with ashes and excrementitious matter, as to be unusable prevail, till the streets themselves from deposits of this description; in short, there is generally pervading these localities a want of the common conveniences of life.”’9
8Poor Law Commissioners, Local Reports on the Sanitary Condition of the Labouring Population (1842), Manchester, Dr. Baron Howard, p. 305.
9Poor Law Commissioners, Local Reports …, Leeds, Mr. Baker, pp. 352-353
“33. These remarks apply only to the state of Manchester when I first undertook its examination; but since then the whole system has been altered. Arrangements are now made by which the street-cleansing machine sweeps the streets twice as often as formerly, at a diminished cost of 500 l. Much attention paid to the efficiency of this machine enables me to state with confidence, that the streets of Manchester are kept much more cleanly [sic.] than under the old system of hand labour.”10
We see that as the streets are kept clean, the last column (“No. of streets containing heaps of refuse, stagnant ponds, ordure, &c.”) of Dr. Kay´s Table 1, were it calculated to the year 1844, should show a zero number. But Engels, reporting on the year 1844, does not rectify these fields. And obviously, he walked these streets every day.
10Commissioners for Inquiring into the State of Large Towns and Populous Districts (1845), Appendix Part II, p. 12.
REPORT ON THE PATENT ROAD AND STREET CLEANSING [SIC.] MACHINE
[It is suggested to read pages 1 to 15 of the report in Google]
“THE ROAD AND STREET CLEANSING CO., has been formed to carry into general operation throughout the United Kingdom, the Patent Sweeping Machine invented by Mr. Joseph Whitworth, of Manchester. More than twelve months have elapsed since the machine was first set to work in that town, and during the greater part of that time it has been used throughout an extensive district, under the immediate direction of the Company.
In March, 1842, a part of the Township of Manchester was assigned by the Commissioners of Police for trial of the machine, and a contract was entered into for working it therein during three months. The district included several principal thoroughfares, and contained upwards of 30,000 square yards of street surface. By the terms of the contract, the surface was to be cleaned three times oftener than under the old system, for three-fourths of the cost, or at one-fourth the former rate.
The district in question soon presented a striking contrast with the other parts of the Town, and before the contract expired, a memorial for its renewal and extension, signed by more than one hundred of the principal inhabitants, was presented to the Commissioners.
The contract was accordingly renewed for twelve months, and the district extended to include 90,000 square yards.”11
11Google = “Report on the Patent Road and Street Cleansing [sic.] Machine”
VII.Consumption and Quality of Meat
“As with clothing, so with food. The workers get what is too bad for the property holding classes. In the great towns of England everything may be had of the best, but it costs money; and the workman, who must keep house on a couple of pence, cannot afford much expense. Moreover, he usually receives his wages on a Saturday evening, for although a beginning has been made in the payment of wages on Friday, this excellent arrangement is by no means universal; and so he comes to market at five or even seven o´clock, whence the buyers of the middle class have had the best choice during the morning when the market teems with the best of everything. But, when the workers reach it, the best has vanished, and, if it was still there, they would probably not be able to buy it. The potatoes which the workers buy are usually poor, the vegetables wilted, the cheese old and of poor quality, the bacon rancid, the meat lean, tough, taken from old, often diseased cattle, or such as have died a natural death, and not fresh even then, often half decayed.” (Chapter I, The Great Towns, pp. 46-47)
Actually, there were a number of markets, which had a great variety of foods (including 5,000 to 10,000 head of cattle weekly):
“The markets are not such as a town of great wealth and magnitude might be expected to possess. …. The shambles in Deansgate used to be the principal resort of butchers. In November, 1827, a handsome covered market was erected in Brown-street; and in February, 1824, one was opened in London Road, for the accommodation of butchers and green-grocers. In 1828, a fish market was erected. It stands between the Market Place and Smithy Door, on the site formerly dedicated to the pillory, the stocks and the whipping post. The butter market used formerly to be held in an area near Smithy Door, the approach to which was by a dark passage. The old surrounding buildings are now pulled down, and the market is removed to Brown-street. Adjoining the shambles in Deansgate is a small market (of a more modern construction) for fruits, &c. The great cattle market is held in a large area in Shudehill, called Smithfield. It is greatly resorted to, the weekly sale of cattle averaging from 5,000 to 10,000 head (*). The cattle market is held on Wednesday, and on other days Smithfield is occupied by traders in a variety of commodities. The number of carts with farm produce which come from every side of the country early on the Saturday morning, is truly astonishing ….. The potato market was at the same time [1804] transferred to Shudehill, to the contiguous market of St. John’s, but is now held at Smithfield.”
(*) Error in the book, should be «500 to 1,000 head»
(James Wheeler, Manchester: Its Political, Social and Commercial History, Ancient and Modern, 1836; pp. 347-348)
But the individual persons did not buy their meat in the markets, as these were wholesale, but in small butcher’s shops. There were 550 butcher’s shops in the Manchester conurbation in 1841.13 See a complete alphabetical directory in the Supplementary Files. But anyway, it is impossible to build an image in the mind, of the “migration”; this would be a mass of 50,000 persons (a football stadium), simultaneously crossing the town, … with its bad streets.
13Pigot & Co.’s ….. Directory of Yorks, Leics, …Great Manufacturing Towns of Manchesterand Salford (London and Manchester, 1841), pp. 733-735.
(Pigot and Co., National Commercial Directory for 1828-9)
As to the consumption of meat, we have a report from the Manchester Statistical Society, that the consumption of butcher’s meat in the Manchester conurbation in 1836 was 100 pounds per person per year (34,700,000 pounds divided by 343,000 persons). They calculated this figure using the reports of the toll offices at the entrances to Manchester, and checking this against the sales in the butchers’ shops:
To these figures should be added the consumption of bacon, pork, fish and poultry.
On the other hand, these are weights “on the bone”, thus the edible part of the animal was 30 % less.
(Benjamin Love, Manchester as it is, Manchester, 1839, p. 159)
[Original text: W. McConnel, An attempt to ascertain the quantity of butchers’ meat consumed in Manchester in 1836, read in 1837; Manchester Statistical Society Papers, 1837-1861, p. 51: text now not findable]
The amount of meat consumed weekly by a typical workman and his family in Manchester in 1849, was 5 lb. of butcher’s meat and 2 lb. of bacon. These cost 4 shillings out of a total income of 30 shillings per week.
David Chadwick; On the Rate of Wages in Manchester and Salford, and the Manufacturing Districts ofLancashire, 1839-59, Table (DD), p. 35, https://www.jstor.org/stable/2338478
VIII. Different Levels of Housing in Manchester
Engels informs us that all the districts of Manchester (apart from the mansions of the wealthy, on the outskirts of the town), were uniformly poor, dirty, with dirty water and excrement in the streets, and with houses with small rooms and people living in cellars. But the truth is that there was a great differentiation in the housing for the working class.
“Of the first or lowest class, averaging 1s. 3d. per week rent, the occupants are of the poorest description of persons, paying frequently one-fourth of their income for rent; by which the landlords or owners realize about eight per cent net on the outlay; whilst the dwellings are without ovens or boilers, and are often filthy, damp, and unfit for habitation; generally deficient of privies, or drainage; or, in manufacturing towns, one privy to 10 or 15 houses.
The second class of dwellings are occupied by a better class of labourers, paying about one-sixth of their incomes for rent; producing, perhaps, 8 ¾ per cent to the owners as interest on their capital; and although many of them are very defective, as regards drainage and privies, they are still much better provided than the class before described; and many of them have ovens or boilers.
Of the third or best class, the occupants being generally more skilled and a better class of workmen, whose rent amounts to about one-eighth of their income, producing 9 ¾ per cent on the outlay to the owners; and here we find far superior accommodation and comparatively comfortable dwellings, well drained, and provided with privies; frequently gardens, and in most of them ovens or boilers.
These results confirm the lamentable fact, that the lower the poor are reduced in the social scales, the more they are subject to imposition and extortion.
The cottages erected by the manufacturers, and other respectable owners of cottage property, are very superior in every respect to those built or purchased by avaricious speculators, whose sole object is gain, and who enforce the payment of their rents with rigid severity. They are moreover commodious, clean, white-washed, and in many cases have the advantage of school-houses.”
(Poor Law Commissioners, Local Reports on the Sanitary Condition of the Population, 1842; 17. Lancashire, Cheshire, Derbyshire and Staffordshire, p. 247)
The 24 unions included in the list above comprised, according to the census of 1831, a population of 663,890. Lowest class (of the descriptions above) were 37,119 cottages (estimated 167,035 persons), second class were 46,050 cottages (207,225 persons), third class were 26,322 cottages (118,449 persons). The total was 109,491 cottages (492,709 persons).17
16Poor Law Commissioners, Local Reports …, 17. Lancashire, Cheshire, Derbyshire and Staffordshire, p. 247.
17Ibid., p. 244
(Poor Law Commissioners, Local Reports on the Sanitary Condition of the Population, 1842; 17. Lancashire, Cheshire, Derbyshire and Staffordshire, p. 242)
IX. Poor Areas of the City
The better classes, when they talked about “the poor”, did not mean “the totality of the working class”. For them, “the poor” were those persons who were objectively poor, that is, did not earn enough to eat properly, or were unemployed, or had very bad living conditions. The majority of workers were referred to as “the labouring classes” or “the factory operatives”, and were able to eat enough. In all the manufacturing towns, the really poor lived in clearly defined areas.
M. Faucher in 1844 mentioned “the poor quarters of the town – Angel Meadow, Garden-Street, Newtown, St. George’s Road, Oldham Roads, Ancoats, and Little Ireland. …” (Léon Faucher, Manchester in 1844: Its Present Condition and Future Prospects, 1844, p. 27)
Herr Johann Georg Kohl made visits to several parts of Manchester, including the poor parts near the rivers Irk and Irwell. “Sometimes the work-people of each manufactory form a little community by themselves, living together in a neighbourhood in a little town of their own [probably he means Ancoats]; but in general they occupy particular quarters of the town, which contain nothing but long unbroken rows of small low dirty houses, each exactly like the other. These quarters are the most melancholy and disagreeable parts of the town, squalid, filthy and miserable, to a deplorable degree.” (Kohl, Reisen in England und Wales, 1844, p. 133)
Mr. Nassau Senior, a politician who was a firm proponent of the New Poor Law, visited Manchester on a fact-finding trip. He was steered in the right direction: “The difference in appearance when you come to the Manchester operatives is striking: they are sallow and thinner. But when I went through their habitations in Irish Town, and Ancoats, in Little Ireland, my only wonder was that tolerable health could be maintained by the inmates of such houses.”
(Senior, Nassau W., Letters on the Factory Act, as it affects the Cotton Manufacturer;Addressed to the Right Honourable The President of the Board of Trade; London, 1837; p. 16)
“Several of the habitations of the Manchester poor are low, damp, ill-ventilated, and surrounded with filth. This is especially the case in Little Ireland, and the neighbouring district, which is chiefly inhabited by Irish. This, however, the most destitute part of the population, does not in general work in factories; but it would be a great improvement in their condition if they did, as the worst room in a factory is a palace of health and comfort in comparison with their miserable dwellings. The factory workmen are usually in a very comfortable condition, many of their houses displaying neatness, and even elegance in their arrangements; and when I visited them at dinner-time, the occupants were generally eating fresh meat and potatoes.”
(Factories Inquiry Commission, Supplementary Reports, Part I, 1834; D2 Lancashire District, Report by Mr. Tufnell, p. 204)
The rapporteur for Manchester to the Poor Law Commissioners in 1842, Dr. Howard (Physician to the Ardwick and Ancoats Dispensary), made it clear that, although there were really horrible districts in Manchester, these were confined to a small number of regions.
“That the filthy and disgraceful state of many of the streets in those densely populated and neglected parts of the town where the indigent poor chiefly reside, cannot fail to exercise a most baneful effect on their health, is an inference which has fully proved to be well founded; and no fact is better established than that a large proportion of the cases of fever which occur in Manchester originate in these situations.”
(Poor Law Commissioners, Local Reports, 1842, Lancashire, p. 305)
“It appears to me to be unnecessary to lengthen this report by specifying the particular localities in which nuisances, productive of malaria, tending injuriously to affect the health of the inhabitants, and to promote the prevalence of contagious diseases, exist; but it may be well to mention a few of the streets which, either from being unpaved, or without drains, or containing collections of refuse, &c., or being over-crowded and ill ventilated, have been remarked to be particularly unhealthy.” (ibid., p. 312)
“These two districts [Ancoats and Angel Meadow] are very densely populated, principally by hand-loom weavers and the workpeople employed in the factories, a large proportion of whom are Irish, living for the most part in a state of extreme indigence, and without the least attention to cleanliness. Altogether they comprehend by far the worst quarters of the town both as regards the wet and filthy state of the streets, the dirty, damp and dilapidated condition of the houses, and the improvidence, poverty, and destitution of the inhabitants; and, as might be anticipated, they furnish the great bulk of our fever patients.”
(ibid., pp. 313-314)
“Of the 1042 patients admitted into the House of Recovery [the Fever Hospital] from the 31st May, 1838, to the 31st May, 1839, 276 came from Ancoats district, 320 from Angel Meadow district, 104 from the Collegiate Church district, 141 from Bank Top district, 134 from Deansgate district, and 67 from Salford.”
(ibid., p. 316)
X. Health and Hospitals
“Another source of physical mischief to the working class lies in the impossibilty of employing skilled physicians in case of illnesses. It is true that a number of charitable institutions strive to supply this want, that the infirmary in Manchester, for instance receives or gives advice and medicine to 2,200 patients annually. But what is that in a city in which, according to Gaskell’s calculation, three-fourths of the population need medical aid every year? English doctors charge high fees, and working-men are not in a position to pay them.” (Chapter 5, Results, p. 69)
The men with continuous employment, covered their costs of medical care with deposits in the benefit societies, i.e. self-funded insurance contracts.
‘There is a description of mutual support among the operatives of this town, which tends materially to alleviate the pressure of the times. We allude to the numerous benefit societies in existence. These societies are constituted for the purpose of affording relief to the operative when out of employment through sickness, and to provide the means for his decent interment in case of death. The precise number of these societies it is difficult to arrive at. … In the savings bank in Manchester, the accounts of upwards of 183 such societies are kept; and they have each an average amount on hand of 83 pounds. From inquiries made at the various banks in town, we arrive at the conclusion, that there are not, on a moderate computation, less than 500 such societies in Manchester.’26
26Benjamin Love, The Hand-Book of Manchester (Manchester, 1842), pp. 109-110.
The above description is not complete. Generally, the Benefit Society had a contract with a given doctor, who would give advice and medicines to the sick persons, and who himself was remunerated by the funds of the Society.
“Attached to the institution are six physicians and six surgeons, who, being chosen by ballot from several candidates, by the whole of the trustees, may fairly be supposed to be of the highest medical talent and respectability; and thus, by means of this excellent institution, the poor have secured to them, the first scientific skill. Besides the above-mentioned medical officers, there are visiting apothecaries, and a resident surgeon and apothecary.”
(Benjamin Love, the Hand-Book of Manchester, 1842, p. 120)
Although only 2,200 in-patients were treated yearly, there were a large number of out-patients and home patients:
86 operations were carried out in the period from April 1840 to January 1841.
The hospital gave service only to the poor, but this was without charge. This was possible because the capital costs of the hospital were covered by the original subscription, the running costs were covered by the yearly subscriptions from the better classes, and the doctors worked without making a charge.
Once a patient was recommended by a subscriber, he or she applied for admission to the hospital, with admissions occurring every Monday on a weekly schedule. Patients were supposed to be known to the subscriber as well as being indigent. Subscribers discovered to be recommending patients who could afford to pay for their own care were chastised. The problem with this system was that the working poor were unable to receive medical care, since they could conceivably pay for it.
“The hitherto increasing duration of life in England is no disproof of this latter remark. It is to be accounted for, among other causes, by the extraordinary improvements which have taken place in medicine, and all its collateral branches, within the last eighty years, by the gratuitous medical aid now almost universally afforded to the poor, which places, them in this most important particular, on a level with the rich; and, not least, by the increase which has taken place in the means of subsistence – a circumstance that has been singularly favourable in the rearing of healthy children.”
(John Roberton, doctor, General Remarks on the Health of English Manufacturers, 1831, p. 10)
We return to the above-mentioned Second Report … State of Large Towns and Populous Districts, 1845, and its Questionnaire no. 58. ‘To what extent is medical advice or assistance sought for by the poorer classes, and how far is it afforded to them gratuitously or otherwise?’
Of the 23 medium and large towns who answered the Questionnaire, all of them confirm that the poorer classes receive the medical care gratis; usually the individual doctors did not charge the poor persons (See annexed list of replies; the cases of Birmingham, Dudley and Bradford, include benefit societies).
The Lying-in Hospital gave midwife services at home to poor married women at the time of delivery; the nurses were trained in the hospital. Difficult cases were treated by a doctor in the hospital. In 1840 3,400 women were helped by the institution; this would be about the half of the births in the city, or three-quarters of those of working class women. The cost was about 6 shillings, which covered the payment to the nurse.
(Benjamin Love, the Hand-Book of Manchester, 1842, p. 123)
Other hospitals were: the Royal Lunatic Asylum, the House of Recovery (fevers), the Salford and Pendleton Royal Dispensary, the Chorlton-upon-Medlock Royal Dispensary, the Ardwick and Ancoats Royal Dispensary (“this institution includes in its district, nearly 100,000 souls, and a population, mostly in the humblest circumstances”), the Institution for Curing Diseases of the Eye, the Lock Hospital (venereal diseases of women), the Dispensary for Children.
There was also a Medical School, legally authorised to extend degree certificates.
XI. Geography of Manchester
Engels makes a number of mistakes as to the descriptions of some parts of Manchester:
“Farther down, on the left side of the Medlock, lies Hulme, which properly speaking is one great working-people’s district, the condition of which coincides almost exactly with that of Ancoats; the more thickly built-up regions chiefly bad and approaching ruin, the less populous of a modern structure, but generally sunk in filth.” (Chapter II, Great Towns, p. 42)
Actually it was inhabited by independent workers and small shopkeepers, and the first houses were built around 1820.
Trade Directories in 1845 give in Stretford Road: builder, grocer & tea dealer, boot maker, earthenware dealer, butcher.
We see that Hulme was being gradually built up, because in 1841 there were not yet any inhabited houses in Stretford Road, registered in the Census.
(Birley Fields, Hulme, Community Excavation, Oxford Archaeology North, Manchester Metropolitan University, June 2012, p. 11.)
The case of the movement of the better class of workers, shopkeepers, and mechanics from the Township of Manchester to the new suburb of Hulme in 1825 to 1860 is illustrative of the improvements. Hulme was laid out on a rectangular plan, the streets were wide, the houses were new and each had a privy in the back-yard, there were no inhabited cellars, the inhabitants were of decent occupations, and the suburb did not have any factories – with coal smoke – nearby.
(Second Report on the State of Large Towns, 1845, Appendix, pp. 106-116).
Parliament Bill 1825 Improvement Township Hulme
“… for while Pendleton, Hulme (a newly-peopled township), and the parts of Chorlton-upon-Medlock, and of Ardwick, bordering on the Medlock, are occupied by the skilled or best-paid labourers, …
(op. cit., p. 106)
One of the worst parts of Manchester, as regards poverty, violence, housing overcrowding, and lack of sanitation, was generally taken to be to be “Little Ireland”, on the River Medlock at the southern margin of the city. Engels gives a very negative description of these conditions. We may suppose that the qualitative description is correct, as it is “about the same level of poverty” as the report by a Sub-Committee of the Board of Health, specific to Little Ireland at the time of the Cholera Outbreak in 1831.
However, we should direct our attention to the numerical information given by Engels.
“But the most horrible spot, (if I should describe all the separate spots in detail I should never come to the end), lies on the Manchester side, immediately southwest of Oxford Road, and is known as Little Ireland. In a rather deep hole, in a curve of the Medlock, and surrounded on all four sides by tall factories and high embankments, covered with buildings, stand two groups of about two hundred cottages, built chiefly back to back, in which live about four thousand human beings, most of them Irish. The cottages are old, dirty, and of the smallest sort, …. But what must one think when he hears that in each of these pens, containing at most two rooms, a garret and perhaps a cellar, one the average twenty human beings live; that in the whole region, for each one hundred and twenty persons one usually inaccessible privy is provided; …” (Chapter II, “The Great Cities”, p. 41)
the houses were not old, they were only built in 1821-1824 (see 1821 map by Pigot, and 1824 map by Swire);
only the lower group of houses was in a hole (20 feet deep), which was a level area on the bank of the Medlock; the upper group gave on to a road which ascended to Oxford Road;
the lower group was not “surrounded on all four sides by tall factories and high embankments”; on the north-west and north-east there were no buildings, on the south there was the river (which sometimes flooded the area), and on the west there was a small mill and a gasometer;
the upper group did not have any industrial buildings nearby;
the total population of the area was 1510, according to the Census of 1841; as there were in total 201 houses, the density was 7.5 per house;
population of the lower block was 381, in 61 houses, which gives 6.2 per house, and the population of the upper block was 1129, in 140 houses, which gives 8.1 per house;
The houses were all of two stories, with rooms of 13 feet square, with the exception of those of the block on Oxford Road, which were 13 feet by 26 feet (see Ordnance Survey, Manchester and Salford, 1849/1851, 5 feet to the mile, Sheet 33).
[The block on Oxford Road, i.e. the last one to the east, still exists, in the form of “The Grand Central Pub”. If we look at it today, we should construct in our mind, that here were 8 domiciles for probably 80 persons (generally, more than one family per housing unit).
Commercial name of “Beef & Barley Steak House” in 1970. We see the first five housing units. All extend 26 feet to the back of the block.]
Bolton
His description of Bolton also has some errors, … although he was used to visiting the town [?]
“Among the worst of these towns after Preston and Oldham is Bolton, eleven miles northwest of Manchester. It has, so far as I have been able to observe in my repeated visits, but one main street, a very dirty one, Deansgate, which serves as a market and is in even the finest weather, a dark unattractive hole in spite of the fact, that, except for the factories, its sides are formed by low one and two-storied houses. Here, as everywhere, the older part of the town is especially ruinous and miserable.” (Chapter II, “The Great Towns”, p. 30)
The fact was, there were about twenty wide and straight streets (see Ordnance Survey, Bolton, 1847/1849, 5 feet to the mile, Sheets 6, 8, 9, 12, 13)
Deansgate, according to an engraving of 1840, was clean and open to the sky.
Deansgate looking east c.1840; 5-7 Deansgate is still visible today (from an engraving in the Bolton Archives collection)
“North of the iron district of Staffordshire lies an industrial region to which we shall now turn our attention, the potteries, whose headquarters are in the borough of Stoke, embracing Henley, Burslam, Lane End, I.ane Delph, Etruria, Coleridge, Langport, Tunstall and Golden Hill, containing together 60,000 inhabitants. The Children’s Employment Commission reports upon this subject that in some branches of this industry, in the production of stoneware. the children have light employment in warm, airy rooms; in others, on the contrary, hard, wearing labour is required, while they receive neither sufficient food nor good clothing. Many children complain: “ Don’t get enough to eat, get mostly potatoes with salt, never meat, never bread, don’-t go to school, haven’t got no clothes.” “ Haven’t had nothin’ to eat to-day for dinner, don’t never have dinner at home, get mostly potatoes and salt, sometimes bread.” “ These is all the clothes I have, no Sunday suit at home.”” [apparently Interviewee No. 14, William Hell, aged 13] (The Remaining Branches of Industry, pp. 137-138)
We have a large amount of information about the life of the workers – adults and children – in the Potteries in 1841, from the report of Dr. Samuel Scriven to the Commissioners of the Children’s Employment Commission [the source used by Engels]. He specifically collected and commented data as to the possible dangers to the children from: handling materials and products with a lead/arsenic content, long hours, employment from an early age, walking long distances daily to take the ware from the workshop to the kilns, exposure to extreme differences in temperature and excessive currents of air. The handling of materials and products with a lead content also affected the adults. The report includes 330 interviews with children, adult workers, adults who supervise the children in their workrooms, administrators and owners of factories, clergymen, doctors, principals of schools, and a police chief. He visited, and took interviews, in the majority of the factories.
(Samuel Scriven, Report to Her Majesties Commissioners on the Employment of Children and Young Personsin the District of the Staffordshire Potteries; and on the actual State, Condition, andTreatment of such Children and Young Persons, House of Commons, Children’s Employment Commission, 1841)
But the living conditions of the workers (adult and children) were good.
“The operatives are in their general character a quiet, orderly people, possessing not only the necessaries, but in most instances the comforts and luxuries of life; their habitations are respectable, cleanly, and well furnished.” (p. B 2, note 11).
“Their wages are considered the best of any staple trade in the kingdom.” (p. C 4, note 12)
In his first page, he notes that that the sales volume at the date of his report is very much lower than in an average year:
“Perhaps no time or period of the year could have been more unfortunate than that which I have been engaged,- first because the monied and commercial interests of America, a country of which the welfare of this district so much depends, has been such as to create fearful anticipations and an extraordinary depression of the trade, by which thousands have been thrown out of employ. In the second place, manufacturers availing themselves of this (it is to be hoped, temporary evil) have allowed workpeople to absent themselves during the Christmas season, by which they have been enabled to nurse their orders for a future day. Thirdly, the intensity of the frosts was such as to obstruct the navigation of the canals by which they receive and transmit their materials and goods, thereby compelling them to suspend every operation of potting.” (page C1, note 6)
The persons interviewed by Dr. Scriven are 330 in total, 117 adult workers (incl. room supervisors), 126 children of age 14 or less, 87 “professional persons” (owners, administrative office, priests, schoolmasters/-mistresses, teachers, magistrate, police superintendent). The professional persons would appear to be the totality of this group in the Potteries region.
As to food, 22 of the children report that they eat beef or bacon with ‘tatoes daily; 13 sometimes beef or bacon with ‘tatoes; 2 could eat more; several eat as much as they want. No boy or girl makes a complaint about the quantity of the food. Those who work in painting and in transfers, bring their food every day, and heat it at midday on the oven.
The use of the “slip” (solution of clay with lead and arsenic added, in small quantities) which was painted onto the ware, did cause grave problems to the men; a few had died in the previous years, and some had a paralysis of an arm or a whole side of the body, while others had problems in the stomach and intestines. It appears that those men who washed their arms well after working, and covered themselves properly, did not suffer these problems. The boys did not suffer much from the “slip”. The excessive walking each day did make them very tired when they went to bed, and they were in general thin. The effect on the men of working very long hours, added to the extreme distances that they walked when they were children, is seen from the fact that from 1840 to 1860, the adult men on average lost two inches of height.
The children who are employed in painting, flower-making, moulding and engraving have an easy life. These are girls from 8 to 17 years old, and boys from 14 to 17. “They are seen sitting at their clean tables, at a comfortable distance from each other, and in an airy, commodious, and warm room, well ventilated, and heated by a stove or hot plate, on which they dress their meals. The women who superintend their work are generally selected from among the rest on the premises on account of their good moral conduct and long servitude. They commence their duties at six in the morning in summer, and at seven in winter, and leave at six. In the midst of their occupations (which have in reality more the character of accomplishments) they are allowed the indulgence of singing hymns. I have often visited their rooms unexpectedly, and been charmed with the melody of their voices. In personal appearance they are healthy, clean, and well conducted.” (p. C 4, paragraph 14)
14 of the children interviewed say spontaneously that they like their work (these are not only the painting and engraving children). Those that work with the “slip” say that it has not hurt them yet. Nearly all the mould-runners say that they go to bed very tired. The children’s way of expressing themselves gives the idea that they have had to grow up quickly.
The boys say that they are never hit by the men that they work for. This is confirmed by men and women who supervise the rooms where the boys and girls work. This is clearly due to the fact that the owners are very decent persons, generally practicing Methodists. One of the supervisors says “… on the whole there cannot be better masters”. Dr. Scriven, at the beginning of his report, writes “The manufacturers are a highly influential, wealthy, and intelligent class of men: they evince a warm-hearted sympathy for those about them in difficulty or distress, contribute as much as possible to their happiness, and are never known to inflict punishments on the children, or allow others to do so.” (p. C 2, point 7)
But sometimes the owners were too good:
“It is the custom here sometimes to lend money to the people if in distress, and deduct the amount by instalments from the parents themselves or wages of the children. Master has often lost money by this when meeting with unprincipled men.” (William Griffith, Interviewee No. 35)
There was a large amount of drunkenness in the towns, as the workers had a lot of spare money.
XII. Unfounded accusations against progressive mill-owners
Engels first accepts that the “country manufacture” gives healthy jobs, good wages, and nice cottages to their employees. But he then accuses the owners of hypocrisy, of exercising control over the employees, and that there “may be” a truck shop in the neighbourhood.
Note that the accusations are formulated in such a way, that they cannot be disproved.
“You come to Manchester, you wish to make yourself acquainted with the state of affairs in England. You naturally have good introductions to respectable people. You drop a remark or two as to the condition of the workers. You are made acquainted with a couple of the first Liberal manufacturers, Robert Hyde Greg, perhaps, Edmund Ashworth, Thomas Ashton, or others. They are told of your wishes. The manufacturer understands you, knows what he has to do. He accompanies you to his factory in the country; Mr. Greg to Quarrybank in Cheshire, Mr. Ashworth to Turton near Bolton, Mr. Ashton to Hyde. He leads you through a superb, admirably arranged building, perhaps supplied with ventilators, he calls your attention to the lofty, airy rooms, the fine machinery, here and there a healthy-looking operative. He gives you an excellent lunch, and proposes to you to visit the operatives’ homes; he conducts you to the cottages, which look new, clean and neat, and goes with you into this one and that one, naturally only to overlookers, mechanics, etc., so that you may see -”families who live wholly from the factory”. Among other families you might find that only wife and children work, and the husband darns stockings. The presence of the employer keeps you from asking indiscreet questions; you find every one well-paid, comfortable, comparatively healthy by reason of the country air; you begin to be converted from your exaggerated ideas of misery and starvation. But, that the cottage system makes slaves of the operatives, that there may be a truck shop in the neighbourhood, that the people hate the manufacturer, this they do not point out to you, because he is present. He has built a school, church, reading-room, etc. That he uses the school to train children to subordination, that he tolerates in the reading-room such prints only as represent the interests of the bourgeoisie, that he dismisses his employees if they read Chartist or Socialist papers or books, this is all concealed from you. You see an easy, patriarchal relation, you see the life of the overlookers, you see what the bourgeoisie promises the workers if they become its slaves, mentally and morally. This “country manufacture” has always been what the employers like to show, because in it the disadvantages of the factory system, especially from the point of view of health, are, in part, done away with by the free air and surroundings, and because the patriarchal servitude of the workers can here be longest maintained. Dr. Ure sings a dithyramb upon the theme. But woe to the operatives to whom it occurs to think for themselves and become Chartists! For them the paternal affection of the manufacturer comes to a sudden end. Further, if you should wish to be accompanied through the working-people’s quarters of Manchester, if you should desire to see the development of the factory system in a factory town, you may wait long before these rich bourgeoisie will help you! These gentlemen do not know in what condition their employees are nor what they want, and they dare not know things which would make them uneasy or even oblige them to act in opposition to their own interests. But, fortunately, that is of no consequence: what the working-men have to carry out, they carry out for themselves.” (Text not present in the English version of Mrs. Wischnewetzky; in the German version of 1848, see the footnote with asterisk in page 227 and extending to page 228; this English translation is copied from the last page of the Chapter “Single Branches of Industry”, in the www.marxists.org version)
The better class of the owners were generally accepted as humane and moral persons.
“The law was not passed for such mills as those of Messrs. Greg and Co., at Bollington, Messrs. Ashworths, at Turton, and Mr. Thomas Ashton, at Hyde; had all factories been conducted as theirs are, and as many other I could name are, there would probably have been no legislative interference at any time. But there are very many mill-owners whose standard of morality is low, whose feelings are very obtuse, whose governing principle is to make money, and who care not a straw for the children, so as they turn them well to money account. These men cannot be controlled by any other force but the strong arm of the law; …..”
(Nassau Senior, Letter from Mr. Horner to Mr. Senior, 23 May 1837, Letters on the Factory Act, B. Fellowes, London, 1837)
(Mr. Horner was the Chief Inspector of Factories)
But we cannot, at this distance of time, know what proportion of the mill owners treated the children well, and what proportion treated them badly.
Possibly the good mill owners were actually in the majority:
“When I entered a factory, I am bound to remark that I experienced much readiness on the part of the proprietors and of their overlookers in procuring for me ample means of making an impartial inquiry. If I am able to confide in my own observation, and in the accounts furnished to me by workpeople of every age in private conversations frequentlyrepeated, I must arrive at the conclusion, that the proprietors are generally anxious to promote the convenience and comfort of their dependents as far as the system admits; that they usually endeavour to prevent acts of harshness and of immorality; that if such cases arise, it is mainly owing to their absence, or to their neglect of personal superintendence; and that there are not a few among them who really act a paternal part, and receive the recompense of respect and gratitude. Their situation is a difficult one; but the more closely they assume the character of the observant master of a great family, and the more narrowly they investigate, appreciate, and purify the composition of their family, the more likely is every factory to become respectable and happy.”
(Factories Inquiry Commission, Second Report, 1833, Medical Reports by Dr. Hawkins, General Report respecting the Counties of Lancashire, Cheshire, and Derbyshire, D.3., p. 5)
Mr. Oldknow, owner of a large mill on the outskirts of Manchester, had a very good reputation, which was manifested at his funeral:
“Oldknow died at Mellor Lodge on September 18th, 1828, and he was buried on September 24th at Marple Church. “Few men,” says the Gentleman’s Magazine of November 1828, “who have of late quitted this transitory scene have led a life of greater industry and more active benevolence, or died more universally lamented than this individual … How he was loved and honoured is perhaps best told by the spontaneous feeling of all classes of society on that occasion. From an early hour the people began to assemble, and lined the way from his house to the Church, closing as the procession moved along. On its arrival at the gateway a line was formed by the children from the Military Asylum, each dressed in a scarlet spencer, and a black band around the arm … The funeral service was read by the Rev. Mr. Litler, The Reverend Gentleman himself was much affected and hundreds gave free vent to their feelings of real sorrow. … Probably the number assembled was not less than 3,000. As it was the general wish to see where the body was deposited, several hours elapsed before the vault was clear.””
(Unwin, George; Hulme, Arthur; Taylor, George; Samuel Oldknow and the Arkwrights: The Industrial Revolution at Stockport and Marple, 1924, pp. 234-235)
XIII. Financial and Housing Properties
According to Engels, as the workers could not save anything out of their exiguous wages, they were always in a precarious situation, and did not know if they would have money tomorrow.
“True, it is only individuals who starve, but what security has the working man that it may not be his turn tomorrow? Who assures him employment, who vouches for it, that, if for any reason or for no reason his lord and master discharges him tomorrow, he can struggle along with those dependent upon him until he mar find some one else “to give him bread?” Who guarantees that willingness to work shall suffice to obtain work, that uprightness, industry, thrift, and the rest of the virtues recommended by the bourgoisie, are really his road to happiness? No one.” (Chapter II, The Great Towns, p. 19)
But the better class of workers were the owners of physical and financial assets.
Many of them had houses bought in cash, or paid through mortgages.
In Bradford a large number of the workers owned their houses:
“Do many of the labouring classes own houses?” “Many of the working classes have built their own cottages; those that have saved perhaps 60 l. or 70 l. have purchased land and raised money on mortgages, and then have erected others. In some instances clubs, sustained by monthly payments, have built, and the houses are divided by valuation and lot.
“What proportion of labouring class houses are held directly or indirectly by themselves?” “I cannot state precisely; probably there might be one-third of the cottage houses owned by the labouring class.”
“Are there other classes that are wholely dependent on cottage rent?” “Yes; I know several who sink all their capital in cottages, and depend on the rent.”
(Report of the Commissioners on the State ofLarge Towns and PopulousDistricts, 1845, Vol. 2 p. 183; Bradford, Dwellings of the Working Classes, evidence of Mr. Joseph Farrar, one of the Secretaries of the Mechanics’ Institute)
“The more providential amongst them [potters] work six days in the week, twelve hours each day, and the miserly and penurious more than that, and get a great deal of money. Perhaps there is no manufacturing district in the kingdom where so many freeholds are held by working men – one whole street, called Hot-lane, is possessed exclusively by them, in this immediate neighbourhood.”
(Samuel Scriven, Report to Her Majesties Commissioners on the Employment of Children and Young Personsin the District of the Staffordshire Potteries; and on the actual State, Condition, andTreatment of such Children and Young Persons, House of Commons, Children’s Employment Commission, 1841; interviewee 204, Mr. Godwin, Principal)
Many of the houses in Manchester were built by people who used a flimsy form of construction in order to get out a maximum of profit from the property. The houses were built at a minimum cost, without cellars or foundations, and with walls of only half a brick thickness.
But the investors were not rich people, but “building clubs”, whose members were workers with good earnings and tradespeople. There had been possibly 150 of these clubs in Manchester and nearby towns since the commencement; if each club had 100 “investors” at 100 pounds each, this would correspond to a total of 1,500,000 pounds. At 60 pounds cost of construction each, this would be 25,000 houses which had been built with this scheme.
The members paid 10 shillings per month, thus every 2 months the club had 100 pounds to start a building. This shows us that there were a good number of working-class men who could save 10 shillings a month, and also had taken the decision to use this amount in an “investment”. A person who wanted to build at this moment on a given lot, could take up all the money for the house, and contract to pay the money in the following months to his co-investors. The payments for the house were assured by a mortgage on the house.
(Poor Law Commissioners, Local Reports on the Sanitary Condition of the Population, 17. Lancashire, Cheshire, Derbyshire and Staffordshire, 1842, pp. 240-241)
(J. T. Slugg, Reminiscences of Manchester Fifty Years Ago, J. E. Cornish, Manchester, 1881; Chapter XXV, Building Clubs)
“The Manager of the Manchester Savings’ Bank, (and on the best grounds he formed his opinion) has stated that there is as much money annually invested in building clubs in Manchester, as in the Saving Bank.” (p. 111)
The main instrument for saving money was the government-administered Savings Bank. Only the members of the working classes could invest in these (limits on yearly deposit amounts and on net balance), but husbands and wives could have separate accounts.
We do know how much money “the people” had saved up. In 1849 in the savings banks there were 1,100,000 depositors from all the United Kingdom with a total amount of 28.5 million pounds. The number of depositors increased from 370,000 in 1830 to 1,100,000 in 1849. With a total population of 18,000,000 [1841] and 5 persons per family, this means that 30 % of the families in the United Kingdom had money in excess of their expenses, of about 26 pounds or 520 shillings each accumulated, when the average weekly income for a working-class family in good circumstances was 25 shillings.
(George Porter, The Progress of the Nation: …, 1851, Increase of Personal and Real Property, pp. 612-613)
In the year 1844, there were 20,680 working class families with a deposit account in the Manchester and Salford Savings Bank. The total deposit amount was 568,000 Pounds, the amount deposited in the year was 188,000 Pounds, and the withdrawals were 126,000 Pounds.
David Chadwick; On the Rate of Wages in Manchester and Salford, and the Manufacturing Districts ofLancashire, 1839-59, Table (CC), p. 34, https://www.jstor.org/stable/2338478
The Manchester and Salford Savings Bank was situated at the corner of Cross Street and King Street. Engel’s offices were on Deansgate, where the House of Fraser is now. The distance is about 200 yards, so he must have known where the bank was.
There were also benefit societies, building societies, and unemployment clubs.
XIV. Supposed Indifference to Religion
“His faulty education saves him from religious prepossessions, he does not understand religious questions, does not trouble himself about them, knows nothing about the fanaticism that holds the bourgeoisie bound; and if he chances to have any religion, he has it only in name, not even in theory. Practically he lives for this world, and strives to make himself a home in it. All the writers of the bourgeoisie are unanimous on this point, that the workers are not religious, and do not attend church. From this general statement are to be excepted the Irish, a few elderly people, and the half bourgeoisie, the overlookers, the foremen and the like. But among the masses there prevails almost universally a total indifference to religion, or at the utmost, some trifling Deism too underdeveloped to amount to more than mere words, or a vague dread of the words infidel, atheist, etc.” (Chapter V, Results, p. 84)
According to the Religious Census of 1851, in Manchester there were 105,000 sittings for a population base of 303,000, in Liverpool there were 176,000 sittings for a population base of 375,000, and in Leeds there were 81,000 sittings for a population base of 172,000 (pp. 121-124). [A “Sitting” was the attendance of one person on a typical Sunday, as reported by the priest to the Census authorities]. The given numbers of sittings arithmetically cannot be only the better classes, but must include also a large segment of the working classes.
In Manchester in 1851 there were 32 Church of England buildings, 19 Independents, 17 Wesleyan Methodists, 10 Wesleyan Association, 7 Roman Catholic, 4 Unitarians, 1 Society of Friends, 5 Primitive Methodists, and 2 Jewish Synagogues.
There was also a Town Mission for Manchester, which carried out activities intermediate between the present-day “Jehovah’s Witnesses” and the Salvation Army.
The active people came from the Church of England, Methodists, Independents, Presbyterians and Moravians. According to their report of 1841, they had held five thousand meetings, in which one hundred thousand people heard the Gospel. (pp. 148-151)
We have a useful information of the distribution of worshippers in Leeds in 1839:
(Statistical Committee of the Town Council, Report upon the Condition of the Town of Leeds and of its inhabitants. 1839, https://www.jstor.org/stable/2338052, p. 397.)
“In dividing the accommodation according to the sects, we see that there are 9 churches belonging to the Establishment, containing 13,235 sittings; 3 Catholic chapels, with 1,970 sittings; 17 Methodist chapels, with 16,340 sittings; 6 Independent chapels, with 6,030; and 5 belonging to other sects, and containing 3,876 sittings.
The distribution of the accommodation is very unequal. In the North, North-east, and East wards, which are inhabited chiefly by the labouring classes, there are only 11,850 sittings for a population of 43,046 individuals, while in the other and more opulent wards there are 29,601 sittings for 39,074 persons.
[The low proportion for the North, North-east and East wards, may be due to the fact that only two churches were built in this geographical area; but even so, this is a proportion of 25 %, not zero.]
The remaining institutions of a religious character existing in the town are, the Religious Tract Society, the Leeds Branch Missionary Society, the Leeds Ladies’ Branch Bible Society, the Leeds Auxiliary Bible Society, the Auxiliary Methodist Missionary Society, the District Committee for Promoting Christian Knowledge, the Association in aid of the Moravian Mission, the Auxiliary Hibernian Society, with a few others.”
XV. Physical Aspect of the Workmen
The workers in Manchester were, since the beginning of the century, known for being short and of sallow countenance.
“A recruiting officer testified that operatives are little adapted for military service, looked thin and nervous, and were frequently rejected by the physicians as unfit. In Manchester he could hardly get one of five feet, eight inches; they were usually only five feet, six to seven, whereas in the agricultural districts, most of the recruits were five foot eight.” p. 107
Factories Enquiry Commission, First Report, 1833, Mr. Tufnell’s Evidence, p. 59.
“It is perfectly true that the Manchester people have a sickly, pallid appearance; but this is certainly not attributable to factory labour, for two reasons: first, because those who do not work in factories are equally pallid and unhealthy-looking, and the sick society returns show that the physical condition of the latter is not inferior:- secondly, because the health of those engaged in country cotton factories, which generally work longer than town ones, is not injured even in appearance … Mr. Wolstenholme, surgeon at Bolton, says that “the health of factory people is much better than their pallid appearance would indicate to any person not intimately concerned with them.””
(Factories Inquiry Commission, Supplementary Report … as to the Employment of Children in Factories, 1834, Part I, Mr. Tufnell’s Report from Lancashire, p. 198)
“The result of all these influences is a general enfeeblement of the frame in the working- class.” (Chapter V, «Results», p. 70
Edwin Chadwick reports that the members of the labouring class had in the 1830’s and 1840’s, strong bodies, and certainly stronger than those of workers in France and Germany:
“This depressing effect of adverse sanitary circumstances on the labouring strength of the population, and on its duration, is to be viewed with the greatest concern, as it is a depressing effect on that which most distinguishes the British people, and which it were a truism to say constitutes the chief strength of the nation – the bodily strength of the individuals of the labouring class. The greater portion of the wealth of the nation is derived from the labour obtained by the application of this strength, and it is only those who have had practically the means of comparing it with that of the population of other countries who are aware how far the labouring population of this country is naturally distinguished above others. There is much practical evidence to show that this is not a mere illusion of national vanity, and in proof of this I might adduce the testimony of some of the most eminent employers of large numbers of labourers, whose conclusions are founded on experience in directing labourers from the chief countries in Europe, e.g., Mr. William Lindley, the civil engineer, engaged in the superintendence of the formation of the new railway between Hamburgh and Berlin, found it expedient to import as the foremost labourers for the execution of that work a number of the class of English labourers called navigators. These were recently employed in pile-driving at wages of 5s. per diem, or more than double the amount of wages paid to the German labourers. The German directors were surprised, and remonstrated at the enormously high wages paid to the English labourers; when the engineer directed their attention to the quantity of work performed within a given time, and showed that the wages produced more than amongst the native labourers. English labourers of the same class have been imported to take the foremost labour in the execution of the railways in progress from Havre to Paris, their work at very high wages having been found cheaper than the work even of the Norman labourers. Skill and personal strength are combined in an unusually high degree in this class of workmen, but the most eminent employers of labour agree that it is strength of body, combined with strength of will, that gives steadiness and value to the artisan and common English labourer.”
(Edwin Chadwick, Inquiry into the Sanitary Condition of the Labouring Population …, 1842, pp. 186-187)
Group of Manchester workers 1848
(Earliest photo of English workers)
James Cox, centre of the front row, surrounded by some of the men he worked with. The photograph was taken circa 1848. James Cox came to Manchester from Ireland in 1846 during the famine years. He first lived near Oxford Road Station, Mary Street, an area known as “Little Ireland”. He also worked on the Manchester Ship Canal in the later years of the 19th century. Mr. Cox, although he lived in the worst slum in Manchester, “Little Ireland”, does not appear to be poor or to have suffered hunger!
The workers may appear shorter than average, but this may be due to the fact that they are from Manchester.
XVI. Reading and Writing
Engels wishes us to believe that many people have a very low level of literacy.
“It is true that the manufacturers boast of having enabled the majority to read, but the quality of the reading is appropriate to the source of the instruction as the Children’s Employment Commission proves. According to this report, he who knows his letters can read enough to satisfy the conscience of the manufacturers. And when one reflects upon the confused orthography of the English language which makes reading one of the arts, learned only under long instruction, this ignorance is readily understood. Very few working people write readily; and writing orthographically is beyond the powers even of many “educated” persons [?].” Chapter V, “Results”, p. 74
In fact, of the male workers in English factories in 1833, 86 % could read, and 43 % could write.
(Factories Inquiry Commission: Supplementary Report of the Central Board, Part 1, Ordered by the House of Commons to be Printed, 25 March 1834; p. 42)
The following statement by Engels is in contradiction to the above quote from Engels:
“That, however, the workingmen appreciate solid education when they can get it unmixed with the interested cant of the bourgeoisie, the frequent lectures upon scientific, aesthetic and scientific subjects prove which are delivered especially in the Socialist institutes, and very well attended. I have heard workingmen, whose fustian jackets scarcely held together, speak upon geological, astronomical and other subjects, with more knowledge than most “cultivated” bourgeois in Germany possess.” (Chapter VIII, «Labour Movements», p. 160)
Mr. Zacharias Allen, a visitor from the United States in 1825, was shown round the largest flax mill in the country by the owner, Mr. Marshall:
“The proprietor, Mr. Marshall, showed us the library formed for the use of the workers of the establishment. This library is sustained by a small periodical payment by those who use the books, for the reception of which a room is appropriated. The volumes bear evident marks of having been well thumbed. These mill-libraries, if the term be allowed, are of late established by many of the propietors of large manufactories in England, and are very creditable evidences of their liberality and personal exertions, to render the men who are engaged in their employments both more intelligent and virtuous. For this excellent purpose, numerous mechanic’s libraries have also been established throughout England; ….”
(Zacharias Allen, The Practical Tourist, Or, Sketches of the State of the Useful Arts, and of Society, Scenery,&c. &c, in Great-Britain, France and Holland, 1832, report of visit of 1825, pp. 208-209)
In 1844, a general meeting of the “self-help” organizations in Lancashire was held in the Atheneum, Manchester. The Ancoats Lyceum, situated in one of the poorest areas of Manchester, gave a presentation of their successes in forming a library, and in giving classes.
(Report of the Proceedings Connected with the Grand Soirée of the Manchester Athenæum, Held on Thursday, October 3rd, 1844: From the Manchester Guardian of Saturday, October 5th, 1844, Printed by Cave & Sever, Manchester, 1844; p. 7)
There were Mechanics’ Institutes at Manchester Centre (Cooper Street), Salford, and Lyceums etc. at Chorlton, Salford, Ardwick, and Ancoats.
XVII. Error in the “sob story”
Next we have to examine the well-known “sob story”, about a worker who – due to the changes in the textile factories – is unable to find a job, and whose wife has to work 12 hours a day in the cotton mill.
«In many cases the family is not wholly dissolved by the employment of the wife, but turned upside down. The wife supports the family, the husband sits at home, tends the children, sweeps the room and cooks. This case happens very frequently; in Manchester alone, many hundred such men could be cited, condemned to domestic occupations. It is easy to imagine the wrath aroused among the working-men by this reversal of all relations within the family, while the other social conditions remain unchanged. There lies before me a letter from an English working-man, Robert Pounder, Baron’s Buildings, Woodhouse, Moorside, in Leeds (the bourgeoisie may hunt him up there; I give the exact address for the purpose), written by him to Oastler:
He relates how another working-man, being on tramp, came to St. Helens, in Lancashire, and there looked up an old friend. He found him in a miserable, damp cellar, scarcely furnished; and when my poor friend went in, there sat poor Jack near the fire, and what did he, think you? why he sat and mended his wife’s stockings with the bodkin; and as soon as he saw his old friend at the door-post, he tried to hide them. But Joe, that is my friend’s name, had seen it, and said: “Jack, what the devil art thou doing? Where is the missus? Why, is that thy work?” and poor Jack was ashamed, and said: “No, I know this is not my work, but my poor missus is i’ th’ factory; she has to leave at half-past five and works till eight at night, and then she is so knocked up that she cannot do aught when she gets home, so I have to do everything for her what I can, for I have no work, nor had any for more nor three years, and I shall never have any more work while I live;” and then he wept a big tear. Jack again said: “There is work enough for women folks and childer hereabouts, but none for men; thou mayest sooner find a hundred pound on the road than work for men – but I should never have believed that either thou or any one else would have seen me mending my wife’s stockings, for, it is bad work. But she can hardly stand on her feet; I am afraid she will be laid up, and then I don’t know what is to become of us, for it’s a good bit that she has been the man in the house and I the woman; it is bad work, Joe;” and he cried bitterly, and said, “It has not been always so.” “No,” said Joe; “but when thou hadn’t no work, how hast thou not shifted?” “I’ll tell thee, Joe, as well as I can, but it was bad enough; thou knowest when I got married I had work plenty, and thou knows I was not lazy.” “No, that thou wert not.” “And we had a good furnished house, and Mary need not go to work. I could work for the two of us; but now the world is upside down. Mary has to work and I have to stop at home, mind the childer, sweep and wash, bake and mend; and, when the poor woman comes home at night, she is knocked up. Thou knows, Joe, it’s hard for one that was used different.” “Yes, boy, it is hard.” And then Jack began to cry again, and he wished he had never married, and that he had never been born; but he had never thought, when he wed Mary, that it would come to this. “I have often cried over it,” said Jack. Now when Joe heard this, he told me that he had cursed and damned the factories, and the masters, and the Government, with all the curses that he had learned while he was in the factory from a child.»
(Engels, 1845, pp. 144-146, English translation in E. P. Thompson)
The problem with this story is that St. Helen’s did not have any cotton mills at that date; there had been one from 1810, but it was closed before 1830. Thus the wife in this story could not have been working in a cotton mill. St. Helens did have coal mining, plate glass making, salt mining, copper smelting, chemicals, and brewing. There would have been sufficient possibilities of work for the man. It is not clear why Engels made this mistake.
XVIII. Engels’ Intention and Tactic
What was Engels’ aim in writing the book in this way? To send a “message” to the German industrialists and bourgeoisie:
“I am up to my eyebrows in English newspapers and books upon which I am drawing for my book on the condition of the English proletarians. I expect to finish it by the middle or the end of January, having got through the arrangement of the material, the most arduous part of the work, about a week or a fortnight ago. I shall be presenting the English with a fine bill of indictment [in the German text: “Sündenregister”]; I accuse the English bourgeoisie before the entire world of murder, robbery and other crimes on a massive scale, and I am writing an English preface which I shall have printed separately and sent to English party leaders, men of letters and members of Parliament. That’ll give those fellows something to remember me by. It need hardly be said that my blows, though aimed at the panniers, are meant for the donkey, namely the German bourgeoisie, to whom I make it plain enough that they are as bad as their English counterparts, except that their sweat-shop methods are not as bold, thorough and ingenious.”
The important word is “Sündenregister”, which is literally a “list of sins committed”. In the Middle Ages, it was believed that the Devil was watching you, and that every time that you committed a sin, he would write it down. Today, the central data bank of driving offenses in Germany, situated in Flensburg, is generally known as the “Sündenregister”.
But the fact that you commit some sins does not mean that you are an evil person; the fact that you pass the traffic lights twice does not mean that you deliberately drive without care. Equally the fact that in Manchester in 1844, a considerable number of persons were hungry, lived in horrible conditions, and had very low incomes, does not mean that “…. 350,000 working-people of Manchester and its environs live, almost all of them, in wretched, damp, filthy cottages, that the streets which surround them are usually in the most miserable and filthy condition.”
So what is the procedure behind this method of presenting the facts? Engels is not “playing fair”. He is not being “objective”. He wants to win the argument. This is called by Marx, “Critique by street-fighting” (“Kritik im Handgemenge”).
“The Critique, which addresses this content, is the Critique by street-fighting and in street-fighting the issue is not, whether the opponent is a noble, a worthy, or an interesting opponent, rather the idea is to land the blow on him.”
(Translation by this author)
Deutsch-Französische Jahrbücher, hrsg. von Arnold Ruge und Karl Marx. Paris 1844; Zur Kritik der Hegel’schen Rechts-Philosophie, Karl Marx, p. 74)
Another strange point is that Engels never translated his book to English. There was a German-language edition in Germany in 1845, and a reprint in 1848. The book was translated to English by an American socialist woman in 1885 (Engels asked to see the translation before it was published), and printed in America in 1887, and in the United Kingdom in 1891. He lived for 40 years in England, but did not translate and publish the book. In his first years, he could have used the money! This means that from 1845 no one in Germany could criticize the content, unless they had been to England, and until 1887 no one in England could criticize it, unless they could read German, and had bought the book in Germany. Certainly no one living in England would believe a book that contained the following statement:
“Such are the various working-people’s quarters of Manchester as I had occasion to observe them personally during twenty months. If we briefly formulate the result of our wanderings, we must admit that 350,000 working-people of Manchester and its environs live, almost all of them, in wretched, damp, filthy cottages, that the streets which surround them are usually in the most miserable and filthy condition, laid out without the slightest reference to ventilation, with reference solely to the profit secured by the contractor. In a word, we must confess that in the working-men’s dwellings of Manchester, no cleanliness, no convenience, and consequently no comfortable family life is possible; that in such dwellings only a physically degenerate race, robbed of all humanity, degraded, reduced morally and physically to bestiality, could feel comfortable and at home.”
(Chapter II, The Great Towns, p. 43)
XIX. Contemporary Criticism by German Academics
But we do have two cases of German persons who visited Manchester at that time, and were not in agreement with the general tendency of Engels’ book. According to the definitive German biography of Engels, by Gustav Mayer in 1920, two liberal economists went to England to see how the workers lived.
“….. Victor Aimé Huber, who visited the English textile districts in 1844, and Bruno Hildebrand who in 1846 took notes of their appearance. ….. They accepted that Engels’ presentation “in total” was in agreement with what they themselves had confirmed after repeated inspections and after personal acquaintance with the authentic sources about the condition of the English proletariat, but they objected, that Engels painted everything unconditionally Black and Blackest, that he wrote down the bad characteristics as sharp and shrill as possible, the better characteristics as smudgy and distorted as possible. “The individual data are true, the totality is false”, was the judgement of Hildebrand. Huber deplored that the text was written with bile, in some cases using blood and fire to give the impression of murder and arson. Hildebrand described a so one-sided description of only the dark side of the British industry and the workers’ world as just as untenable, as would be the case if statistics of human health were to be based only on observations in the hospitals.”
(Mayer, 1920, Erster Band, Friedrich Engels in seiner Frühzeit, 1820 bis 1851, pp. 208-209) (Translation by this author)
Apparently, Engels was conscious that there was a risk, if English people were to obtain the book. He wrote in the Prologue of the German edition:
“I am prepared to see not only my standpoint attacked in many quarters but also the facts I have cited, particularly when the book gets into the hands of the English.”
But we do not know if he meant: “the English will attack the book, because it shows how bad their country is”, or: “the English will attack the book, because it is a falsification of the facts”.
Conclusions
As shown above, much of the data presented by Engels is not in concordance with information from contemporaneous sources (official documents, doctors, visitors from other countries, newspaper reporters, guidebooks for visitors).
In some cases, the statement from Engels is exactly not true; in other cases, a bad situation which is suffered by a minority of the population, is presented as if it were valid for the totality of the population.
The probability is that Engels “deviated from the truth” with three intentions:
give the idea that the “masses” in Manchester and other cities, were on the point of rebellion;
“demonstrate” that all the working-class families had a zero net income every week (*), and therefore were at the mercy of the bourgeoisie / factory owners;
make a name for himself in left-wing circles in Germany, as an expert on capitalist societies, such that he could write e. g. the Communist Manifesto [“I have seen the future, and it does not work”].
(*) this is consonant with the curious statement in the Communist Manifesto,
II Proletarians and Communists, p. 23:“The average price of wage-labour is the minimum wage, i.e., that quantum of the means of subsistence which is absolutely requisite to keep the labourer in bare existence as a labourer. What, therefore, the wage-labourer appropriates by means of his labour, merely suffices to prolong and reproduce a bare existence.”
According to Henry Wood’s estimations, the number of domestic hand-loom weavers in Great Britain went down from 240,000 in 1830 to 188,000 in 1835, 123,000 in 1840, and to 69,000 in 1845. We have seen from contemporary evidence that the 1830 employment remained the same until 1834, so that the numbers probably reduced rapidly from 240,000 in 1835 to 69,000 in 1845. This means that the situation that the Committee on Hand-Loom Weavers’ Petitions in 1834-35 was investigating, was one that started to disappear the following year.
Probably a number of the hand-loom weavers went to work in the power-loom mills, since there was now enough demand for workers in the power-looms (a variant was that the man continued at his hand-loom, and his daughter went to work at the power-loom). A few went to work at hand-looms erected in spinning mills. Many more went to work in new cotton mills, as from 1835 to 1838 there was a “boom” in capital investment there. The laying-out of the railways also required more manual work. Very probably, the change in volume from hand-looms to power-looms after 1835, meant that the power-looms were being gradually adjusted in their design, so that that each year they could produce a higher percentage of the “fancy” cloths.
The wages stayed very low for those men who continued to work at the hand-loom, but if the daughter went to work in the power-loom mill, between the two of them they could probably earn 15 to 17 shillings a week, which would have allowed the family to live decently.
From the totality of this chapter, we see that it was not the Industrial Revolution and the improved technology that brought “distress” to the domestic hand-loom weavers. It was two Government decisions; these are not the only cases that we shall meet in this period.