HEIGHTS IN ENGLAND IN THE LATE EIGHTEENTH AND THE NINETEENTH CENTURIES
“It is a capital mistake to theorize before one has data. Insensibly one begins to twist facts to suit theories, instead of theories to suit facts.”
Sherlock Holmes, A Scandal in Bohemia, Arthur Conan Doyle
By far the longest-running difference of opinion about a historical process has been the “Question of the Condition of England”, that is, whether the population of England had an improvement or a deterioration in their living standards in the period of the Industrial Revolution from about 1770 to 1860. The expression “living standards” is taken to include, or more exactly to be the net effect of: wages, food consumption, working conditions, health, mortality, sanitation, and housing. But we cannot calculate the net effect of these factors, because we do not have objective time series of any of these before 1840; particularly this is true of wages and food, for which we have a few figures, but we do not know how to form an average value for all the classes and types of employments.
On the other hand, even if we had these series of numbers for each factor, we would not be able to quantify the net effect of these on the body or on the feelings of the persons. However, we may reasonably suppose that this net effect would be shown by movements in the heights of the people. This is the idea behind “anthropometrics”.
It might appear that there would be a definite effect in this sense, as a certain proportion of people (men, women, children and young children) had physical afflictions, were affected in their growth, did not eat enough, or were weak. On the other hand the people in the industrial districts had a higher income and ate more. The data about movements in heights might well help us to understand what was the effect of the Industrial Revolution.
| The main conclusions of this investigation are: – The average height of men in the period 1780-1820 was from 5 ft. 6.0 in. to 5 ft. 7.0 in., and in 1850-1880 was from 5 ft. 7.0 in. to 5 ft. 8.0 in.; – The men and women in the nineteenth century were not absolutely of low stature, but were of the same height as were adults at the time of the Second World War; – The yearly average heights of Army recruits in Great Britain cannot be used to estimate the heights of the general population, as they moved only as a function of war/peace situations, and of military-administrative decisions; – In the period of 1880 to 1900, there was a “slum class” with a stature of 4 inches less than the normal population, which may have reached 20 % of the city populations, and thus reduced the average height in the country by 0.8 inches. |
The general graph of male heights from 1760 to 1900 is as follows:

The detailed conclusions of this investigation are:
- There was no “stunting” of men due to insufficient food or bad health conditions, but there were cases due to extreme work quantity in some occupations;
- The first information about average heights of the working class (from 1882) states that the factory classes were about 1 ½ inches shorter than the average male, and that this was due to the fact that the machines did all the work, and thus the men had little physical exercise;
- The average for women was from 5 ft. 2 in. to 5 ft. 3 in., also with little annual movement (but we have little data);
- The boys and girls in the factories in the 1830’s were not stunted, but were of the same height as the children who did not work in factories, and the same height as those in Belgium (where there were few factories);
- Skeletons from burial grounds from 1750 to 1850, and measured in archaeological excavations, have an average height per burial ground of 5 ft. 6 ½ in. to 5 ft. 7 ½ in.;
- The average height for male convicts (incl. transportees to Australia) was from 5 ft. 5 in. to 5 ft. 6 in., with a minimum about 1830 to 1840 (birth year); the convicts were from 1 to 2 inches shorter than the general population, because they were typical of the working class;
- The average height for women convicts was from 5 ft. 1 in. to 5 ft. 2 in., with the same minimum;
- The men who went into the Army, were those who had problems of a personal sort, and were generally without hope of employment or food, that is, they were not “volunteers” in the usual sense of the term;
- The Army usually had problems to find enough recruits in each year;
- The average yearly heights of recruits in this period were from 5 ft. 5 in. to 5 ft. 8 in, but these were generally affected by one of: wars (high recruiting volume required, and thus abandonment of minimum height standards), movements in minimum height standards, payments of signing-on bonus, military budgets;
- The average height for the totality of the “recruit-giving class” segment for the period 1800 to 1875 was close to 5 ft. 6 in., without any change over the years;
- Data from the “Floud investigation” showing average heights of 5 ft. 8 in. to 5 ft. 10 in. for the years 1760 to 1800 are misleading and not useful, as they refer only to members of the Artillery, who were taller and stronger than the infantry;
- In the years 1880 to 1899, the Army had great difficulty in finding recruits of the required height and strength, as they were receiving the majority of their recruits from slum areas.
A comparison with present height figures certainly is useful, as it does help to give an idea of the persons we would have seen «walking along the street». But if we wish to evaluate if the men were particularly short, due to their living and nutritional situation, we should use the year e.g. 1950 as a base point, and not 1990 or 2020. It is not the «fault» of the men of the 19th century, that there was a considerable improvement in nutrition and in health in the second half of the 20th century. The heights were/are: 1810 = 5 ft. 6 1/2 in., 1840-1880 = 5 ft. 7 1/2 in., 1950 = 5 ft. 7 in., 1990 = 5 ft. 8 in., 2020 = 5 ft. 9 1/2 in.
The definition of the World Health Organization for «stunting» is more than two standard deviations below the average of the general population at the given age». The only groups which might be in this case, would be the silk weavers in Spitalfields, the nail- and chain-makers in the Black Country, the framework knitters (hosiery) in the Midlands, and the slum dwellers in London and the Northern Industrial towns from the year 1880 onwards. The coal miners were short, but with a muscular torso.
It is important to note, when we are investigating if the bad living conditions in the country left a mark in the bodies of the people, that the Industrial Revolution did not start on a large scale in these terms, before 1800. Manchester had only 90,000 inhabitants, of which 13,000 worked in the cotton mills, and not all lived in bad accommodation. Leeds was still livable, there was little overcrowding; the population started increasing in 1820, and doubled by 1840. In Leeds, there was practically no spinning machinery before 1820. In Bradford, there was no spinning or weaving machinery before 1810, the year in which the first spinning frames were installed in buildings; the population of Bradford in 1811 was 60,000. In Birmingham, all the families lived each in a separate house, and there were no inhabited cellars.
Soldiers’ heights from regimental records, and analysis for anthropometric considerations.
There are academic investigations on the subject, but some of the conclusions have to be handled with care. The academic studies gather information about convicts and soldiers, as these were under the control of the authorities, and thus were long-term data about the heights. The registers of average annual heights taken from European armies give us dependable data for the average heights of the total male population, as practically the whole number of the population was called up each year; thus there was a continuity in the data as to stature which reflected changes in the real world in each country. In Great Britain, the recruits were “volunteers” (more exactly, they were usually unemployed men who needed a job that would give them food, bed, and guaranteed – although low – wages). They were only a small proportion of the population, and thus it is difficult to extrapolate to a figure for the whole population. Further, the number that applied each year, and the average height of these, was affected by the war/peace situation, and the state of the jobs market.
The other complication for the British Army recruits, is that the Army used “minimum height standards” to accept the men, and that these standards were changed from time to time. In Europe, these minima did not change much. Thus it is complicated to calculate consistent yearly average heights for the “recruit-giving class”, that is, the segment of the working class that would be interested in applying for the army, but including those above minimum heights and those below minimum heights, and those physically fit, and those not physically fit. As a final step, the adjusted heights for each year have to be regressed to the data of birth of each recruit, as the theory tells us, that the adult heights are a function of the wage, food, and sanitary conditions in early childhood.
The major study about British soldiers is that of Roderick Floud, Kenneth Wachter, and Annabel Gregory, published in 1990 (“Height, Health and History”), utilising a data base extracted from records of soldiers recruited to the British Army from 1760 to 1870. A great deal of work was expended on the collection and analysis of the registers. However, according to the analysis in the following pages, the yearly averages of statures at recruitment dates are strongly affected by decisions by the military authorities, and cannot be used to reconstruct the conditions at birth date.
The general intentions in using large data sources on soldiers’ heights, are to demonstrate the movements during a period, and investigate if the short periods of low stature correspond to times of hardship at the birth date, and if the long-term figures of heights show an increase or a decrease. The main data base used by the academics, is that of Floud, Wachter and Gregory, taken from the «description books»of soldiers enlisted in the British Army from 1760 to 1870.
The process was a) collect the soldiers by year of enlistment, b) correct the set of heights for truncation, caused by the minimum height standards, c) regress the data per soldier to his birth year, as we suppose that the factors that cause the differences in stature, come from the first years of life, d) calculate the average height of the men for each year of birth.
It is not possible to understand from the exposition in the 1990 book, how the basic recruitment data were transformed into the final numbers presented by the researchers:
- the original real-world data, e.g. the average heights of the recruits per year and per age in the description books, were not exhibited; only the «processed» data after the correction for truncation, and assignation to the birth-year;
- the average heights (after correction for truncation) were not exhibited per year, only per quinquennium or per decade;
- the arithmetical process for truncation was not illustrated in examples;
- there was no informations as to the differential effect of the correction, e.g. how much was the decrement in height, and how many figures of decades did not require the correction;
- it was supposed that all the movements in the average heights were caused by the wages, food consumption, and sanitation and housing conditions in the childhood years of each recruit, and not by military decisions at the recruitment date;
- it was supposed that the only necessary correction was that of compensation for the Minimum Height Standard, and not for peace/war conditions, urgency of recruitment, number of recruits required in the year, or bounty payments.
Unsurprisingly the academic investigations have not given consistent results:
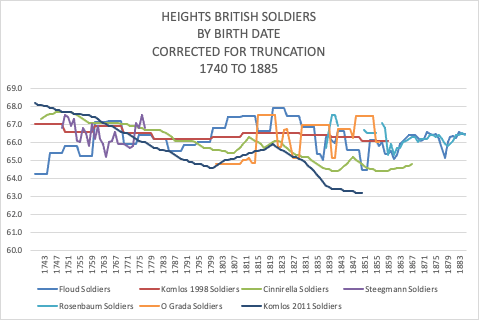
SSTs

| Floud Roderick Floud, Kenneth Wachter, Annabel Gregory; Height, Health and History, Nutritional Status in the United Kingdom, 1750-1980; 1990; Table 4.1, Mean heights of military recruits by age and date of birth, pp. 140-149 (includes Army and Royal Marines) (averages per quinquennium up to 1855) Here: age 22 |
| Komlos 1998 John Komlos; Shrinking in a Growing Economy?, The Mystery of Physical Stature during the Industrial Revolution The Journal of Economic History, Vol. 58, No. 3(Sep. 1998), pp. 779-802; www.jstor.org/stable/2566624 Figure 2, Height of English Soldiers, 20-23 year olds, p. 781. |
| Cinnirella Francesco Cinnirella; Optimists or Pessimists?, a Reconsideration of Nutritional Status in Britain, 1740-1865; European Review of Economic History, December 2008 Figure 7, Average Height Trend in Britain, 1740-1865, p. 339, 18 year olds |
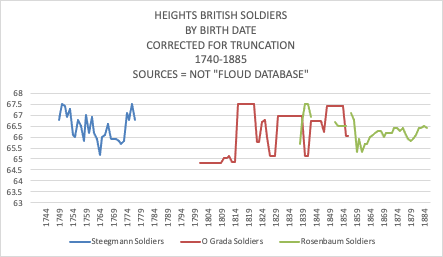
| Steegmann Theodore Steegmann; 18th Century Military Stature: Growth Cessation, Selective Recruiting, Secular Trends, Nutrition at Birth, Cold and Occupation; Human Biology, Vol. 57, No. 1, pp. 77-95 www.jstor.org/stable/41463634 Fig. 2, Mean stature for a cohort of mature men, according to year of birth, English and Irish soldiers of 21 years or older |
| Rosenbaum S. Rosenbaum and J. P. Crowdy; 100 Years of Heights and Weights, Journal of Research, Army Medical Corps, June 1992; www.jstor.org/stable/2982758 Table 1, Heights of Recruits (inches) 1860-1974, Age 20-24 |
| Ó Grada Cormac Ó Grada and Joel Mokyr; Height and Health in the United Kingdom: Evidence from the East India Company Army, Working Papers 199407, School of Economics, University College Dublin, 1994 |
| Komlos 2011 John Komlos and Helmut Küchenhoff; The Diminution of the Physical Stature of the English Male Population in the eighteenth Century; Cliometrica, 2012, 6; pp. 45-62 Fig. 5, Four estimates of the Height of Englishmen by Year of Birth, p. 54 (Average of Army and Royal Marines) |
The “Floud”, “Komlos 1998”, “Cinderella”, and “Komlos 2011” lines all use the “Floud database”; the second and last reports come from the same investigator.
So we have to inspect the original data in the “Floud Database”.
To attempt to understand how the four different graphs were formed out of the “Floud data”, it is necessary to present the original numbers from the collection of the “description books”. The following graph shows the totality of the registers referring to: British Army, not Irish born, not less than 18 years old. Total yearly numbers from the Army Medical Department reports for 1870 to 1894 are added.
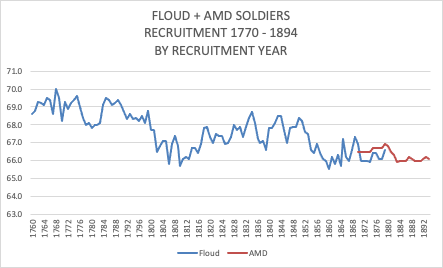
We note average heights from 68 to 70 inches, for the period 1760 to 1799. They are doubtful for the following reasons:
- a decrement of 2 inches in 40 years is considerable;
- a fall of 2 inches from 1799 to 1802, in the heights of the men being enlisted, is not explicable, unless the laws had changed;
- the heights given for the Royal Marines in the Floud data in this period, do not show this extreme movement;
- there is no contemporary report, that the soldiers were extremely tall;
- an investigation of heights of British-born soldiers in the War of American Independence (Komlos), gives 65.5 inches;
- this is not congruent with the minimum height requirement of 64 inches from 1779;
- male convicts had an average height of 66 inches in this period;
- the only contemporary report of heights of a non-army group (Dorset Militia 1798/99) shows 66.5 inches.
Some academics consider that this large difference between “before 1800” and “after 1800”, demonstrates that the English population had sufficient food in the eighteenth century, but insufficient food in the first half of the nineteenth century.
The explanation appears to lie in the selection of the “description books” by Floud’s team.
The “description books” were bound pages, used by the administration of the British Army from 1760 to 1890, containing information – one page per soldier – with physical characteristics including the height at the date of enlistment. The books were the property of each regiment. They are now findable in the National Archives [although many are missing, or were never formulated]. For each decade, Floud’s team took the regiments that had description books for that decade, and took randomly one or some of the books, to transcribe the description to a computer system.
But in the National Archives, for the period 1760 to 1799, the only regiments with description books are those that are part of the Royal Artillery (revised in the “Search” function of the National Archives system, and kindly confirmed by the staff of the National Archives). So Floud’s team used only those description books (in Floud’s datafiles for those years, the column for the identification of the regiment has the value of “WO54”, which is the value in the organization of the National Archives for “Royal Artillery”).
But the root of the problem is that the soldiers in the Royal Artillery were “big guys”. Their job was to dismantle and rebuild the field guns, to transport them over difficult terrain, often without the help of horses, and to insert the shells into the mouth of the cannon. In the nineteenth century, their minimum height was 4 inches above that of the infantry, and the chest minimum was 2 inches above that of the infantry. “No minimum chest measurement was specified before 1860, when a minimum of 33 in. was given except in the case of the recruits for the Artillery whose minimum was fixed as high as 35 in. because the heavy work involved in manhandling pieces of ordnance was considered to require a greater vital capacity” (Lt. Col. Derek Levis, Royal Army Medical Corps, “The Progress in Public Health ….”, 1949, p. 133). “Ordnance Department: Recruits for this branch of the service ought to be powerful athletic men. The duties of the field, and even of the arsenal, are laborious and require great strength.” (Henry Marshall, Deputy Inspector-General of Army Hospitals, On the Enlisting …., 1840, pp. 52-53).
So we may assume that this is the reason that the data from 1760 to 1799 give much higher statures than for the following years.
How much was the difference? For the decades 1800’s and 1840’s, the Floud data files give the regiment key and the height in each case. In the 1800’s decade, the Artillery soldiers had an average height of 67.7 inches, and the non-Artillery had an average height of 66.1 inches. In the 1840’s decade, the Artillery soldiers had an average height of 69.1 inches, and the non-Artillery 67.5 inches. Thus we may suppose a difference of 1.5 inches.
So we recalculate the heights in the datafiles of 1760-1769, 1770-1779, 1780-1789, and 1790-1799, subtracting 1.5 inches from every position. For the datafile of 1800-1809, which has a mixture of Artillery and non-Artillery, we subtract 1.5 inches from only the Artillery positions.
This is the result:

REQUIRE TO EXPLAIN THE CONCEPT OF «TRUNCATION»
REQUIRE TO EXPLAIN THE ADJUSTMENT PROCEDURE
aaaa

We wish to use this information to have the best possible idea of what was the average height of that segment of the population, which decided to enlist as a soldier (or would have decided, if they had complied with the minimum height regulation). The clearest information is that of war years with large requirements for personnel, or with urgent needs for personnel, as in those circumstances the military authorities did not apply the minimum height regulations, and thus the men who were enlisted mirrored the distribution of heights in the totality of the working-class part of the population. Actually, we know that 20 % of the Army in the period 1800-1815 was under the minimum height.
From the graph above, we have the values of 66.0 inches in 1777-1782 (War of American Independence), 66.0 inches in 1791-1812 (Napoleonic Wars), 66.6 inches in 1837-1838 (Revolts in Upper Canada and in Lower Canada), and 66.0 inches in 1858 (end of the Crimean War plus the “Indian Mutiny”. We can suppose that the average in this segment of the population was 66 inches, continuously from 1776 to 1860. Note that this segment of the population was of those persons of the lower working class, who had some individual personal problem, which practically obliged them to join the Army.
The average statures in the period 1760-1775 were high, at 67 to 68 inches, as the minimum height requirement was 66.5 inches.
The period of the Revolts in Upper Canada and in Lower Canada in 1837-1838 illustrates the decrease in average heights of new recruits, when the military authorities urgently needed to increase the numbers of the military forces.
| Year | Recruits (*) | Av. Height (**) | |
| 1834 | 3,700 | 68.7 | |
| 1835 | 6,600 | 68.1 | |
| 1836 | 6,900 | 67.2 | |
| 1837 | 13,300 | 67.0 | |
| 1838 | 22,000 | 67.1 | |
| 1839 | 16,900 | 66.6 | |
| 1840 | 14,800 | 67.8 | |
| 1841 | 16,600 | 67.8 | |
| 1842 | 13,000 | 68.1 |
ttt
(*) not including Artillery
(**) without correction for truncation
The statures in the 1840’s were high, because the authorities decided to recruit only a small number of soldiers, as they did not expect any wars. We know this, because they were taken by surprise by the outbreak of the Crimean War in 1853. There were nominally 70,000 soldiers in Britain, but this included soldiers in movement to and from overseas posting, infirm men, and untrained new recruits. It was with difficulty that 25,000 soldiers were found, who could be transported for action in the Black Sea area. Foreigners were found to fight as mercenaries, in the British German Legion, the British Italian Legion, and the British Swiss Legion (these were 14,000 men in total, but they did not actually engage in the hostilities). It was calculated at the beginning of the War, that 40,000 new recruits would be required. For this reason, the minimum height limits were disregarded, and the average heights of the new recruits decreased rapidly. The War ended in 1856.
This was then followed by the “Indian Mutiny” in 1857-59. This required a further increase in the “Establishment” (authorized total number of soldiers) of the Army. Thus the average heights of new recruits decreased further to 66 inches in 1859.
By an application of «Occam’s Razor», we see that it is not necessary to suppose that the heights of the men at their enlistment, was a function of the living conditions in their first few years of life.
Our first source is of the Dorset Militia Ballot List of 1798-99 (Jaadla et al., 2020). The Militia Ballot Lists collected the names, ages, heights, and family status of all adult males in each county. If the domestic Militia was made active – against a real risk of invasion from France – a ballot would be carried out to decide those men who would be enlisted.
The evidence that has survived in the case of Dorset, gives us all adult males 18 – 45 in half of the parishes. We have 6753 useful observations from 227 parishes; the total population of the county was about 95,000. The men who appear in the list are 3.0 % elite, 4.9 % lower middle class (clerks, merchants, dealers), 38.5 % skilled workers (makers, smiths, weavers), 8.8 % farmers and yeomen, 44.8 % unskilled workers (agricultural and general labourers).
The average height was 66.4 inches (168.7 cm.). The farmers were about 0.8 inch taller than the labourers. There is no reason to doubt that this sample is representative of the whole of England at that time.
(Jaadla, Hannaliis; Shaw-Taylor, Leigh; Davenport, Romola; Height and Health in late eighteenth-century England; Population Studies, A Journal of Demography, published online 29th September 2020)

| Height | 60 | 61 | 62 | 63 | 64 | 65 | 66 | 67 | 68 | 69 | 70 | 71 | 72 | Total | ||
| Per cent | 1.2 | 0.5 | 2.0 | 2.2 | 8.2 | 13.1 | 24.2 | 18.6 | 15.6 | 7.5 | 5.5 | 0.7 | 0.7 | 100.0 |
(The “inch column” for e.g. “64” shows the numbers of 63.5 inches to 64.5 inches)
AVERAGE HEIGHT 66.4 INS. (168.7 CMS.)
We now have some “innocent remarks”, which show that the “normal height” of men outside the manufacturing towns was 5 ft. 7 ins. to 5 ft. 8 ins.
“A recruiting officer testified that operatives were little adapted for military service, looked thin and nervous, and were frequently rejected by the surgeons. In Manchester he could hardly get men of 5 ft. 8 in.; they were usually only 5 ft. 6 in. to 7 in., whereas as in the agricultural districts, most of the recruits were 5 ft. 8 in.”
(Wing, Evils of the Factory System, 1837, p. cii; quoting the First Report of the Factories Inquiry Commission, 1833, Mr. Tufnell’s Evidence, p. 59)
“Their stature low – the average height of four hundred men, measured at different times, and at different places, being five feet six inches.”
(Gaskell, The Manufacturing Population of England, 1833, pp. 161-162)
Serjeant Buchan – Recruiting Serjeant: “The general height of men in this town [Birmingham] is 5 ft. 4 in. to 5 ft. 5 in. …. They are generally shorter than in any town he has known. … The countrymen from the neighbouring districts, are generally taller and stouter.”
(Children’s Employment Commission, Appendix to the Second Report of the Commissioners: Trades and Manufactures, 1843, part 1, p. f 170, interview 495)
In 1844, a Dr. John Hutchinson, who wished to test his new invention, a spirometer (for measuring the strength of the lungs), invited a number of people from different walks of life, to use the object. He registered their height and weight, as well as the measurement of the expulsion of the lungs.
(John Hutchinson, Surgeon, Lecture on Vital Statistics, The Lancet, Vol. 1, No. 19, June 1844, pp. 567-570)
The data as to heights were as follows:
| Classes | less 5 0 | 5 0 | 5 1 | 5 2 | 5 3 | 5 4 | 5 5 | 5 6 | 5 7 | 5 8 | 5 9 | 5 10 | 5 11 | 6 0 more |
| Seamen | 5 | 1 | 7 | 1 | 10 | 9 | 15 | 14 | 15 | 11 | 18 | 12 | 6 | 2 |
| Fire Brigade | 1 | 2 | 20 | 17 | 26 | 20 | 3 | 1 | 2 | |||||
| Metropolitan Police | 4 | 33 | 46 | 22 | 13 | 12 | 11 | |||||||
| Thames Police | 1 | 6 | 9 | 9 | 15 | 17 | 10 | 5 | 3 | |||||
| Paupers | 7 | 3 | 10 | 10 | 21 | 20 | 19 | 10 | 9 | 10 | 1 | 3 | 9 | |
| Mixed Class | 1 | 1 | 5 | 5 | 17 | 16 | 20 | 20 | 28 | 16 | 14 | 7 | 9 | 14 |
| Grenadier Guards | 1 | 1 | 2 | 7 | 22 | 16 | 11 | 1 | ||||||
| Compositors | 3 | 2 | 5 | 6 | 7 | 5 | 8 | 6 | 3 | |||||
| Pressmen | 1 | 2 | 8 | 3 | 7 | 1 | 4 | 2 | ||||||
| Draymen | 1 | 1 | 3 | 4 | 1 | 6 | 4 | |||||||
| Gentlemen | 1 | 1 | 7 | 9 | 14 | 10 | 18 | 16 | 8 | 12 | 5 | 5 | ||
| Pugilists, &c. | 1 | 2 | 1 | 4 | 3 | 3 | 1 | 2 | 3 | 5 | 2 | |||
| Horse Guards (Blue) | 30 | 26 | ||||||||||||
| Total | 14 | 6 | 27 | 22 | 68 | 78 | 118 | 102 | 172 | 164 | 98 | 75 | 82 | 62 |
Average without Horse Guards, 5 ft. 7.3 in., average without Horse Guards, Metropolitan Police, Grenadier Guards, Gentlemen, 5 ft. 6.7 in.
Skeletons
The most objective evidence for the heights in the past, is that of skeletons, as they do not change in length, and are perfectly measurable (more exactly, the length of the femur is taken, and converted by a formula to the height of the person while alive).
We have a number of results from different Burial Grounds in England, from the second half of the eighteenth century and the first half of the nineteenth century.
The average stature for men from each case, ranges between 5 ft. 6 ½ in. to 5 ft. 7 ½ in. (leaving out two higher values from the “upper middle class” and “upper class”); for the women it is from 5 ft. 1 ½ in. to 5 ft. 3 in.
| Church | Place | Period | Context | Social class | Adults number | Males height ins. | Males height cms. | Females height ins. | Females height cms. |
| N | Lancashire | 19th Century | Urban | N | 311 | 66.4 | 168.7 | 62.2 | 158 |
(Excavation 2020-2021, Personal communication)
| Church | Place | Period | Context | Social class | Adults number | Males height ins. | Males height cms. | Females height ins. | Females height cms. |
| Quaker Church, Coach Lane | N. Shields | 1711-1857 | Urban | Low and Middle | 154 | 66.5 | 169 | 61.8 | 157 |
| St. Hilda, Coronation St. | S. Shields | 1816-1855 | Urban | Working Class | 114 | 67.7 | 172 | 62.3 | 159 |
| Chelsea Old Church | London | 1712-1842 | Sub-urban | Higher Class | 165 | 66.1 | 168 | 64.2 | 163 |
| St. Benet Sherehog | City of London | <1853 | Urban | Middle Class | 166 | 66.9 | 170 | 63.0 | 160 |
| Bow Baptist | Outskirts London | 1816-1856 | Sub-Urban | Middle Class | 214 | 66.9 | 170 | 62.2 | 158 |
| Cross Bones | Southwark | 1800-1853 | Urban | Pauper | 44 | 66.7 | 169 | 63.0 | 160 |
(Newman, Sophie Louise; The Growth of a Nation: Child Development in the Industrial Revolution in England, c. AD 1750-1850; Doctoral Thesis, Durham University, 2016; Figure 6.4., p. 246)
| Church | Place | Period | Context | Social class | Adults Number | Males height ins. | Males height cms. | Females height ins. | Females height cms. |
| St. Bride’s, Lower Cemetery | Farringdon Street London | 1770-1849 | Urban | Workhouse and Prison | 125 | 66.5 | 169 | 63.2 | 160.5 |
| St. Pancras Old Church | Camden London | 1793-1854 | Urban | Outside Metropolis, Immigrants Refugees | 448 | 67.3 | 171 | 61.8 | 157 |
| St. Mary-le-bone | West- minster | 1773-1850 | Urban | High Status | 138 | 66.9 | 170 | 62.6 | 159 |
Museum of London > Wellcome Osteological Database > Post-Medieval Cemeteries
| Church | Place | Period | Context | Social class | Adults Number | Males height ins. | Males height cms. | Females height ins. | Females height cms. |
| St. Peter-le-Bailey, Bonn Square | Oxford | 1726-1855 | County town | Poor and paupers | 120 | 67.7 | 172 | 62.2 | 158 |
| St. Luke’s | Islington | 1760-1850 | Suburb London | Upper working class | 533 | 66.9 | 170 | 62.2 | 158 |
| Infirmary | Newcastle | 1745-1845 | County town | Poor working class | N | 67.3 | 171 | 63.0 | 160 |
| St. Bartholo- mew’s | Penn, nr. Wolver-hampton | 1664-1818 | Country town | Upper middle class | 202 | 68.9 | 175 | 63.0 | 160 |
| St. Nicholas | Sevenoaks | 1550-1875 | Country town | Middle class | 116 | 68.1 | 173 | 63.4 | 161 |
| St. George’s (crypt) | Bloomsbury | 1800-1856 | Inner London | Upper middle class | 111 | 67.7 | 172 | 63.0 | 160 |
| Christ Church | Spitalfields | 1729-1852 | Inner London | Masters, weavers, traders | 623 | 66.5 | 169 | 61.4 | 156 |
| Quaker Burial Ground, London Road | Kingston-upon-Thames | 1664-1818 | Country town | Quakers | 295 | 66.5 | 169 | 63.0 | 160 |
(Helen Webb and Andrew Norton, The Medieval and Post-medieval Graveyard of St. Peter-le-Bailey, at Bonn Square, Oxford, Oxoniensia 2009, Oxford Architectural and Historical Society, pp. 137 et seq., Excavation in 2008.
Angela Boyle, Ceridwen Boston, and Annsofie Witken, The Archaeological Experience at St. Luke’s Church, Old Street, Islington, Oxford Archaeology, 2005, Table 5.21.
Other sites taken from this above source, Table 5.21 and pp. 205-7)
John Beddoe was a Fellow of the Royal Society, and President of the Royal Anthropological Institute from 1889 to 1891.
In 1870 carried out a survey of the whole of the United Kingdom, through a system of written questionnaires, which he sent out to a large number of academic contacts and administrative persons in the country. The responses that he reports in his book, refer to all classes of persons, except the rich and the professions, and the destitute and unemployed, and to many types of occupation. But exclusively men! In general from 25 to 49 years old. The total of men documented in the book was 8,583. The number with complete data was 3,498.
They are presented as one line for each reply from a «coordinator» about a group of persons, for example «agricultural labourers in the neighborhood of Hull». Each line may refer to from 10 to 100 men. Returns for «recruits», «lunatics», and «convicts» are given in separate sections.
| Under 5 ft. 6 in. | 5 ft. 6 in. to 5 ft. 7 in. | 5 ft. 7 in. to 5 ft. 8 in. | 5 ft. 8 in. to 5 ft. 9 in. | Above 5 ft. 9 in. | Average | |
| Normal | 14 | 76 | 82 | 47 | 20 | 5 ft. 7.4 in. |
| Criminals | 19 | 10 | 1 | 5 ft. 5.7 in. | ||
| Recruits | 10 | 13 | 5 ft. 7.0 in. | |||
Compilation of data, per report line (here: only England), made by this author.
Some years ago, James Riley was able to access (in the University of Bristol), the original reports which had been received by Dr. Beddoe.
He was able to carry out analyses of the data in different dimensions. The distribution by occupations was as below, showing a larger proportion of working class than in other contemporary estimates (this would mean that Beddoe’s value of the average might have been a little low). We note that the workers in manufacturing are the shortest.
Mr. Riley’s calculation – using Dr. Beddoe’s sample – of the average height in the population of England and Wales in 1870 was 66.9 inches (169.9 cm.).
He also plotted the heights against the ages:

We see that the height practically does not change with age. But we are processing men with an age of 23 to 50 years, in which period the height of the man does not change. This then means that the average of the final heights of men through the period 1841 to 1866 (born 1817 to 1841) did not change.
Report of the Anthropomorphic Committee of the British Association for the Advancement of Science (1879 and 1883)
This was a collection of data from a) the Beddoe survey, b) the investigation of Dr. Roberts about Factory Children (1876), and an own survey. In total, these were about 53,000 individuals of all classes, all ages (including children), and both sexes. The total of adult males of the United Kingdom was 8,585, and the adult males in England only was 6,194.
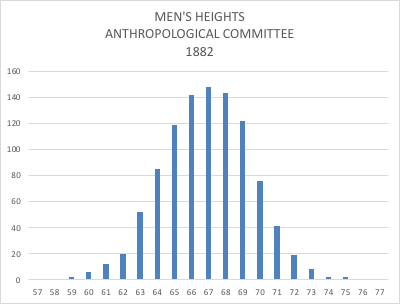
| Heights | 58 | 59 | 60 | 61 | 62 | 63 | 64 | 65 | 66 | 67 | 68 | 69 | 70 | 71 | 72 | 73 | 74 | 75 | |
| Per mille | 1 | 2 | 6 | 12 | 20 | 52 | 85 | 119 | 142 | 148 | 143 | 122 | 76 | 41 | 19 | 8 | 2 | 2 |
AVERAGE HEIGHT = 67.4 INCHES (171.2 CMS.)
There is a table in the report which show the heights of the men in the report, detailed according to the age of the men in approx. 1880. This allows us to say, for example, that the men of age 29, who were born in 1851 and were 20 years old in 1871, had an average height of 67.9 inches in 1871. Thus we may take it as a reasonable assumption, that referring to all the men of 20 years old, who were alive in the country in 1871, they had an average height of 67.9 inches. 20 years was the age at which the men attained their maximum height, which generally they maintained until 60 years old.
So we can suppose that the average height of men of from 20 to 60 years old, was from 67.5 to 68.0 inches in the period 1840 to 1880.
| Age 1880 | 20th Birthyear | Height inches | |
| 20 | 1880 | 67.5 | |
| 21 | 1879 | 67.6 | |
| 22 | 1878 | 67.7 | |
| 23 | 1877 | 67.5 | |
| 24 | 1876 | 67.7 | |
| 25 | 1875 | 67.7 | |
| 26 | 1874 | 67.8 | |
| 27 | 1873 | 67.9 | |
| 28 | 1872 | 67.7 | |
| 29 | 1871 | 67.9 | |
| 30-35 | 1865-1870 | 68.1 | |
| 35-40 | 1860-1865 | 68.0 | |
| 40-50 | 1850-1860 | 68.0 | |
| 50-60 | 1840-1850 | 67.9 |
Table XVI, p. 290, and Table XX, p. 294
There was a considerable differentiation in heights in the different counties of the British Isles:

Anthropomorphic Committee 1882, Map no. 1, Plate I.
We return to the point at the beginning of this document, that the high value for the men’s stature in our days, is due to the increases since the end of the Second World War; these were caused by considerable improvements in medicine and health care (National Health Service), monetary income, and food consumption. The average height of men in the general population was a little more than 5 ft. 7 in. This means that the average height of men in the nineteenth century was the same as that of the men who fought in the Second World War. See the following studies:
W. F. F. Kemsley, “Weight and Height of a Population in 1943”, Annals of Human Genetics, 1950, 27,000 men and 33,000 women; men 20-24 67.0 in. (170.1 cm.); women 20-24 62.4 in. (158.5 cm.)
E. M. B. Clemens and Kathleen Pickett, “Stature and Weight of Men from England and Wales in 1941”, British Journal of Preventive and Social Medicine, 1957, study of 21,300 men measured by medical boards in 1941, previous to call-up; height of men in England 67.1 in. (170.4 cm.)
W. J. Martin “The Physique of Young Adult Males”, Medical Research Council, Memorandum No. 20, H. M. S. O. 1949, report of 91,000 men intended for Air Force 1939; 67.3 in. (170.9 cm.)
The report of the Anthropometric Committee also tells us the average height is clearly affected by the type of occupation, particularly that the factory workers were about 1 ½ inches shorter than the generality of the population.
| Average height, inches, 25-30 years | ||
| Total Population | 67.4 | |
| Class I | Professional Classes | 69.1 |
| Class II | Commercial Classes, Clerks and Shopkeepers | 67.9 |
| Class III | Labouring Classes: Agricultural, Miners, Sailors, Shopkeepers | 67.5 |
| Class IV | Artisanal Classes, living in Towns | 66.6 |
| Class V | Sedentary Occupations: Factory Operatives, Tailors | 65.9 |
This was generally commented at the time (together with the statement that town dwellers were shorter than rural inhabitants), for example:
“I have been informed that of those labourers now employed in the most important manufactories, whether natives or migrants to that town, the sons who are employed at the same work are generally inferior in stature to their parents.”
(Edwin Chadwick, Inquiry into the Sanitary Condition…., 1842, p. 185)
The working people in Manchester (not just the cotton workers) were well known to have a “shrunken” appearance, but this did not mean that they were physically weak.
“Of course the air in which they work exercises a marked effect upon the appearance of the people. This is a subject which I shall treat of at length later; but I may be here permitted to remark upon the more obvious physical characteristics of carders, spinners and weavers. In the first place I do not remember seeing one male or female adult to whom I would apply the epithet of a “stout “ man or woman. There is certainly no superfluity of flesh in the factories. When I say this I do not by any means intend to insinuate that the people are unhealthy or unnaturally lean; they are generally thin and spare but not emaciated. By such occupation as is afforded in the various branches of cotton spinning, much muscle cannot be expected to be developed. There is no demand for it – the toil does not require it – it would be useless if it existed. I cannot therefore term the appearance of the people “robust”. They present no indication of what is called “rude” health. They are spare, and generally – so far as I can judge – rather undersized. At the same time their appearance cannot rightly be called sickly. Their movements are quick and easy, with nothing at all of langour expressed either in face or limbs. The hue of the skin is the least favourable characteristic. It is a tallowy-yellow. The faces which surround you in a factory are, for the most part lively in character, but cadaverous and overspread by a sort of unpleasant greasy pallor. Now and then you observe a girl with some indications of roses in her cheeks, but these cases are clearly the exception to the rule; and amid the older and matronly women not a single exceptional case of the kind did I find. Altogether, the conclusion which a very careful examination of the people led me to was this, that the labour cannot be said to exercise a seriously stunting or withering effect upon those subjected to it – that it does, perhaps, make them actually ill, but that it does prevent the full development of form, and that it does keep under the highest development of health. Men and women appeared to be more or less in a negative sanitary condition. At any rate what is called the “bloom of health” is a flower requiring more air and sunshine than stirs and gleams athwart the rattling spindle.”
(Ginswick, Jules, Labour and the Poor in England and Wales 1849-1851, Letters to the Morning Chronicle from Correspondents, Vol. 1, Lancashire, Cheshire, Yorkshire, pp. 15-16, The Physical Appearance of the Factory Workers)
“It is perfectly true that the Manchester people have a sickly, pallid appearance; but this is certainly not attributable to factory labour, for two reasons: first, because those who do not work in factories are equally are equally pallid and unhealthy-looking, and the sick society returns show that the physical condition of the latter is not inferior:- secondly, because the health of those engaged in country cotton factories, which generally work longer than town ones, is not injured even in appearance … Mr. Wolstenholme, surgeon at Bolton, says that “the health of factory people is much better than their pallid appearance would indicate to any person not intimately with them.””
(Factories Inquiry Commission, Supplementary Report … as to the Employment of Children in Factories, 1834, Part I, Mr. Tufnell’s Report from Lancashire, p. 198)
The question is, how did it happen that the factory workers were shorter (but not to the degree of “stunted”) than the average of the population?
It was not due to insufficient food, because we know that the people in the Northern industrial towns ate a considerable amount of meat. It was not due to excesses in the physical human work required, because – at least from 1830 onwards – the work of pushing, cutting, winding, pulling, etc. was done by the machines, and the human being only had to supervise the work of the machines. It may have been partially due to the sanitary and epidemic problems in the towns.
The main reason was probably the low amount of physical bodily work required in the factories. As it says in the table above: “sedentary”. “The work appeared to us, like most of the labour in a cotton mill, to require very little muscular effort beyond that of standing and walking.» (Bridges and Holmes, 1873, p. 15)
a
Curiously, if the work in the factories had been at a level that the human frame had been used to for the previous 500 years, the average height of the manufacturing workers would have been more, and the male population might have been about ½ inch taller.
Women
The data from above referring to skeletons, give averages per burial ground of from 61.4 to 63.2 inches.
The Anthropometric Committee Report of 1883 gives an average height for women of 62.6 inches, but this is based on only 379 observations.
There was practically no movement in heights until the end of the Second World War. The average height of women in 1943 was 62.4 inches; see Kemsley (1950) above.
Children
We do have more surveys (actual measurement) of the heights of children during the nineteenth century. This is due to the fact that these data were required for the preparation of laws for the protection of the children, or as a basis for permission for individual boys or girls to work, as the laws proscribed the number of hours that could be worked, in terms of the age of the children.
| As we noted at the beginning of this document, the World Health Organization definition of “stunting” is “height more than two standard deviations below the average height for the general population, at the given age”. This would be about three inches below the average in the case of children. The only children or young persons with employment below this level in the nineteenth century, were the nail- and chainmakers in the Black Country. There certainly were very poor children who lived on the streets, who were about this level. There were poor boys in London, who ate very badly, and many were covered in rags, and were cared for by the Maritime Society, to be enrolled in Royal Navy ships. In 1800 they had heights of 51 inches at age 13 (Floud, Wachter, 1982, p. 435). From about 1835, Industrial Schools were founded, which gave bed and food for children collected from the streets, and gave them school education and technical education. The average height of boys in the Industrial Schools in 1882 at 14 years, was 7 inches less than boys of the general population, and 24 lbs. less in weight (Anthropometric Commission, 1882-83, Table XXI, p. 296). |
The first examination of heights of boys and girls was in 1833 in Manchester and Stockton, to check if the children in the cotton factories were particularly shorter than the children in other occupations. In the course of the first attempt to formulate a law for the protection of the children, in 1819, many doctors and professional persons in Lancashire had given evidence that the children were exceedingly overworked, that they were short and weak, that you could recognize a “factory child” at a distance by the stature of his/her body.
To the surprise of later investigators in 1833, the factory children were of exactly the same height as the non-factory children. It appears that the machinery had changed, such that there was less heavy work, and less distance to be walked per day in the workplace. Also the non-factory children would probably not be well fed, as many of them were the sons and daughters of domestic hand-loom weavers, who were at a very low level of incomes.
In any case, the average height of 4 feet for the 9-year olds is very low in our terms of today. The 9-year olds are 48 / 66 = 73 %, and the 11-year olds are 51 / 66 = 77 %, of the height of the father. The 9-year olds are of deficient weight, 51 lbs. against the 61 lbs. of the 11-year olds.

Leonard Ward, “The Effect, as shown by Statistics, of British Statutory Regulations directed to the Improvement of the Hygienic Conditions of Industrial Occupations”, Journal of the Royal Statistical Society, Vol. 68, No. 3 (Sep. 1903), pp. 435-525, https://www.jstor.org/stable/2339590
(Numbers rearranged by Mr. Ward)
Page 461
Mr. Leonard Horner was named Factory Inspector in the District of Lancashire, Cheshire, and Yorkshire in 1836. He did not like what he saw in the factories, as it appeared that the children were too small for the ages at which they were authorized to work. “In going through the factories in different parts of my district I was particularly struck with the diminutive size of many children who were working 12 hours, and, on calling for their certificates I found children certified to have the “ordinary strength and appearance” of 13 years of age who were manifestly to the most common observation, not more than 10 or 11. It was evident that has been either the most culpable negligence on the part of the surgeons, or that fraud had been very extensively practiced upon them under a false name, in order to obtain a certificate which was to be made use of by a younger child.” (Circular Letter to Surgeons, 20thSeptember 1836). What was happening, was that the parents wanted/needed the income from the child, who legally could not work under those circumstances, and so they gave false information.
Mr. Horner decided that he needed assured evidence as to the general range of heights for each age, so as to be able to define limits in terms of the height. He sent a circular letter to a number of doctors in his district, requiring them to collect a number of children in the mills, of whom there was no doubt as to their ages, and to report their heights. There were 72 doctors, who measured and reported on 16,400 boys and girls, in factory employment.
The results were as follows:
| Years of Age | Number Males | Average Height | Number females | Average height | ||
| Ft. in. | Ft. in. | |||||
| From 8 and under 9 | 666 | 3 10.2 | 539 | 3 9.5 | ||
| From 9 and under 10 | 945 | 3 11.6 | 813 | 3 11.8 | ||
| From 10 and under 11 | 1124 | 4 1.3 | 927 | 4 1.2 | ||
| From 11 and under 12 | 1223 | 4 2.8 | 1055 | 4 2.7 | ||
| From 12 and under 13 | 1427 | 4 3.7 | 1330 | 4 4.1 | ||
| From 13 and under 14 | 2133 | 4 5.7 | 2240 | 4 5.8 | ||
| From 14 and under 15 | 117 | 4 8.2 | 140 | 4 9.0 | ||
| From 15 and under 16 | 82 | 4 10.5 | 106 | 4 10.7 | ||
| From 16 and under 17 | 43 | 5 0.5 | 90 | 4 11.5 | ||
| From 17 and under 18 | 47 | 5 0.0 | 112 | 5 0.0 |
(The age data were given in the publication, in divisions of half-years; the heights were given to the nearest eighth-inch)
Charles Knight (ed.), “Practical Application of Physiological Facts”, The Penny Magazine of the Society for the Diffusion of Useful Knowledge, Volume 6, 1837, pp. 270-272.
The heights in the two cases are very similar. But they do seem low to us at the present time. The question is: are these low statures a) those that had existed for (e.g.) the previous 50 years, or b) are they lower than they had been previously, due to the introduction to factory work?
We can compare these figures with those of the Belgian scientist, M. Quetelet, which he collected in Belgium in 1832 (see “A Treatise on Man and the Development ofhis Faculties”, English edition, 1835, p. 64). An inspection of the information as to Belgium gives: boy of 9 years 122.7 cm. (48.3 in.), boy of 11 years 132.7 cm. (52.2 in.), girl of 9 years 122.0 cm. (48.0 in.), girl of 11 years 127.5 (50.2 in.). The weights are: 24.1 kg. (53.1 lb.). 27.8 kg. (61.4 lb.), 22.4 kg. (49.5 lb.), 26.2 kg. (57.9 lb.). These figures – which are for the general child population of Belgium – are very close to those in the factories of the North of England. And Belgium at this time had very few factories. So we may suppose that these heights and weights were “normal” for the time.
The average height of men in Belgium was, according to M. Quetelet, at 30 years old, 168.4 cm. (66.3 in.), and of the women was 157.9 cm. (62.2 in.).
Dr. Bridges and Mr. Holmes were requested by the Local Government Board in 1873, to inspect the textile factories in all England, to give an opinion, if the hours of work should be reduced, and the ages of children authorized to work should be increased.
About 10,000 children were measured, and the results were as follows:
Table A: Factory Children of Factory Parents (Urban and Suburban)
| Age | Boys | Girls | ||||
| No. | Inches | No. | Inches | |||
| 8 | 30 | 45.7 | 30 | 46.5 | ||
| 9 | 80 | 48.0 | 110 | 47.6 | ||
| 10 | 140 | 49.8 | 130 | 49.5 | ||
| 11 | 130 | 51.4 | 120 | 50.8 | ||
| 12 | 120 | 52.8 | 140 | 53.1 |
Table B: Children in Non-factory Districts (Urban and Rural)
| Age | Boys | Girls | ||||
| No. | Inches | No. | Inches | |||
| 8 | 140 | 46.7 | 100 | 46.7 | ||
| 9 | 230 | 49.2 | 160 | 48.6 | ||
| 10 | 240 | 51.0 | 140 | 50.1 | ||
| 11 | 180 | 52.9 | 140 | 52.7 | ||
| 12 | 150 | 54.0 | 90 | 54.4 |
Table C: Non-factory Children of Non-factory Parents in Factory Districts (Urban and Suburban)
| Age | Boys | Girls | ||||
| No. | Inches | No. | Inches | |||
| 8 | 20 | 46.7 | 20 | 47.4 | ||
| 9 | 60 | 49.1 | 30 | 49.4 | ||
| 10 | 50 | 51.0 | 30 | 49.8 | ||
| 11 | 30 | 52.6 | 30 | 52.8 | ||
| 12 | 20 | 53.6 | 17 | 53.4 |
Table D: Urban Factory Children (Irrespective of Parentage)
| Age | Boys | Girls | ||||
| No. | Inches | No. | Inches | |||
| 8 | 109 | 46.8 | 89 | 46.5 | ||
| 9 | 235 | 48.3 | 269 | 47.9 | ||
| 10 | 361 | 49.6 | 314 | 50.0 | ||
| 11 | 284 | 51.4 | 292 | 51.6 | ||
| 12 | 316 | 52.6 | 312 | 52.7 |
Table E: Suburban Factory Children (Irrespective of Parentage)
| Age | Boys | Girls | ||||
| No. | Inches | No. | Inches | |||
| 8 | 131 | 47.1 | 95 | 46.3 | ||
| 9 | 279 | 48.3 | 216 | 48.1 | ||
| 10 | 282 | 50.4 | 279 | 49.8 | ||
| 11 | 302 | 51.8 | 275 | 51.7 | ||
| 12 | 264 | 53.2 | 266 | 53.3 |
As is to be expected, the non-factory children are taller than the factory children.
“He was perfectly satisfied from close observation during the last ten years, in a situation which gave him the best opportunities of judging, that the children of the mill population were steadily, year by year, getting smaller and physically less capable of doing their work. If they asked him how that was he would tell them. In the first place, it was owing to a great extent to the intemperate habits of the parents transmitting feeble constitutions to the children; and in the next, to the mistaken manner in which the mill people feed their children. They brought them up on tea and coffee, instead of upon more substantial food. As an example: During the last month in the Great Bolton district, he had had to reject as many as 19 children simply because they had not the strength and development required by the Factory Act, and these numbers were steadily year by year increasing. Another evil he had noticed was that many young children of 12 years of age or thereabouts were beginning to learn to smoke, acquiring the habit from their fathers, and possibly from their mothers also. This was a condition of things which, in his mind, excited painful considerations. What was to become of the factory population if this physical degeneration went on?”
(Mr. Alderman Ferguson, Bolton, was also a Certifying Surgeon under the Acts; Bridges and Holmes, pp. 41-42)
The authors expressed themselves forcibly, that the absence of mothers in the mill, was the cause of the high death-rate of the small children.
Dr. Charles Roberts made a similar report in 1876, on one thousand boys and girls of each age; the principal information is:
Charles Roberts, The Physical Requirements of Factory Children, 1876
| Age | Average Height Boys | Average Height Girls | ||
| 8 | 46.9 | 46.5 | ||
| 9 | 49.0 | 48.4 | ||
| 10 | 50.6 | 49.9 | ||
| 11 | 52.1 | 51.7 | ||
| 12 | 53.8 | 53.2 | ||
| 13 | 55.0 |
“Physical Improvement or Degeneracy of the Population
Few statistics are in existence which help to throw light on this subject. It is generally believed that the population in the manufacturing towns of the North of England is rapidly degenerating, but a comparison of the measurements of stature and weight given in the Report of the Factory Commissioners in 1833, and in the Report to the Local Government Board on “Changes in Hours and Ages of Employment of Children and Young Persons in Textile Factories”, 1873, shows that this is not the case. On the contrary, an examination of Table XXIV, showing these measurements, indicates a slight but uniform increase in stature, and a very large increase in weight, at corresponding ages. The increase in weight amounts to a whole year’s gain, and a child of 9 years of age in 1873 weighed as much as one of 10 years in 1833, one of 10 years as much as one of 11, and one of 11 as much as one of 12 years in the two periods respectively.”
(Anthropometric Committee, 1882/83, p. 298)
STATURE
| Boys | Boys | Girls | Girls | |||||||||||
| 1833 | 1873 | 1833 | 1873 | |||||||||||
| Age | No. | Inches | No. | Inches | Dif. | No. | Inches | No. | Inches | Dif. | ||||
| 9 | 17 | 48.1 | 126 | 48.3 | +0.2 | 30 | 48.0 | 114 | 48.3 | +0.3 | ||||
| 10 | 48 | 49.8 | 256 | 49.8 | 0.0 | 41 | 49.6 | 201 | 50.3 | +0.7 | ||||
| 11 | 53 | 51.3 | 196 | 51.6 | +0.3 | 51 | 51.1 | 174 | 51.2 | +0.1 | ||||
| 12 | 53 | 53.3 | 175 | 53.3 | 0.0 | 80 | 53.7 |
WEIGHT
| Boys | Boys | Girls | Girls | |||||||||||
| 1833 | 1873 | 1833 | 1873 | |||||||||||
| Age | No. | Lbs. | No. | Lbs. | Dif. | No. | Lbs. | No. | Lbs. | Dif. | ||||
| 9 | 17 | 51.8 | 136 | 58.1 | +6.3 | 30 | 51.3 | 137 | 55.9 | +4.6 | ||||
| 10 | 48 | 57.0 | 247 | 60.2 | +3.2 | 41 | 54.8 | 179 | 60.6 | +5.8 | ||||
| 11 | 53 | 61.8 | 189 | 67.7 | +5.9 | 63 | 59.7 | 180 | 65.4 | +5.7 | ||||
| 12 | 42 | 66.0 | 167 | 69.8 | +3.8 | 80 | 66.1 |
Table XXIV – Showing the average Stature and Weight of Factory Children at an interval of 40 years, 1833-1873 (Stanway and Roberts). (But actually it is Stanway and Bridges/Holmes)
| Boys | Boys | Girls | Girls | |||||||||||
| 1833 | 1873 | 1833 | 1873 | |||||||||||
| Age | No. | Inches | No. | Inches | Dif. | No. | Inches | No. | Inches | Dif. | ||||
| 9 | 41 | 48.6 | 60 | 49.1 | +0.5 | 43 | 48.4 | 30 | 49.4 | +1.0 | ||||
| 10 | 28 | 50.6 | 50 | 51.0 | +0.4 | 38 | 49.4 | 30 | 49.8 | +0.4 | ||||
| 11 | 25 | 51.0 | 30 | 52.6 | +1.6 | 29 | 52.1 | 30 | 52.8 | +0.7 | ||||
| 12 | 20 | 53.0 | 20 | 53.6 | +0.6 | 27 | 53.7 | 17 | 53.4 | -0.3 |
| Boys | Boys | Girls | Girls | |||||||||||
| 1833 | 1873 | 1833 | 1873 | |||||||||||
| Age | No. | Lbs. | No. | Lbs. | Dif. | No. | Lbs. | No. | Lbs. | Dif. | ||||
| 9 | 41 | 53.3 | 60 | 59.4 | +6.1 | 43 | 50.4 | 30 | 57.8 | +7.4 | ||||
| 10 | 28 | 60.3 | 50 | 63.8 | +3.5 | 38 | 54.4 | 30 | 60.8 | +6.4 | ||||
| 11 | 25 | 58.4 | 30 | 70.2 | +11.8 | 29 | 61.1 | 30 | 69.0 | +7.9 | ||||
| 12 | 20 | 67.2 | 20 | 70.9 | +3.7 | 27 | 66.1 | 17 | 70.5 | +4.4 |
This shows that apparently the natural increase in the general child population from 1833 was 1873 was visible, but that there was a negative effect on the factory children.
The heights and weights of children of 11 years old showed the following progression during the century:
| Date | Segment | Place | Investigator | Boys 11 yrs. Height ins. | Weight lbs. | Girls11 yrs. Height ins. | Weight lbs. |
| 1833 | Factory and non-Factory Children | Manchester and Stockport | Stanway, Cowell | 51.2 | 60.7 | 51.5 | 60.2 |
| 1836 | Factory Children | Lancashire, Cheshire, West Riding | Horner | 50.8 | 50.7 | ||
| 1836 | Factory Children | Leeds | Baker | 50 | 50 ¼ | ||
| 1836 | Factory Children | Preston | Harrison | 50 ½ | 51 ¼ | ||
| 1876 | Factory Districts | Lancashire, Cheshire, West Riding | Roberts | 51.2 | 68.1 | 51.8 | 66.2 |
| 1878-82 | Labouring Classes | Country | Anthrop. Committee | 52.3 | 72.2 | 52.5 | 67.1 |
| 1878-82 | Artisan Families | Towns | Anthrop. Committee | 52.7 | 69.0 | 51.5 | 66.8 |
Extracted from:
M. N. Karn, Summary of Results of Investigations into the Height and Weight of Children of the British Working Classes during the last Hundred Years (1936)
The boys showed – similarly to the adult men – a considerable differentiation in stature in function of the social / economic level.
| Average height, inches,11-12 years | ||
| All Observations | 52.6 | |
| Public Schools | Country | 55.0 |
| Middle-class Schools | Upper Towns | 53.8 |
| Middle-class Schools | Lower Towns | 53.7 |
| Elementary Schools | Agricultural labourers Country | 53.0 |
| Elementary Schools | ArtisansTowns | 52.6 |
| Elementary Schools | Factories and Workshops Country | 52.2 |
| Elementary Schools | Factories and Workshops Towns | 51.6 |
| Military Asylums | 51.2 | |
| Industrial Schools | 50.0 |
Anthropomorphic Committee, 1882-1883, Table XIII: Table showing the Relative Statures of Boys of the age of 11 to 12 years, under different physical and social conditions of life.
Convicts
The above pieces of information about the heights of men, women, and children from the general population only refer to a few individual dates. This is because there was no continuous measurement of a group, year by year. So we cannot show a graph of heights per year, and cannot demonstrate a possible connection between average heights and the standard of living (income, food, sanitation) in some short periods.
There were two segments of the population, who were under the control of the authorities, and whose height was measured, when they came to the notice of the authorities. These were the convicts (those who were transported, and those who were incarcerated in the United Kingdom), and the enlisted soldiers.
In these cases, as we have figures of heights for the average of the segment at a given date (incarceration; enlistment), we can classify the heights by birth yearof the individual person, and then calculate an average height for all of the persons of the resultant year.
The absolute figures of the average heights of the convicts and of the soldiers are not the same as those of the general population, they are generally from 1 to 2 inches less. But we may assume that the movements in each of the segments “mirror” the movements for the general population (if we had them).
The idea behind this arithmetical process is that the external factors (economics, food, sanitation, epidemics) which could affect the final height of a person, would have occurred with respect to the person in the period from 0 to 15 years old. So hopefully we can identify changes in the external factors, through the movements in the average heights. This is the fundamental premise of “Anthropomorphic History”; see Bernard Harris, Anthropometric History and the Measurement of Wellbeing, Vienna Yearbook of Population Research, 19 (2021).
This analysis is all the more important for studies of the period 1770 to 1840, as we have no continuous yearly series of data about incomes or about food consumption per person, based on contemporary documentation.
The data for the convicts are from the records of the administration of the shipping of the convicts to Australia, from the records of the prison services, and from publications of the police. These data have been incorporated into an interconnected data base “The Digital Panopticon”, digitalpanopticon.org, constructed in the last twenty years by a group led by Barry Godfrey, Robert Shoemaker, Tim Hitchcock, Deborah Oxley and Hamish Maxwell Stewart. The academic investigations commented below have been made by researchers using the original registers of the authorities, or the Digital Panopticon.
The series of heights from the different researchers for the period in question, are as follows. We see that there is little movement from year to year, except that there is a small decrement around the birth years 1830 to 1850.

Nicholas Convicts M:
Stephen Nicholas and Richard H. Steckel; Heights and Living Standards of English Workers during the Early Years of Industrialization, 1770-1815; The Journal of Economic History, Vol. 51, No. 4 (Dec. 1991), pp. 937-957, p. 948, figure 3.
http://www.jstor.org/stable/2123399
Weber Convicts M:
Jacob P. Weber; Patterns in British Height, 1770-1845; Term Paper, 2018, Berkeley; Figure 5, Long-term height trends, men and women, age 20-70, 5-year centered average; p. 5
https://delong.typepad.com/jacob-p.-weber-heightpaperfinal-x.pdf
Johnson Convicts M:
Paul Johnson and Stephen Nicholas, 1992; Health and Welfare of Women in the United Kingdom, 1785-1920; In: Richard H. Steckel and Roderick Floud, Health and Welfare during Industrialization, 1997; Fig. 6.11. Rural and urban male and female criminal heights, ages 19-49, p. 222; Source: Alphabetical Register of Habitual Criminals
http://www.nber.org/chapters/c7432
Panopticon Convicts M:
Extracted from the Digital Panopticon, by the present author, men ages 20-49.
Weber Convicts F:
Weber, Jacob P., 2018, op. cit.
Johnson Convicts F:
Johnson and Nicholas, 1992, op. cit.
Panopticon Convicts F:
Extracted from the Digital Panopticon, by the present author, women ages 20-49.
The convicts were about two inches shorter than the general population.
“An impression is often prevalent that the criminal population consists of persons of the greatest physical strength; but speaking from observation of the adult prisoners from the towns and convicts in the hulks, they are in general below the average standard of height.”
(Edwin Chadwick, Inquiry into the Sanitary Condition of the Labouring Population…, 1842, p. 202)
The men and women in the criminal registers came predominantly from London and the northern industrial towns.
| Place of birth Men 1830 | Place of birth Women 1830 | Place of birth Men 1860 | Place of birth Women 1860 | |||||||
| Total England | 327 | Total England | 116 | Total England | 1,005 | Total England | 167 | |||
| London | 100 | London | 24 | London | 386 | London | 35 | |||
| Manchester | 24 | Manchester | 10 | Manchester | 74 | Manchester | 25 | |||
| Liverpool | 30 | Liverpool | 8 | Liverpool | 56 | Liverpool | 21 | |||
| Leeds | 8 | Leeds | 1 | Leeds | 31 | Leeds | 6 | |||
| Birmingham | 21 | Birmingham | 11 | Birmingham | 66 | Birmingham | 4 | |||
| Sheffield | 1 | Sheffield | 3 | Sheffield | 21 | Sheffield | 10 | |||
| Bristol | 7 | Bristol | 4 | Bristol | 25 | Bristol | 1 | |||
| Newcastle | 8 | Newcastle | 2 | Newcastle | 13 | Newcastle | 1 | |||
| Nottingham | 7 | Nottingham | 2 | Nottingham | 29 | Nottingham | 5 | |||
| Other | 121 | Other | 51 | Other | 304 | Other | 59 |
We can say from the occupations given, that they work in industry. This would explain why they were shorter than the general population, because they came from factory occupations, and the factory workers were about 1 ½ inches shorter than the average of the country.
| Average height,inches, 25-30 years | ||
| Total Population | 67.4 | |
| Class I | Professional Classes | 69.1 |
| Class II | Commercial Classes, Clerks and Shopkeepers | 67.9 |
| Class III | Labouring Classes: Agricultural, Miners, Sailors, Shopkeepers | 67.5 |
| Class IV | Artisanal Classes, living in Towns | 66.6 |
| Class V | Sedentary Occupations: Factory Operatives, Tailors | 65.9 |
Report of the Anthropometric Committee, 1882-83
For the years 1834 to 1845, in England and Wales, there were about 25,000 offenses per year, of which about 20,000 were “offenses against property, committed without violence”.
(Porter, Progress of the Nation, 1847, p. 652)
About 75 % of the criminals in the given period were of ages from 16 to 40.
(Porter, op. cit., p. 655)
The percentages of literacy were:
| Males | Females | ||
| Neither read nor write | 32 | 37 | |
| Read only; or read and write imperfectly | 55 | 57 | |
| Read and write well | 9 | 4 | |
| Superior instruction | 1 | 0 | |
| Instruction not ascertained | 3 | 2 |
These are considerably less than the percentages for factory workers at that time.
The Rev. John Clay, chaplain of the prison at Preston, interviewed 1000 new prisoners from 1832 to 1837, asking them the reasons why they committed the crime; the results were:
Drunkenness (455), Want and Distress (76), Temptation (48), Neglect of Parents (6), Combination (11), Weak Intellects (8), Idleness and bad Company (88), Idleness and Ignorance (18), Confirmed bad Habits (38), Alleged Innocence; and various or uncertain Causes (252).
The major types of crime committed, changed from the first half to the second half of the 19thcentury:
Trials at the Old Bailey
| Percentage 1835–1854 | Percentage 1855–1913 | |
| Simple larceny | 35.2 | 11.7 |
| Stealing fromone’s master | 14.7 | 4.6 |
| Coining | 5.2 | 11.7 |
| Burglary | 3.1 | 9.7 |
| Fraud | 2.4 | 10.3 |
Vickers, Ziebarth, 2016, p. 200
The persons committed to prison or to transportation were members of the lower class of workers, and were generally from London and the northern industrial towns. They would not have been of the same height of the generality of the population, but it is reasonable to suppose that their heights would have moved “in step” with those of the average of the population.
SOLDIERS
In reference to the question of whether the soldiers were representative of the general male population, as to their heights, the answer is a qualified «Yes»:
- no one went to enter the army because it was a good option;
- the men who presented themselves, all had some sort of problem, either personal or financial; many were unemployed at the moment of recruitment (especially the case from 1870 onwards);
- the army solved their problems, because it gave them, wages, food and a bed, guaranteed for years;
- the occupations were 60 % labourers, 15 % manufacturing artisans, 18 % carpenters, smiths, weavers, etc. (but very few factory workers).
The main difficulty in using the data of the heights of these men during the whole of the period, is that there was a differentiation in the army recruitment policies, in times of war and in times of peace. In peacetime, the army could be stringent about the minimum height standard, because they did not need many additional soldiers; in wartime, they took everyone, and thus in this case, the heights of the recruits corresponded closely to the profile of the general population.
This means that in the war years the histogram of heights was that of the standard distribution curve. In years of peace the distribution curve was missing a part or the whole of the “left wing”, and so the average height of the men effectively recruited was higher than the average height of the segment of men who wished to enter the army. The different procedures for correcting this have caused grave contradictions between the different investigations.
In the Annex we can see a simple form of calculation to approximate the real average for the underlying segment. This calculates an adjustment in each decade. Six of fifteen decades have perfect histograms and thus do not need any adjustment. The maximum adjustment calculated for a decade is minus 1.3 inches.
The average heights at recruitment date are from 5 ft. 6 ins. to 5 ft. 7 1/2 ins. These would be a little less than the average of the men “walking along the street”, because about 50 % of the recruits entered at 18 to 22 years old, and they would still be about one inch shorter than at the average age of the population.
The men who went to the Recruiting Office (or to the public house, where the Recruiting Sergeants were generally stationed!), went because they had problems, and the army could solve them:
«Class of the population from which recruits are procured:
Agricultural labourers generally enter the army in consequence of some family difficulty or discord, or some scrape in which they are involved, or from want of work; and it is alleged by competent authority that they become the most trustworthy soldiers. Recruits who are enlisted in the manufacturing districts or the large towns are frequently idle and dissolute, and require all the means in the power of their officers to correct the intemperate and vicious habits in which they have indulged, and to enforce subordination.»
“The condition of a soldier is very little calculated to induce an industrious man, who can obtain subsistence in other way, to embrace it; consequently, those who enter the service are commonly thoughtless youths, petty delinquents, men of indolent habits, persons who are unable to procure work, or are in very indigent circumstances……. Experience holds out no hope, that, under existing circumstances, any but the worst educated, and certainly not the best conducted, of the manual labour rank of the population, will deliberately make choice of a military profession.”
(Marshall, p. 8)
“On looking into the matter, very serious doubts arose whether any one ever enlisted into the Army for the purpose of making it a regular profession for life. He found that there were some classes of their recruits who had readily gone into the ranks, not with any view to the future, but rather with a view of escaping present distress. Their ranks were very much recruited by the idle and the dissolute, who thought that in the life of a soldier they would find that idleness and dissipation congenial to their dispositions. It was too often the case, that the prodigal sought in the Army a refuge from his improvidence; and lads who had got into disgrace, immediately had recourse to enlistment in order in order to avoid their masters. With that class voluntary enlistment was at an end.”
(Mr. Fox Maule, M. P., The Army Service Bill, Hansard, House of Commons, 22 March 1847, vol. 91, p. 273)
“In 1859, the Adjutant-General of the Army told a Royal Commission on Recruiting that there were “very few men who enlisted for the love of being a soldier: it is a very rare exception”. Seven years later his successor told another Royal Commission: “I am afraid it is drink and being hard up which leads a great many to enlist”. Recruiting Sergeant William Knibbs of the 17th Lancers found that of the many hundreds of recruits he had enlisted between 1851 and 1859, “not one in fifty has money in his pocket when he comes to us – and then I must ask him, “have you a bed to go to?” “No.” “Well, I will find you a bed.” Sometimes I must find him his food.”
(Marquess of Anglesey, 1975, p. 260)
So we see that the Army was not really a part of the labour market, but in fact a form of social support for the unemployed / unemployable. Rather like the workhouse.
It was usually understood, that a new recruit would put on about 7 pounds weight in the first six months, due to the food and the exercise. This means that the Body Mass Index, if calculated with the initial weight, has to be adjusted in each case.
The disadvantages of life in the army were: the long contract term (up to 1835, 21 years; afterwards, 12 years); for those who were stationed in India this would be a long time without seeing their family; possibility of death in battle; possibility of death from disease in the Tropics; military discipline.
The advantages of life in the army, for this class of men, were: food (3/4 pound of meat and one pound of bread per day), bed, clothing (uniform), wages of one shilling a day, medical care, comradeship.
The health of recruits (i.e. those effectively accepted) was in general bad. The investigation of Mitchell (2006) analyzes a document of the Household Cavalry Museum: “Royal Horse Guards Vaccinations and Inspection of Recruits 1817-1851”.
The Household Cavalry in general had a good level of recruits, who had to be above 5 ft. 11 ins., and usually came from the artisan and skilled labour class. But the men who presented themselves were usually thin. For example, the instruction was that a man of 20 years old, had to weigh over 132 lbs. to be accepted. Many of the accepted recruits were described as “malnourished”, “emaciated”, or “of a feeble constitution.»
For a visual idea of the soldiers in the 1840’s, see YouTube “Earliest photographs of British soldiers from the 1840’s”:
a

A sergeant reading the Order of the Day to soldiers of the 42nd (Highland) Regiment of Foot, Edinburgh Castle, April 9th, 1846. Hill and Adamson.
aAnd from the 1850’s, photos of the Crimean War:

aThe 3rd (East Kent) Regiment (The Buffs) in the Crimea, 1855.
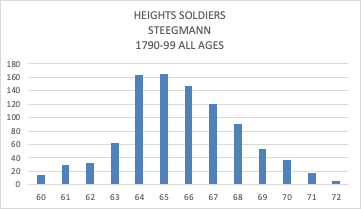
The first investigation of heights is from Steegmann (1985). It is an analysis of the registers of the 54th (West Norfolk) Regiment from 1762 to 1799. The information given in the paper is by birth-year, and the soldiers were born in 1749 to 1778. The data include English and Irish men, but the average height was the same for the two nationalities. Of 1100 soldiers, 950 are from the period 1790-1799. The majority had been agricultural labourers.
Mature stature for men recruited in 1762-1775 was 169.9 cm (5 ft. 6.9 ins.), for those recruited in 1776-1782 it was 169.5 cm. (5 ft. 6.7 ins.), in 1783-1789 it was 172.6 cm. (5 ft. 7.9 in.), and in 1790-1799 it was 167.5 cm. (5 ft. 5.9 ins.). The average heights at enlistment were less in war-time years (we suppose the military authorities were less «choosy»). The most frequent ages at enlistment were 18, 19 and 20 years, 40 % of the total, and their height was around 167.7 cm. (5 ft. 6.0 ins.)
Movements in adult height appear to reflect the food situation at the respective birth dates.
The following two graphs show the distribution of heights in the period 1790 to 1799 (wartime); first the totality of recruits, and below, the men of over 21 years. We note that the graph below is a complete distribution curve.

The next information is the British Soldier Compendium (constructed by Edward Coss from data in the National Archives), referring to 7,300 of the British Soldiers in Spain under Wellington. The soldiers who enlisted in the Napoleonic Wars were about 300,000 at any one time, so we can take these as representative of the general population (i.e. they were not a specific segment). The Army authorities during the war needed to have a maximum number of soldiers, so they did not impose any “minimum height standards” at that time. Thus we see that the distribution is a well-formed “bell curve”, i.e. there is no “truncation” of the left tail, which would be visible if there were effectively minimum height standards.
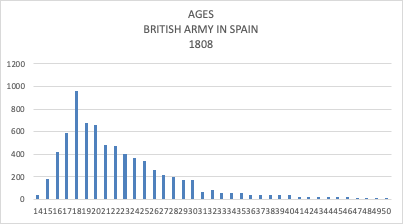
Coss, Figure 1, Age distribution of all enlistees

a
For the period 1860 to 1880, the average height of the recruits was continuously close to 66 inches. This is corroborated by the fact that the authorities had to reduce the minimum height limit from 65 inches in 1872 to 64 inches in 1880 and to 63 inches in 1883, because they were not able to find enough recruits of the requisite heights.
From 1870, the military authorities were having problems to find the number of recruits necessary for the planned operations volume, and from 1880 the proportion of smaller or lighter recruits began to increase.
“The number of men who were so small in frame as to be useless as soldiers was on the increase, he regretted to say; and last year there were 174 per 1,000 who only weighed 8 st. 8 lbs. What was 8 st. 8 lbs. for a soldier? It was the weight of a Derby jockey, and not of a man fit for a campaign.”
(Sir Walter B. Battelot, M. P., Army (Recruiting) – “Waste” of the Army – Observations, Hansard, House of Commons Debate, 01 June 1883, vol. 279, cc 1529)
“But if anyone would take the trouble to see for themselves the actual material of these figures, he would find a lamentable and a pitiable exhibition. To call them soldiers was a misnomer. They were boys of 16 and 17, enlisted under false representations made by themselves as to age, boys of not necessarily more than 5 feet 3 inches in height, or 32 inches in chest measurement, by a recent Warrant. ….
The Inspector General of Recruiting’s Report for 1882 showed that 554 men per 1,000 were under 20 years of age, 495 per 1000 were under 9 st. 4 lb. in weight, and 272 under 5 feet 5 inches.”
(Mr. Tottenham, M. P., Army – State of the Army – Recruiting – Observations, Hansard, House of Commons Debate, 17 March 1884, vol. 286, cc 75 and cc 77)
a
“…. We have had, within the last two or three years, serious intimations that the supply of recruits has been falling off. We find that in 1885 we were able to recruit 39,500 men; in 1886, 39,000; in 1887 the number dropped to 30,700; in 1888 it fell still further to 24,700; but in 1889, under the extreme pressure of lowering the standard, it rose to 29,000. Last year it was 31,400, or 8,000 less than it was five years ago, and we have 34,000 to be recruited during the present year.
……
In addition to all this, we have what is a much more serious matter, and that is the almost ridiculously reduced standard both of height and chest measurement. I find that in 1870, the last year of long service, the standard for infantry stood at 5 ft. 8 in. What it is now? The Foot Guards themselves last year reduced their standard from 5 ft. 8 in. to 5 ft. 7 in., an inch below what was the regular standard of the whole of the infantry during the last year of long service. But putting the Foot Guards on one side, how about the other branches of the service? I find that Artillery gunners have reduced their standard from 5 ft. 6 in. to 5 ft. 5 ½ in., the standards for Drivers has been reduced from 5 ft. 4 in. to 5 ft. 3 in., and the chest measurement is brought down from 34 in. to 33 in. I do not know what sort of a soldier you can get with a chest measurement of that kind. Your present infantry standard is 5 ft. 4 in., with a chest measurement of only 33 in., and a weight of 115 lbs.
….
It has been reduced to such an extent that absolutely we cannot get men big enough to work the guns of the Garrison Artillery, and the height for drivers in the Engineers has been reduced to 5 ft. 3 in. Indeed special men are taken at a height below that, and men are enlisted not much bigger than the African pygmies of whom Stanley has written.”
(Mr. Hanbury, M. P., Army Recruiting, Hansard, House of Commons Debate, 19 February 1891, vol. 350, cc 1089, cc 1090, cc 1106)
a
“… In 1847, he says, the typical private soldier – that is to say 47 per cent. of those who were measured – was between 5 ft. 7 in. and 5 ft. 8 in. in height (*).
(Colonel Fox) The British soldier? – Yes. Only 10 per cent. were between 5 ft. 6 in. and 5 ft. 7 in. That is in 1845 [sic.], but when we come to 1887 the typical private, that is to say 52 per cent., is between 5 ft. 6 in. and 5 ft. 7 in.; only 16 per cent. reached the higher standard. In 1873, 412 out of every 1,000 men were under 5 ft. 7 in. in height and 608 out of every 1,000 had a chest girth of less than 37 inches. Then in 1889, 581 men out of every 1,000 were less than 5 ft. 7 in. in height and 645 had a smaller chest measurement than 37 inches. In 1889, 2,351 out of every 10,000 recruits were under 130 lbs. in weight, and ten years later this proportion increased from 2,351 to 2,962. Those are the measurements he takes purely for the British Army.”
Mr. J. B. Atkins, London Editor of the Manchester Guardian, Inter-departmental Committee on Physical Deterioration, Report, 1904; Vol. II, Minutes of Evidence, p. 124.
(*) But this was a high figure – equal to the average height of the total male population – and was possible only because they were taking only a few thousand men per year.
“The majority of recruits were growing lads, and a large number were out of work at the time of enlistment. Experienced recruiting agents estimate the proportion of the latter as high as 90 % of the total. In many instances the lads were suffering from want of food, and were generally in poor condition.” (Army Medical Department Report, 1907, p. 1).
Those men in the population who had a good physique went into jobs in the police force (increased by 30,000), railways, and the Post Office.
“Mr. Lucas, one of the largest employees in the building trade, giving evidence before the [Airey] Committee, said that few good men amongst his employees were
“in the habit of enlisting ….. Amongst the steady men the mechanics very rarely enlist; the steady labourers who leave our employ to go into the army are what we call waifs and strays …. Men who spend too much of their money on drink, and waste their time in dissipation, frequently, as a resource, go into the army …. The men we value do not enlist.””
(quoted in: Lord Anglesey, Vol 3. p. 45)
“Trade has also increased most wonderfully during the last thirty or forty years, and the thousands that are employed in it seldom, I think, become soldiers, and those who do are generally unfit for such. Then, too, the introduction of new implements of husbandry moved by horse and steam power has driven most of the agricultural labourers into the towns, and in a short time they become so demoralized and deteriorated in physique that they are not better than the manufacturing population …”
(Dr. Donald, evidence before the Inter-departmental Commission, quoted in: Lord Anglesey, Vol. 3, pp. 42-43)
But the boys in the poorer areas of the cities left school at 12, and went into “boy jobs”, i.e. errand boys and messengers, shop boys, office boys, van boys for carmen, but at 18 they had to leave these jobs. (Gareth Stedman Jones, Outcast London, 1971, pp. 69-70, p. 102). But they had no skills for other employments, so they had look for a job in the army.
A large proportion of these came from literally “slum areas” in the East End of London, Manchester and Liverpool. They had little chance of finding a job, did not have enough food, and did not have much bodily strength.
a
The unemployment in these areas was very high, and thus the wages were low and/or intermittent. There were three unofficial surveys of homes from the end of the nineteenth century. One investigation was carried out by Fred Scott in the poorest parts of Manchester, i.e. Ancoats and Salford, in 1882, and reported to the Manchester Statistical Society. He found that 21 % (Ancoats) and 40 % (Salford) did not have regular work. The percentage of the working-class resident in these areas had increased considerably. Another survey was organised by Seebohm Rowntree in York in 1899, visiting all those people who did not themselves have domestic servants. It gave a figure of 27 % of the total population of York, who either had incomes insufficient to cover their minimum necessities of food, rent, and clothing, or had incomes slightly above this “poverty line”. A survey of large parts of London was carried out by Charles Booth in 1886-1891, which showed that 30 % of the inhabitants of London, and 35 % of the East End, were “poor” or “very poor”. He presented a street map, with colours reporting the income/social level; the first two stages were “Lowest class; vicious, semi-criminal” and “Very poor, casual; chronic want”.
“One can only go upon the dictum of experienced army medical officers, and they, or some of them, hold that the Tommy Atkins recruit is just an average type of his class.”
“Yes, the slum class?”
“Of the class from which he is born, 50 per cent of our people. But 35 or 40 per cent of our people live in slums.”
“You admit that the slum population is smaller than it used to be?” “No, I do not; it is much larger.”
“We have had evidence as to the progress in the great towns in clearing slums?” “And that is perfectly true, but the area of closely packed houses is increasing, and for all practical purposes a great many streets in Manchester which the medical officer would not classify as slums, for our present purposes are slums, because they are too narrow and too sunless.”
“We were told in this room not long ago that all the back to back dwellings in Liverpool were entirely extirpated – all the cellar dwellings, and these conditions are more favourable for bringing more sunlight and air to those places, are they not?” “Yes, but there are 170,000 people in Salford who live in streets which do not exceed thirty-six feet in width, and this solid area of streets is very little broken up by open spaces. Now there is plenty of testimony to show (I have some here), that you cannot breed a vigorous race in such a place – you cannot do it. You may have pure water, but you have neglected the purity of the air.”
“Quite so, but then surely the conditions of the past were just as adverse?” “No, for this reason. Take sixty years ago, when the last Royal Commission investigated the condition in Manchester and Salford, there were then only 40,000 or 50,000 living under such conditions in Salford. It is true that perhaps 10,000 out of 40,000 were living in worse conditions than any you may select out of the 170,000 of to-day, but then, the average is no higher than then, and the number of people submitted to the deteriorative conditions I have mentioned is very much larger.”
(Rev. W. E. Edward Rees, member of the Salford Education Committee; Inter-departmental Committee on Physical Deterioration, Report, 1904; Vol. II, Minutes of Evidence, Q. 4253-4258, p. 177)
| The reservoir of men who enlisted – or attempted to enlist – changed around 1870-1880. Previously they were members of the lower working class, who had had an employment, and due to temporary – but serious – problems, went to the army for guaranteed income and food. From 1880 onwards, they were members of the “slum class”, of 17 to 20 years old, undersized, and who had never had an “adult job”. “The calling of a soldier has ceased to attract the class of men who formerly enlisted, and as a consequence a larger proportion of the residuum of the population come under notice of the Army Recruiting Authorities” (Inter-departmental Committee on Physical Deterioration, Report, 1904; Introduction, no. 30, p. 6). Thus these recruits had an average height less than that of the generality of the working class. Further, the link between the average height of the male population and that of the “potential soldier segment”, had been broken, and the “curve” of the soldiers’ heights did not indicate the “curve” of the male population. |
A change took place in the requirements for recruits in the early 1880’s. Boys of 17 years were tacitly allowed to present themselves as 18 year olds, so long as they were above the minimum height limit. This meant in the statistical representation, that there were 15,000 more “18 year olds”, and also 15,000 more total recruits. The average height of the 18 year olds decreased by nearly 1 inch, and the average height of all recruits per year also decreased by nearly 1 inch. This negative movement in the average heights of recruits does not indicate a parallel movement in the heights of the men with decent employment.
| Year | Number Examined All Ages | Number Recruited All Ages | Average Height All Ages | Per Cent Examined 18 Years | Per Cent Examined 20 Years | Heights Recruits 18 years | Heights Recruits 20 years | |
| 1879 | 42,600 | 27,200 | 66.9 | 21.7 | 13.0 | 66.7 | 67.1 | |
| 1880 | 46,100 | 27,300 | 66.8 | 26.1 | 13.0 | 66.6 | 66.8 | |
| 1881 | 47,400 | 26,000 | 66.5 | (*)15.0 | 13.5 | 66.3 | 66.3 | |
| 1882 | 45,400 | 26,100 | 66.3 | (*) 3.7 | 13.7 | 66.2 | 66.5 | |
| 1883 | 59,400 | 26,000 | 65.9 | 24.0 | 11.8 | 65.5 | 66.3 | |
| 1884 | 66,900 | 39,000 | 66.0 | 31.9 | 10.5 | 65.6 | 66.4 | |
| 1885 | 72,200 | 43,300 | 66.0 | 34.1 | 10.7 | 65.6 | 66.3 | |
| 1886 | 75,000 | 42,100 | 66.0 | 39.5 | 9.0 | 65.6 | 66.5 |
Data from the Army Medical Department Reports.
(*) Errors in the official figures
b
“What about recruits of seventeen?” “They are too young for the Army, we take no man under eighteen.”
“Do you know that the Army Medical Reports of 1897 to 1900 show that there is a very considerable proportion indeed under eighteen, between seventeen and eighteen?” “No man is enlisted unless he says he is eighteen, except for the Militia.”
“That is a mis-statement on the part of the recruit, is it not?” “On the first page of the attestation a man declares his age. We do not ask him to produce a birth certificate, and as Mr. Brodrick has answered in the House of Commons, it would never do to get the birth certificate. You cannot get a man to enlist unless you enlist him at once.”
(Major-General H. C. Borrett, Inspector-General of Recruiting; Inter-departmental Committee on Physical Deterioration, Report, 1904; Vol. II, Minutes of Evidence, p. 9)
c
“….. They were boys of 16 and 17, enlisted under false representations made by themselves as to age, boys of not necessarily more than 5 feet 3 inches in height, or 32 inches in chest measurement, by a recent Warrant. ….”
(Mr. Tottenham, M. P., Army – State of the Army – Recruiting – Observations, Hansard, House of Commons Debate, 17 March 1884, vol. 286, cc 75 and cc 77)
Inter-departmental Committee 1904
From 1880, the army administration had been very worried about the low quality of height and strength of the men who presented themselves for recruits. This problem became real in the Boer War of 1899-1902, when the it was necessary to send 300,000 British and Empire troops to subdue a much lesser number of the total Boer population. It was clear that the quality of the troops (both the regulars and the volunteers for the war) was very low, and that this had made the army’s work very difficult. A movement started in Great Britain presenting the idea that there was a “Physical Degeneration” of the whole population.
The Government requested a number of experts to take part in 1904 in an “Inter-departmental Committee”. The witnesses to this committee were representatives of medical organizations, H. M. Inspector of Schools, H. M. Lady Inspector of Factories, army recruiting generals, secretary of the Anthropometric Association, doctors, social activists, and particularly: Charles Booth [poverty statistics, not the Salvation Army]; Seebohm Rowntree; a representative of the Salvation Army. In their appearances before the committee, the “official persons” took the position that there was no generalized “Degeneration”, and in any case, there were no recent data as to men’s heights which could be compared against previous data, which would be those of the Anthropometric Committee of 1882-1883. All those witnesses who had direct contact with the working class reported that there were many cases of short people, and/or with bodily problems (rickets and bandy legs; anemia in the women; sterility in the women, from stress; bad teeth, very common; lessening of the intelligence, in small children; undeveloped musculature of the arms).
The causes of the reduction in heights were: unsuitable and insufficient food (many of these families ate almost without exception, white bread, butter, sometimes jam, and drank large quantities of tea), very little care by the parents of their children, little sleep for the children, juvenile smoking, no movement of air in the rooms or in the house. In many cases, the parents had apparently enough wages to buy sufficient quantities of food, but spent a lot on drink.
q
Witnesses’ comments as to stature:
“… Mr. Marr, who is the head of the Men’s House of our University settlement in Ancoats, tells me that they have a great difficulty with their dramatic performances. A stranger of 5 feet 6 inches looks a giant on the stage with Ancoats people. There are large engineering and machine building works at Ancoats. Mr. Marr says that on several occasions he has passed through a crowd of the workmen, and they have the stature of school boys: and that is the case. I stood in a great crowd on the occasion of the opening of a boys’ club by the Duke of Clarence. I had to leave early with my wife who is of middle height and she looked over the heads of the crowd. The average height of the people of Manchester and Salford is very low.”
q
Mr. T. C. Horsfall, Manchester and Salford Sanitary Association, Q. 5640, p. 226
“In those districts of the towns which are chiefly inhabited by working people, the average stature of the inhabitants is very low – a man of 5 feet 10 inches in height looks over the heads of a crowd in such districts – and physique is very poor. Bad teeth are remarkably common. The children in schools are much below the English average in height and weight. The members of the University Settlement in Ancoats, who meet many of the most intelligent workmen in that part of Manchester, notice that they walk badly and that very few breathe rightly. Cripples are very common. The settlement is in touch with 180, all of whom live within a mile of the settlement.”
Mr. T. C. Horsfall, Q. 5580, p. 221
“….. But there is a very much larger number of men in industrial cities, varying in height from 5 ft. 1 in. to 5 ft. 5 in., than you find in the rural districts – a very much larger proportion.”
Mr. Harry James Wilson, H. M. Inspector of Factories and Workshops in Newcastle-on-Tyne, Q. 1988, p. 85
“We must not take it that life in the country is necessarily better than life in the towns under the present organization that you speak of?” “I think that is too wide a question for any one person to speak of with conviction. I have not seen enough to enable me to say positively that that is the fact. On the whole there is no doubt that the open air life gives a more vigorous physique than life in the towns. Take, for instance, the magnificent policemen we have in London, whose figure as they walked beside the processions of the “unemployable” were a staggering commentary on that fact. I know a good many police officers who tell me that these men come up from the country districts, but I am afraid that their children or grand-children will be represented by the physique of the unemployed if they remain in London.”
“Why are you afraid?” “Because I see the sort of population that comes day after day to watch the Guards parade at St. James Palace; and it so happens that on Mafeking night I walked down from Charing Cross to Cannon Street by chance, and I went through the whole crowd and I did not see a dozen men that I could have enlisted. A great portion of the crowd were women and children no doubt, but I was watching the whole way from Charing Cross to Cannon Street to see what kind of men they were, and my impression was what I have said.”
“The streets were well enough lit for you to see?” “Yes. You will remember what a blaze there then was.”
General Sir Frederick Maurice, Q. 390-392, p. 17
“…. Immediately on the expiration of the compulsory school attendance period, fourteen years of age, this child will commence to labour for his own bread. If he resides in a textile district, employment at relatively good wages will be readily found for him, but the hours will be long, fifty-five per week, and the atmosphere he breathes very confined, perchance also dusty. Employment of this character, especially if carried on in high temperatures, rarely fosters growth or development; the stunted child elongated slightly in time, but remains very thin, loses colour, the muscles remain small, especially those of the upper limbs, the legs are inclined to become bowed, more particularly if heavy weights have to be habitually carried, the arch of the foot flattens and the teeth decay rapidly.”
Mr. Harry James Wilson, Q. 1927, p. 81
“ ….. In studying this question myself, I have considered the crofter or small holder, such as one finds in the rural districts of England, but more especially in Scotland and Ireland, as a fair type physically of what an individual brought up under reasonably healthy conditions ought to be. The men and women of this class are usually of good height and weight, have superior muscular development and possess the power of endurance in a marked degree.
….
Contrasted with this class the town-bred artisans are, more especially in large industrial centres, distinctly less both in height and weight, and their general development inferior. Even shop assistants and clerks drawn from the families of the lower middle classes compare very favourably with these men, and their equal is only reached among the upper middle classes where the individuals have been trained to an outdoor life, or allowed sufficient exercise and sleep during the period between leaving school and attaining full growth.
…..
The most marked degeneracy, in my opinion, is found where the greatest number of adverse circumstances are actively at work from birth to maturity, as for instance among the very poor in our old industrial centres, and is especially noticeable in the case of poorly paid and unskilled indoor workers, the women suffering about equally with the men. This degeneracy can be best studied in certain textile industries, or wherever the remuneration is so small as to attract the lowest in the social scale.”
Mr. Harry James Wilson, QQ. 1912-1915, p. 80
“…. The most unsuitable class of occupation has been described; the most beneficial, perhaps, is farm laboring, after that industries partially conducted outside, such as ship-building, rope-making, iron-rolling, quarrying, and fish-curing. …”
Mr. Harry James Wilson, Q. 1933, p. 81
“[the worst types?] “Persons of poor constitution, or suffering from slight deformity, frequently become tailors or shoemakers, and the great mass of ordinary tradesmen with medium development and stamina one finds working as joiners, printers, moulders and fitters, etc. I would place barbers, clerks, shop-assistants, textile operatives, and bakers, etc., below ordinary tradesmen in point of physique, their occupations not being of a character to foster development; but the very poorest are met with in the lowest paid and unskilled textile operations, as casual labourers, and occasionally in potteries.”
Mr. Harry James Wilson, Q. 1935, p. 81
“…. Thus I have frequently conversed with full-grown men of twenty years and upwards who do not stand more than 5 feet or 5 feet 1 inch, and who scale less than nine stone. These men have not the physical strength for heavy manual labour, or indeed any task which demands prolonged efforts, but must accept unskilled labourer’s wages in mills or factories all their lives. As a matter of fact these men are doing women’s work very often. They get from 10s. 6d. up to 17s. a week.”
[Dundee]
Mr. Harry James Wilson, H. M. Inspector of Factories, Q. 1936, p. 82
“Can you tell us what aspect of physical degeneration first attracted your attention to the subject?” “I practiced what they call locally in Liverpool for eight years, and when I went down I saw a great contrast between the operatives from manufacturing districts and men and women coming from agricultural districts; it was very marked. I was startled by the appearance of the former, and it was some time before I came across the true Lancashire race. The agricultural parts of Lancashire certainly produce as fine a lot of men as any county in England, and the contrast between them and the men of the manufacturing districts was most startling.”
Mr. Ralph Neville, Secretary of the Garden City Association, Q. 4728, p. 192
“The influence of nutriment on growth is also shown by the difference in stature in Jews living in the East End and in the West End of London. The wealthy Jews of the West End are found to be 3 inches taller than the poor Jews in the East End.”
Mr. Lindsell, Member of the Council and Treasurer of the Anthropological Institute,
Q. 3267, p. 141
“As far as I can tell, the girls are more weakly and less able to work, and certainly the teeth are worse; ….. I know something about Hertfordshire. I should say that the girls who came for instance into my mother’s service are less strong than in my girlhood thirty years ago.”
The Hon. Mrs. Arthur Lyttelton, Q. 5359 and 5361, p. 213
“I enquired of a large London contractor who is making a railway in the district, and he tells me his experience. I have received a letter from him since I came into this room saying that his navies, especially when drawn from the agricultural laboring class, are nothing like as good as they used to be. I can read you what he says: “This class of man as a whole is very much inferior to-day to what it was twenty-five or less years ago.””
Mr. G. H. Fosbroke, Medical Officer of Health to the Worcestershire County Council,
Q. 6667, p. 263
a
“I went there [Longton, Potteries] because I thought the children would be drawn from the poorest class, and the master who had been master for several years, said, in his opinion, his children improved after they went to work, and he thought the reason was that they had such very poor food owing to their bad homes and bad parents that when the earned a little money for themselves they were able to get better food.”
“They supplemented it by things they bought themselves?” “Yes, or they contributed to their support and had better food. But in the parts that I went to I think there was a general opinion that they were dwarfed – smaller than they should be: they did not grow. In our very large classes, in the boy’s clubs and women’s classes, they seem to be distinctly under the size and height that you would expect.”
Miss Maud Garnett, Head of the Diocesan Women’s Settlement, Fenton House, QQ. 9060-9061, p. 331
“The difference in physique between the men of the farming class and the working people of the towns is very striking. The contrast may be noticed especially on the occasion of large political processions in which bands or lodges of farmers and of city artisans are to be seen side by side, when the greater stature and bulk of the farmer are at once noticeable.”
[Ulster]
Dr. C. R. Browne, Q. 9693, p. 357
“On the whole you think there is better physique in the country school?” “Bigger bulk.”
“But not as alert as the children in town?” “Well, if I may go on; I say this impression was well verified during the medical inspection of one of the Edinburgh schools. My husband asked that the nine- to ten year old girls be sent to him, and when they came into the room I said, “The teacher has made a mistake here; she has sent in the infants,” but when we looked at their sheets, they were right enough – girls between nine and ten years of age. That was my impression. I do not think there is any doubt that the purely country bred child has at all ages a larger total physical development than the town bred child.”
Mrs. Mackenzie, QQ. 7000-7002, p. 276
Jack London, in his account of living on the streets of the East End in 1902 (“The People of the Abyss”), gives us some other observations:
“Nowhere in the streets of London may one escape the sight of abject poverty, while five minutes’ walk from almost any point will bring one to a slum; but the region my hansom was now penetrating was one unending slum. The streets were filled with a new and different race of people, short of stature, and of wretched or beer-sodden appearance.”
(Chapter I, The Descent)
“In short, the London Abyss is a vast shambles. Year by year, and decade after decade, rural England pours in a flood of vigorous strong life, that not only does not renew itself, but perishes by the third generation. Competent authorities aver that the London workman whose parents and grand-parents were born in London is so remarkable a specimen that he is rarely found.”
(Chapter IV, A Man and the Abyss)
“Of the “submerged tenth” Mr. Pigou has said: “Either through lack of bodily strength, or of intelligence, or of fibre, or of all three, they are inefficient or unwilling workers, and consequently unable to support themselves … They are often so degraded in intellect as to be incapable of distinguishing their right from their left hand, or of recognizing the numbers of their own houses; their bodies are feeble and without stamina, their affections are warped, and they scarcely know what family life means.”
(Chapter IV, A Man and the Abyss)
“It is incontrovertible that the children grow up into rotten adults, without virility or stamina, a week-kneed, narrow-chested, listless breed, that crumples up and goes down in the brute struggle for life with the invading hordes from the country.”
(Chapter V, Those on the Edge)
“But up spoke my other companion, a man of twenty- eight, who eked out a precarious existence in a sweating den.
“I’m a ‘earty man, I am”, he announced. “Not like the other chaps at my shop, I ain’t. They consider me a fine specimen of manhood. W’y, d’ ye know, I weigh ten stone!”
I was ashamed to tell him that I weighed one hundred and seventy pounds, or over twelve stone, so I contented myself with taking his measure. Poor, misshapen little man! His skin an unhealthy colour, body gnarled and twisted out of all decency, contracted chest, shoulders bent prodigiously from long hours of toil, and head hanging forward and out of place! A “’earty man’, ‘e was!”
“How tall are you?”
“Five foot two,” he answered proudly; …”
(Chapter VI, Frying-Pan Alley and a Glimpse of Inferno)
To us today, these descriptions of the condition of the very poor working class (and non-working class), are not understandable. We are generally informed that the working class of the country, up to 1860, had reached a reasonable level of income and living conditions, and then improved continuously. But what we have here is a description of a “sub-class”, which really does not appear in the economic figures of the country. Some of the witnesses offered analysis of why this had happened. In a general sense, those of the working class who had a decent or nearly-decent way of life in 1860 had improved their incomes and their living conditions, and those of the working class who had low living standards (and lived in slum areas) had had no movement in their situation. But the proportion of the “sub-class” increased from perhaps 5 % to perhaps 20 %. And they lived in original slum areas, but with a higher density of housing. Here we have the analysis by some of the witnesses:
q
“….. He says his first point is that up to the age of eight, children in the meaner Salford schools are scarcely inferior to those in the better quarters. He deduces these results from the measurements of the Anthropometric Committee. Then he goes on to say that after the age of eight, a constantly-growing disparity is observable between the scholars in the squalid surroundings and those in the better quarters. For example, he finds that at the age of thirteen a scholar in the slums is four inches shorter and 16 lbs. lighter than his fellow in a good working class neighbourhood. …… Next he makes this point, which I think is a very interesting admission, from a man who firmly believes there is a grave deterioration. He says that he does not think the physical standard of the slum dweller is necessarily lower than before. If you take the average measurement of the slum, he says, it is not worse than in any given year before in the same slum. But the point is that a greater proportion of persons is now falling to this level owing, as he says, to the capacious maw of the towns, which swallow up so much of the rustic population. That, he says, is really where
the degeneration lies.”
Mr. J. B. Atkins, London Editor of the Manchester Guardian, quoting the Rev. W. G. Edwards Rees, Chairman of the Anthropometric Committee of the Salford School Board,
Q. 2871, pp. 123-124
“….. but he frankly admits the improvement in certain classes, and his whole point is, that there is a growing disparity between the favoured class and the highly unfavoured class, a widening of the gulf, he says, between the giants and the pygmies, and he adds that the sanitary statistics on which some people rely simply obscure the truth. Of course he admits that the death rate is lower, and the expectation of life has increased. Then he searches for the cause of deterioration, and takes a most interesting view which I have never got anybody else to admit so fully: he says that drink is not the causa causans; it is not the specific cause, because he thinks bigger men used to be a great deal more drunk than now, and he says that some people on the Continent are actually improving in spite of a greater consumption of drink. Then he says overcrowding is not the whole cause, as the whole of Europe is overcrowded except Denmark. And the physical measurements are increasing in nearly all those countries. Then he says want of food is not the whole explanation. He says it is more abundant and distinctly better than it was sixty years ago. The thing that he attributes all the evil to is the want of fresh air and the want of exercise in the towns.”
Mr. J. B. Atkins, London Editor of the Manchester Guardian, quoting the Rev. W. G. Edwards Rees, Q. 2890, p. 125
“In considering the condition of the parents of the children who you think are in need of assistance you draw a very sharp line between the better class and the poorer class?” “Yes. I say you can draw a sharp line dividing the working class children into those who were never better cared for, never better physically trained, never better looked after generally, than they are today, and those on the other hand who, in the matter of nutrition, clothing, housing, and so on, were never worse off than they are today.”
“You think that recent years have accentuated the differences between those classes?” “Yes. I suggest that 80 per cent. of the working class children were never as well off as they are today. I think that is the result of thirty-three years of compulsory public education, the habits of discipline given in the schools, the physical training given in the schools, and the organized games of the playgrounds and playing fields, and the elevating effect of the school system upon the home – I lay great stress on that.”
Dr. Macnamara, M. P. for Camberwell, Member of the London School Board, QQ. 12362-12363, p. 454
“One can only go upon the dictum of experienced army medical officers, and they, or some of them, hold that the Tommy Atkins recruit is just an average type of his class.”
“Yes, the slum class?”
“Of the class from which he is born, 50 per cent of our people. But 35 or 40 per cent of our people live in slums.”
“You admit that the slum population is smaller than it used to be?” “No, I do not; it is much larger.”
“We have had evidence as to the progress in the great towns in clearing slums?” “And that is perfectly true, but the area of closely packed houses is increasing, and for all practical purposes a great many streets in Manchester which the medical officer would not classify as slums, for our present purposes are slums, because they are too narrow and too sunless.”
“We were told in this room not long ago that all the back to back dwellings in Liverpool were entirely extirpated – all the cellar dwellings, and these conditions are more favourable for bringing more sunlight and air to those places, are they not?” “Yes, but there are 170,000 people in Salford who live in streets which do not exceed thirty-six feet in width, and this solid area of streets is very little broken up by open spaces. Now there is plenty of testimony to show (I have some here), that you cannot breed a vigorous race in such a place – you cannot do it. You may have pure water, but you have neglected the purity of the air.”
“Quite so, but then surely the conditions of the past were just as adverse?” “No, for this reason. Take sixty years ago, when the last Royal Commission investigated the condition in Manchester and Salford, there were then only 40,000 or 50,000 living under such conditions in Salford. It is true that perhaps 10,000 out of 40,000 were living in worse conditions than any you may select out of the 170,000 of to-day, but then, the average is no higher than then, and the number of people submitted to the deteriorative conditions I have mentioned is very much larger.”
(Rev. W. E. Edward Rees, member of the Salford Education Committee; Inter-departmental Committee on Physical Deterioration, Report, 1904; Vol. II, Minutes of Evidence, Q. 4253-4258, p. 177)
r A second effect was that of the migration from the countryside into the cities (particularly London). It was a commonplace that city-born children, whose parents had come from the country, were shorter than their parents. This was due to the bad conditions in the cities: coal smoke, zero movement of air in the buildings and the rooms, bad working conditions, little free exercise.
q
| The effects from 1860 to 1900 on the average height of the population of England might have been approximately the following: Increase in percentage of slum population: change in proportion of “never worse off” in the population = 20 % minus 5 % = 15 %, decrement in height per person = 4 inches, effect on average height of population = 0.15 x 4 = 0.6 inches; Increase in proportion of urban working class = 10 %, decrement in height per person = 2 inches, effect on average height of population = 0.1 x 2 = 0.2 inches; Total effect = 0.8 inches. |
e
The final height value after the reduction of 1.0 inches, is 66.1 inches in 1914-1915, in a study of 3,000 men who were part of the immense enlistment for the War. (Bailey, Hatton, Inwood, 2014)
Some of the witnesses commented on the more proactive policies of the
German, French and Swiss authorities.
“Germany is very different from this country, because the great industrial development in Germany succeeded instead of preceding as it did in this country any comprehensive knowledge based upon on scientific hygiene?” “Yes.”
“And therefore Germany was fully alive to the sanitary conditions of the problem before it had to face the great increase of the urban population?” “Yes.”
“Whereas the great increase in this country in industrial development preceded, not only any healthy public sentiment on the subject, but any scientific knowledge?” “Yes.”
Mr. Rowntree, QQ. 5094-5096, p. 204
“[Colonel Fox] I remember going to Solingen, the Sheffield of Germany, and I expected to find a second Sheffield, but I found no smoke, and every house was painted white, with green shutters, because the laws were in force against noxious vapours?” “Yes, and Germany has seen what we have not seen. We saw the necessity, before any other people, of making the drainage right; other continental peoples generally have seen the necessity of keeping the air pure before we did – we have not yet seen it.”
Mr. Rees, Q. 4280, p. 178
“The only conceivable way in which many of the causes which operate in the houses and ruin the health of the people can be got rid of is the adoption of a system which German towns are being forced into of having what is called continuous inspection of houses. Since 1901 all towns in Saxony, with over 20,000 inhabitants, must have continuous inspection of small houses, and in Wuerttemburg all towns with more than 3,000 inhabitants have it. Stuttgart, with 181,000 inhabitants, introduced the system of continuous inspection of all small houses, and servants’ and apprentices’ rooms in larger houses, in 1902. It has 120 unpaid visitors, who are aided by paid officials. The visitors would be fined if they did not accept the office when they are appointed. The system has been introduced into villages in Saxony. You must have every house entered and reported upon. You cannot expect very poor people to report, nor can you expect their neighbours to do so: and no voluntary organization can be strong enough to visit all the small the small houses in a small town. It must be made the duty of some person to go into every house periodically to examine it and call attention to those defects which are interfering with health.”
Mr. Horsfall, Q. 5620, p. 224
“You attribute one of the causes of physical deterioration to the absence of such a system as that known as the Elberfeld for dealing with such poverty. Would you kindly describe that system a little?” “The possibility of it is due to the existence of the right of the German Government to claim from every citizen in civil life that he shall accept an unpaid post. Under the Elberfield system [initiated in 1851] the whole of a town is divided into very small districts and to each of those districts one of the citizens is told off. It is his duty to visit all the working class families that are likely if things go badly with them to need help, and to make himself familiar with the circumstances of their lives, to give them advice which in his opinion will tend to get them out of difficulties, to give them advice as for instance how to get situations and the best work for their sons. Then if one of the families that one of the visitors does get out of work or need help from public sources the visitor has to report the case to the organization of the district that includes his own small one – and if they approve of what he proposes to do then an amount of money is paid through this man to the family for the time during which it is needed. This system is working so well in preventing poverty and in helping the people who have fallen into poverty that it is now being in its essential features applied by all the large towns.”
Mr. Horsfall, Q. 5646, p. 226
The witnesses also commented on the town planning in Germany, such that the factories were built not close to the workers’ housing, and that there were areas for parks and trees; the system of tickets in Paris, such that the poor children could have free meals at the cost of the city administration; and the longer periods for the absence of the women after childbirth, in France, Germany, and Switzerland.
qDiscussion and Conclusions
r
This investigation has shown that the graphs of average height of recruits per year, are fully explainable in terms of military actions and changes in recruitment policies:
- large-scale wars;
- urgency in finding large numbers of troops for an unexpected war;
- changes in minimum height standards;
- amounts of bounties (signing-on bonus).
The only socio-economic factor was the lack of employment in the labour market
for poorer boys, starting in the 1870’s.
It is not necessary to postulate that the average heights are caused by economic, nutritional, or sanitary conditions at the time of childhood of each man.
It appears that Roderick Floud was conscious that there could be some effect of the changes in recruiting policies and of the peace/war dichotomy, on his calculated average heights:
“It is wise, however, to be cautious. The period spanning the Napoleonic Wars was one of extremely rapid change in the demand for recruits. It is not difficult to construct an imaginary scenario which would explain away the short-term oscillations in the series, in line with the discussion of offer bias in the labour market in section 3.3 above. In brief, it is possible that the interplay of military recruitment with the civilian labour market could have produced such an oscillation. If it did, then the drop in heights for those born in the 1790s might be an artefact of such a process, as might be the rapidity of the increase thereafter. It might similarly be argued that the data from the third quarter of the nineteenth century might be affected by the Crimean War and that from the 1890s and 1900s by the Boer War.”
(Height, Health and History, pp. 152-153)
q He was right. Taking his figures from Table 4.1. (and correspondingly, the Figures 4.1., 4.2., 4.3.) for the “birth years”, we have:
w
| Birth Year | 1780-1784 | 1785-1789 | 1790-1794 | |
| Recruitment Year | 1798-1802 | 1803-1807 | 1808-1812 | |
| Age 18 | 65.2 | 63.4 | 64.1 | |
| Birth Year | 1825-1829 | 1830-1834 | 1835-1839 | 1840-1844 |
| Recruitment Year | 1847-1851 | 1852-1856 | 1857-1861 | 1862-1866 |
| Age 22 | 67.5 | 66.9 | 64.7 | 66.6 |
| Birth Year | 1876 | 1877 | 1878 | |
| Recruitment Year | 1898 | 1899 | 1900 | |
| Age 22 | 66.2 | 65.6 | 66.1 |
d
We see that the 1803-1807 minimum corresponds to the Napoleonic Wars, the 1857-1861 minimum corresponds to the Crimean War, and the 1899 minimum corresponds to the Boer War.
So we will be using the data from all the other sources, but not from soldiers’ recruitment heights, to make a good estimate of heights during our period.
The final result of estimated heights for the average of the population of Great Britain for 1760 to 1900 is as follows:
s
| Height ins. | Height cm. | |
| 1760 | 66.0 | 168 |
| 1770 | 66.0 | 168 |
| 1780 | 66.1 | 168 |
| 1790 | 66.2 | 168 |
| 1800 | 66.2 | 168 |
| 1810 | 66.3 | 168 |
| 1820 | 66.6 | 169 |
| 1830 | 67.0 | 170 |
| 1840 | 67.2 | 171 |
| 1850 | 67.5 | 171 |
| 1860 | 67.5 | 171 |
| 1870 | 67.5 | 171 |
| 1880 | 67.4 | 171 |
| 1890 | 67.1 | 170 |
| 1900 | 66.7 | 169 |
s
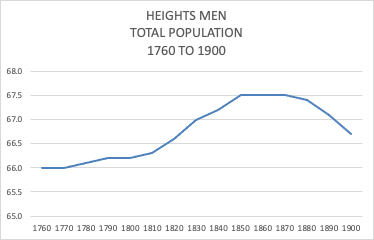
t
The first period, from 1760 to 1810, has as examples:
- Of the Steegmann soldiers, those who were recruited in 1790-1799, that is, when there was a large volume of recruitment, the average height was 65.9 ins.
- The Dorset Militia in 1798-99 (civilians) had an average height of 66.4 ins.
- Selection by Coss of 7,300 soldiers in the Peninsular War (1808-14) was 66.3 ins.
- “Floud Data” of soldiers gives 66.1 ins. for recruitment date 1780 (American War of Independence), 66.0 ins. for recruitment date 1794-1810 (Napoleonic Wars).
For the second period, from 1840 to 1880, we have:
- The analysis by James Riley, of the data from Beddoe, which shows practically continuous stature of 66.9 inches for persons of 20 years old from 1840 to 1865;
- The collection of heights by John Beddoe in 1870, giving an average height of 67.4 inches;
- The analysis by the Anthropological Committee, of persons born in the years from 1840 to 1870 showing an average height of continually close to 68.0 inches, and those born in the years 1870 to 1880 of 67.7 inches;
- The survey of the Anthropological Committee, giving an average height of 67.4 inches in 1882 and a few years before.
For the period from 1880 to 1900, the assumption is:
- The height of 67.4 inches in 1880, falls to 66.5 inches in 1900, due to the increase of the proportion of “slum population” and the numbers moving to the cities.
The end figure for this paper is of 66.1 inches for 1914, taken from a sample of the men who enlisted in 1914-15.
The male convicts had a stature of 66 inches in 1764 (birth date), which went down gradually to 65.5 inches in 1830 (birth date), where it remained until 1880.
The male skeletons excavated in archaeological investigations in burial grounds, which were in use in different periods from generally 1750 to 1850, had average heights per burial ground of between 66.5 and 67.5 inches.
As a general statement, we can say that the average male height (“walking down the street”) was from 5 ft. 6 in. to 5 ft. 7 in. in the period 1780 to 1820, and from 5 ft. 7 in. to 5 ft. 8 in. in 1850 to 1880. The probability is that by 1900, 75 % of the population had an average stature of 5 ft. 7 ½ in., and 25 % of the population (“slums” and migration into London) had an average stature of 5 ft. 4 ½ in.
If we think in terms of “birth dates”, and supposing that the average age in each of the investigations was about 30 years old, this means that men born in 1750 to 1790 had an adult height of 5 ft. 6 in. to 5 ft. 7 in., and that men born in 1820 to 1850 had an adult height of 5 ft. 7 in. to 5 ft. 8 in.
Thus the average heights from approx. 1770 increased by 1.0 inch – or a little more – up to 1830. This would suggest a net improvement in the living conditions in this period. This is not surprising, as we know that at least the populations in the Northern Industrial Towns and in London had a sufficient food consumption in this period. We also know that 25 % of the working class families had a clear excess of income over expenses; 800,000 families had accounts of on average 30 Pounds by 1844. On the other hand, the effects of the Industrial Revolution as to bad sanitation and housing overcrowding were not important before 1830 (only important in Lancashire).
w
The heights of men born in 1820 to 1850 (real date = 1850 to 1880) were higher than at the end of the 18thcentury, and considerably higher than in other countries. It would appear that the effect of sufficient food and wages was more (cumulative up to these dates) than the negative effect of bad sanitation, bad housing and bad air.
Following, we have a graphical depiction of the average heights in some European countries in intervals of 25 years:
w

tAverage heights in centimeters:
uAverage heights in centimeters:
| Great | France | Belgium | Netherlands | Italy | Spain | Sweden | |
| Britain | |||||||
| 1800 | 168 | 162 | 164 | 165 | 164 | ||
| 1825 | 169 | 163 | 165 | 166 | 167 | ||
| 1850 | 171 | 164 | 165 | 164 | 162 | 162 | 168 |
| 1875 | 171 | 165 | 165 | 166 | 162 | 163 | 170 |
| 1900 | 169 | 166 | 166 | 169 | 164 | 164 | 172 |
| 1925 | 170 | 167 | 166 | 171 | 165 | 165 | 173 |
| 1950 | 171 | 168 | 170 | 174 | 167 | 166 | 175 |
| 1975 | 173 | 173 | 175 | 178 | 171 | 168 | 178 |
| 2000 | 175 | 176 | 179 | 182 | 175 | 175 | 179 |
vAverage heights in inches:
w
| Great | France | Belgium | Netherlands | Italy | Spain | Sweden | |
| Britain | |||||||
| 1800 | 66.2 | 63.8 | 64.6 | 65.0 | 64.6 | ||
| 1825 | 66.7 | 64.2 | 65.0 | 65.4 | 65.7 | ||
| 1850 | 67.5 | 64.6 | 65.0 | 64.6 | 63.8 | 63.8 | 66.1 |
| 1875 | 67.5 | 65.0 | 65.0 | 65.4 | 63.8 | 64.2 | 66.9 |
| 1900 | 66.7 | 65.4 | 65.4 | 66.5 | 64.6 | 64.6 | 67.7 |
| 1925 | 67.0 | 65.7 | 65.4 | 67.3 | 65.0 | 65.0 | 68.1 |
| 1950 | 67.3 | 66.1 | 66.9 | 68.5 | 65.7 | 65.4 | 68.9 |
| 1975 | 68.0 | 68.1 | 68.9 | 70.1 | 67.3 | 66.1 | 70.1 |
| 2000 | 69.0 | 69.3 | 70.5 | 71.7 | 68.9 | 68.9 | 70.5 |
t
There are a few individual numbers about other countries from the Inter-departmental Committee, which show that the percentage of rejections for recruits went down:
“… Mr. Edwards-Rees has some figures here which I could give to you in a few minutes, comparative figures. He says it is not easy to get the German figures, but these he has been given for the year 1889. There is a striking parity, he remarks, between the German conscript and the average English recruit. In 1889 the English recruit averaged 5 ft. 5.6 in. in height, and his chest measurement was 33.6 inches, and he weighed 124.4 lbs.; the German conscript 5 ft. 5.75 in. in height, 33 ¾ inches round the chest, and 138 lbs. in weight. The German superiority in weight, therefore, he says is remarkable.”
“There is one thing about that; they are representative men of the country. They represent the whole of the country, but our men come from the lower stratum altogether?” “Yes. I was going on to say that. I think that does invalidate the point. He says that the German superiority in weight is remarkable, but the German conscript is, on average, ten months older. So far, he says there is little in it between the two, but then we must consider the percentage.”
“He is two years older; the German conscript is twenty years of age and our recruits are only eighteen?” “Was that so in the year 1889?”
“Not the average. The average is not eighteen. You take men older than eighteen.”
“A vast number come in at eighteen, you see?” “Yes. Then he goes on to the percentage of rejections, a comparison between Germany and Great Britain. He says in Germany the percentage fell steadily from 24.7 in 1878 to 16.3 in 1889. In about the same interval ours rose from 52 per cent. to 62 per cent.”
QQ. 2879-2883, p. 124
“….. Then he goes on to the French estimate. The statistics up to 1890 tell substantially the same tale. The percentage of rejections has fallen from 9 ¼ per cent. in 1831 to 5 per cent., where it now stands. The increase in the average height of French soldiers has been set down at about ¼ of an inch in a period of twenty years, noticed continually between 1830 and 1890. Since then there has been a slight relapse in the French measurements, and alcoholism is a suggested cause.”
Q. 2886, p. 124
“As for the Swedish army, he says that between 1841 and 1850, the rejections were 36.4 per cent.; this proportion fell in successive decades to 35.7 per cent., then to 27 per cent., then to 23 per cent, and lastly to 20 per cent.”
Q. 2888, p. 125
“The Dutch army he takes next; he says the proportion of men under 5 ft. 1 in. fell from 13 per cent. in 1863 to 3 per cent. in 1899. Men between 5 ft. 1 in. and 5 ft. 3 in. fell in the same period from 15 per cent. to 8 per cent., while men of more than 5 ft. 7 in. rose from 23 per cent to 37 per cent.”
Q. 2890, p. 125
A comparison with the graphs of heights of other European counties is interesting. In 1800, British men were 4 cm. taller than those of Sweden, 4 cm. taller than those of Belgium and the Netherlands, and 6 cm. taller than the French. By 1900, Sweden had passed Great Britain by 3 cm., the Netherlands had only just caught up with Great Britain, France and Belgium were still behind. If we look at the increases in the period 1800 to 1900, we see a hierarchy: Sweden + 8 cm., Netherlands + 4, France + 4, Belgium + 2, Great Britain + 1.
Sweden and the Netherlands had respectable increases, although they started industrializing only after 1850. France started industrializing around 1820-1840, but only in the North-East and East. Belgium was already industrialized by 1820, and England before that date.
It appears that it was possible to have an increase in average heights, which reflected economic growth, even if this growth was not based on industry. “Industrialization” should be interpreted as “large cities”, “extreme concentration of housing”, “minimal sanitation”, “air and water pollution”. In Great Britain the negative effects of industrialization were practically equal to the positive effects of increases in money incomes and in food.
| “….. Professor Meyer – who is the head of the Zoological Museum in Dresden, and who came over on a tour of inspection of museums, wrote notes, which were not intended for English consumption, but were merely to be read to his colleagues and published in the Transactions of the Museum – speaks of the miserable condition of the people of Manchester and Salford. He gives an account of the Salford Museum, and his impression was a very unfavourable one. He said that the place was dirty with soot, and as it happened to be a public holiday the Museum was full on that day of a degenerate lot of people, the like of which “we have not in our German towns”. And that is amply justified. I received the report from Dr. Meyer because he had read some pamphlets of mine and agreed with what I had said. I mention this to show that this was not written as an insult to England, or with any desire to give offence to the English people.” “This is not due to great poverty, is it?” “It is due in part to poverty and in part to drinking and to wrong condition of life – all these things go together. You cannot say which is cause and which effect.” “Mr. Rowntree talks of primary poverty; that is, where the means are so small that under the most favourable conditions they could not keep a family?” “It is not generally the result of primary poverty, but very often the result of secondary poverty. Dr. Meyer said of Manchester it was “An incredibly sooty town, with over three-quarters of a million inhabitants. Dresden, which, in this respect, has an unfavourable distinction, is a real paradise compared with Manchester. We must deplore the course of a civilisation which produces such misgrowths and makes hells of places where human beings have to dwell.” If the popular notion of hell is a correct one, Manchester ought not to be described as a hell, because then the smoke presumably would be consumed.”Mr. Horsfall, QQ. 5635-5637, pp. 225-226 |
What set England apart from the Continental countries, is that at the end of the nineteenth century, it had a “slum class” of low stature and great poverty, in addition to the normal working classes. As Dr. Meyer says, … the like of which “we have not in our German towns”. The industrial Revolution, together with the commercial and social conditions of the time, had in the end formed a society in which “…. you can draw a sharp line dividing the working class children into those who were never better cared for, never better physically trained, never better looked after generally, than they are today, and those on the other hand who, in the matter of nutrition, clothing, housing, and so on, were never worse off than they are today.”This would partially explain the bad image of the. Industrial Revolution.
