Introduction
A very important group of data for the quantification of the living standards of the population in nineteenth century England and Wales, would be the calculation of the per capita consumption of cereals (in particular, wheat). This, naturally, is derived from the sum of domestic production and imports, divided by the number of the population. It may be expressed as pounds of grain per person per day, or pounds of bread per person per day.
There are no series of figures in academic publications for domestic production in quarters (480 lbs.) per year, or imports in quarters per year, for the nineteenth century. There is only one investigation which gives the estimated yearly sales (Susan Fairlie, 1976). There are also no figures responding to the question: was the sum of domestic production and imports enough to cover the requirements of the population?
This situation has given rise to the ideas:
- The people had an insufficient consumption of wheat for their biological necessities, in the period 1815 to 1846 (abolition of the Corn Laws), because the domestic production was low, and imports were not permitted;
- The people had an insufficient consumption of wheat for their biological necessities, in the period 1846 to about 1870, because the domestic production was low, and the imports from Europe were not enough;
- The situation from 1870 onwards, was of sufficient wheat, and this improvement was caused by massive imports from the United States, and other countries outside Europe.
All the figures in this investigation come from sources of the nineteenth century. They are either officially reported figures, or quantitative verbal expressions by experts of the time. These last are certainly valid, because THOSE PEOPLE WERE THERE, AND WE WERE NOT THERE.
The arithmetical conclusions of this investigation are:
- From 1816 to 1838, domestic wheat production was enough to cover the requirements of the population; in only four years were there imports of more than 5 per cent of the demand;
- In 1820 to 1825, and from 1833 to 1837, there were practically no imports; in 1833 to 1836, there was such an excess of production from the harvest, that large quantities of wheat had to be given to horses and cattle;
- From 1839 to 1880, wheat was imported in large quantities, increasing from 25 per cent to 40 per cent of the total consumption;
- Domestic wheat production was maintained at between 10,000,000 and 15,000,000 quarters during the whole period;
- Per capita consumption was in the range of 6.0 to 7.2 bushels yearly per average person, or 1.0 to 1.2 pounds of bread daily per average person, or 1.3 to 1.6 pounds of bread per adult male.
- The above amounts were taken to be enough for the energy requirements of the average person;
- It is not possible to find data for the years in the period 1816 to 1880, as to the additional human consumption of oats, barley, and rye.
Previous investigations
There are a few calculations of production of wheat in pounds / total population / day (data points of every 50 years) based on estimates of acreage and of yields per acre, by: Broadberry (2011); Floud, Fogel, Harris, Hong (2011); Muldrew (2011); Harris, Floud, Hong (2015). These estimations do not make use of reports describing harvest volumes, or of contemporary observations as to amounts eaten by the people.
An important improvement in this investigation, is that the proportions for seed reserve, milling, distribution, and wastage are taken from nineteenth-century sources (see the discussion some pages below: “Parameters”). This proportions are much less than those used in the investigations noted in the table above. The following table shows in each first line of numbers, the production as calculated in the investigations, and in the second line, the corrected values according to the contemporary information.
| Broadberry (2011) | 1800/9 | 1850/9 | |
| Production volume, net of seed reserve | 0.61 | 0.66 | |
| Floud, Fogel, Harris, Hong (2011) | 1800 | 1850 | |
| Seed reserve 14.5 %, milling and distribution 38 % | 0.48 | 0.46 | |
| Seed reserve 2 ¼ bushels p acre, milling 20 %, wastage 0 | 0.65 | 0.64 | |
| Muldrew (2011) | 1800 | ||
| Production volume, without subtractions | 0.81 | ||
| Seed reserve 2 ¼ bushels p acre, milling 20 %, wastage 0 | 0.57 | ||
| Harris, Floud, Hong (2015) | 1800 | 1850 | |
| Seed reserve 14.5 %, milling and distribution 38 % | 0.48 | 0.46 | |
| Seed reserve 2 ¼ bushels p acre, milling 20 %, wastage 0 | 0.65 | 0.64 |
After the adjustment, the values per diem for 1800 and 1850 are 0.65 to 0.70 pounds / total population / day.
The present investigation gives us figures to compare with the data in the above table, of production in 1800 = 1.00, in 1850 = 0.80; and consumption in 1850 including imports = 1.20.
Inspected Markets
From 1829 onwards we have as a data source, the Corn Returns, which were the quantities in bushels and the prices registered of the farmers’ sales in the main towns in England and Wales. The list of towns from 1829 to 1842 included 150 points of sale, in 1843 to 1864 there were 290 towns, and from 1865 there were the same original 150 towns.
One might suppose that it would be possible to estimate the total amount of domestic wheat sold in a year, in all the markets of the country, taking the sales in the Inspected Markets, and multiplying by a constant.
Mr. J. T. Danson did this for the years 1844 to 1854, multiplying the sales in Inspected Markets by a factor of 14 / 5. Unfortunately, we do not know how he decided the factor of 14 / 5.
(On the Current Price, and the Cost Price, of Corn, in England, during the Last Ten Years, as Illustrating the Value of Agricultural Statistics; Journal of the Statistical Society of London, Vol. 18, No. 1 (Mar., 1855), pp. 3-20; https://www.jstor.org/stable/2338121)
Susan Fairlie in 1969 suggested using a factor of four times, for the periods 1829-1830 to 1841-1842, and for 1865-1866 and later. But also here, we do not know the origin of the multiplication factor.
(The Corn Laws and British Wheat Production, 1829-76; Economic History Review, 1969; https://www.jstor.org/stable/2591948)
We cannot be sure that these multiplicative factors correspond to the relation (generalized over a number of years) between the total wheat sales in the country and the sales in the Inspected Markets. But the advantage is that these are actually sales of each year, and thus show the consumption by the population. The yearly numbers in this investigation are based on the estimated harvest production in each case, and thus are inflated in the cases of high harvest amounts, which could not be eaten in the same harvest year.
But the good news is that the “Danson/Fairlie” figures and the numbers in this investigation, are close to one another. This gives us a high probability that these numbers do correspond to the real total harvests / sales in each year. There can be differences between the two series in some cases, because one is physical harvest, and the other is sales.

GRAPH 1: Wheat Sales Domestic Production, Comparison Available for Sales against Danson / Fairlie (Quarters per Harvest Year).
The Available for Sales curve and the ‘Danson / Fairlie’ curve both show the high amounts in 1833 to 1836, when the harvest was very large, to the extent that the excess amount had to be given to pigs, cattle, and horses; also the low amounts in 1838-1839 which caused deaths in those and subsequent years, and were part of the recession up to end 1842. There are differences in the absolute figures for the period from harvest years 1835-1836 to 1845-1846. We can be sure that the ‘Danson / Fairlie’ numbers in these years are wrong in an absolute sense; the imports were high in those years, and if the ‘Danson / Fairlie’ numbers were right, then the total amount available for consumption would be excessive.
Liam Brunt
Liam Brunt published a paper in 1999, on Estimating English Wheat Production in the Industrial Revolution. This attempted to calculate the yearly wheat production from 1700 to 1860, using estimated inputs from yields, crop rotation, acreage, and “weather shocks”.
a
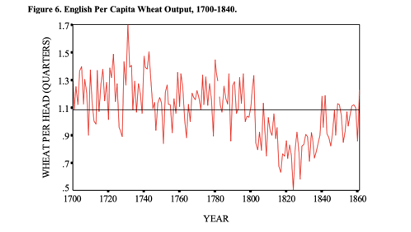
Unfortunately, the resultant graph gives us values of 1.2 to 1.4 quarters per person per year (1.5 to 1.8 pounds per day) in 1700 to 1780, that is, in a period when only 60 per cent of the population ate wheat (the rest: barley, oats, rye); this would mean a total consumption of all types of cereal of 2.6 pounds per average person per day, which would not be possible to digest.
Further, it is not clear how the yearly domestic output increased by 50 per cent from the 1820’s to the 1840’s (in 1822, the real harvest was so large, that the price of wheat was at its lowest in 25 years).
Parameters
The investigations commented at the beginning of this paper, and which used the gross and net amounts of harvest, required assumptions for: reserve for seed, loss in milling the grain, wastage from storage and transport. Following we have amounts for these parameters, taken from publications of the period. These numbers are much smaller than those utilized in the investigations alluded to, and thus the net amounts available, as there shown, are much too small.
- Reserve for seeds for the following year
“The quantity of grain used for seed corn is generally estimated at about six weeks consumption.” [12 %]
Commons Committee, First Report on the High Price of Provisions, 1800
In a number of tables of the following report, the figure of 2 ¼ bushels per acre is given as a component of the operating costs. Batchelor, Thomas (Farmer), Expense and Profit of Arable Land, in: Board of Agriculture, General View of the Agriculture of the County of Bedford, 1808, p. 70 et seq.
In the “Home Produce, Imports, and Consumption of Wheat” by Lawes and Gilbert, an amount of 2 ¼ bushels per acre was subtracted from the gross yield.
In this report, we use a subtraction of 10 %.
2. Loss in milling the grain.
The absolute maximum amount (biological) of endosperm which can be extracted from the seed is 83 per cent.
In 1800, experiments were carried out by instruction of the Select Committee of the Commons on the High Price of Corn, which gave figures very close to 80 per cent.
According to the following source, the fraction which was generally extracted was 80 per cent.
“H” (not identifiable), Of the Quantity of Bread-corn required yearly to maintain the Inhabitants of Great Britain, The Farmer’s Magazine, Edinburgh, 1801, p. 132
3. Wastage
There could not have been much wastage due to animal pests. The sheaves were kept in places where it was difficult for the rats and mice to enter (some buildings were on posts). The grains after threshing were kept in closed sacks, both in the barn and in transport. About one half of the wheat was consumed on the farm or in the nearby village, so only the other half might have had some sort of damage in the journey to the place of consumption. In any case, in the great part of our period, the medium length journeys were made in canal boats, so there could not be much damage from the movement. There are no mentions of mold on the grains (a few cases on the growing plants).
It does not seem plausible that the inhabitants of the technologically most advanced country in the world at that time, would accept a 10 to 15 % reduction in the volume of food that they could eat – or that the farmers could sell – just because they did not know how to take precautions in storage and transport.
See “Practical Agriculture; or a Complete System of Modern Husbandry” (1805) by R. W. Dickinson, in which the author devotes 25 pages (pp. 788 – 813) to all the necessary precautions to avoid losses in cutting, collecting, thrashing, and storing the wheat.
Detailed contemporary calculations of production and consumption do not mention any losses due to “wastage”.
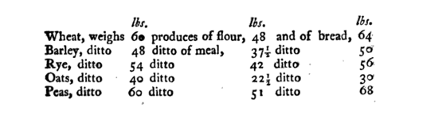
Units
A quartern loaf of bread was – by statute – made from 3 lbs. 8 oz. of flour, and weighed 4 lbs. 5 oz. for sale to the public.
1 quarter = 8 bushels = 480 pounds
1 bushel = 60 pounds
1 million quarters of wheat was food enough for 1,200,000 persons in one year.
The «Harvest Year» was counted from the date of the harvest, i. e. the Harvest Year 1829-1830 was from September 1829 to August 1830.
Sources
The first estimate that we have of the real human consumption of cereals is from Charles Smith in 1758, as follows. He made the calculation on the basis of the real food habits of laborers (he has about 20 pages of detailed information).
Numbers of the People. Consume annually each. quarters bushels
3,750,000 Wheat 1 0
739,000 Barley 1 3
888,000 Rye 1 1
623,000 Oats 2 2
(Charles Smith, Three Tracts on the Corn-Trades and Corn Laws, J. Brotherton, London, 1758, p. 140)
For the year 1800 we have a detailed estimation of the quantity of cereals required in Great Britain: “H” (not identifiable), Of the Quantity of Bread-corn required yearly to maintain the Inhabitants of Great Britain, Farmer’s Magazine Edinburgh, 1801, pp. 131-139.
The calculation is made out for an assumed population of 10,000,000, in a normal year around 1800 (exactly 1799 and 1800 were bad years, with harvests 25 per cent below normal).
Production of wheat 7.5 million quarters, and of other grains 4.1 million quarters.
Consumption of wheat bread per person who ate wheat = 22.7 ounces per day (p. 133), and over the whole population = 16.8 ounces (p. 137).
It is supposed that no imports are necessary.
For the years 1801 to 1815, it was/is impossible to quantify the production, as we do not have any contemporary statements of the format: “the harvest was X % less/more than a normal year”.
The sources for the volumes of harvest production and of sales from the farmers are the following. The difference between the two numbers was the amount of seed retained for a reserve for planting for the next year, and this was about 10 per cent of the harvest figure.
| Year | Harvest Production and Sales Wholesale | |
| 1816-1817 to 1828-1829 | Mr. Jacob, Inspector of Corn Returns, own official investigation, Available for Consumption | |
| 1828-1829 to 1831-1832 | Mr. Jacob and Mr. Hodges, Select Committee on Agriculture, 1833 | |
| 1832-1833 to | Mr. Tooke, A History of Prices, | |
| 1854-1855 | Yearly changes in harvest quantities | |
| 1855-1856 to 1867-1868 | Lawes and Gilbert, On the Home Produce …., 1868, available product | |
| 1868-1869 to 1879-1880 | Agricultural Statistics, The Corn Crop, Journal of the Statistical Society of London, Dec. 1880, Available Product |
In the third case, the original document gives the production figure, and this text subtracts 10 per cent seed reserve to give the sales quantity. In the other cases, the original document gives the sales figure, and this text adds 10 % seed reserve to give the production quantity.
Mr. William Jacob, Inspector-General of Corn Returns, 1816-1827
The first data that we have on an annual basis, are those of Mr. William Jacob, the Inspector-General of Corn Returns, who in 1828 made a detailed calculation to be presented to Parliament (having corresponded in writing with many of the important landowners and traders) of the production for the years 1816-1827. He gives figures from 11,000,000 to 13,000,000 quarters for England and Wales, with the exception of 1816 of 9,000,000 (the “Year without a Summer”) and of 1820 with 16,000,000 million. He says that he is convinced of the exactness of the relation between the production of the different years, and takes as a basis a consumption of 12,000,000 quarters in a normal year, “though I have reason to believe that what is used as food somewhat exceeds that quantity”. He also gives an arithmetical conciliation of production, consumption, imports, seed reserve, and stocks for these years.
(quoted in Tooke, Vol. V., p. 103.)
Mr. Jacob and Mr. Hodgson, Select Committee on Agriculture, 1833.
“Do you bear in mind how much the harvest of 1816 was deficient?” “I believe very nearly three months’ consumption, perhaps four months; the harvest of 1828 was deficient, in my judgment, rather more than six weeks’ consumption.”
(Select Committee Agriculture, 1833, Mr. Jacob, Q. 52, p. 5)
“Is it not the case that the seasons since 1828 have been all deficient, and pretty nearly equally so?” “No, the year 1828 was certainly deficient; the year 1829 was deficient about its average; the year 1830 about the same; the year 1831 about the same; 1832 would have been deficient, but that the harvest happened one month earlier than usual.”
(Select Committee Agriculture, 1833, Mr. Jacob, Q. 72, p. 8)
“Is the Committee not to infer that the diminish [sic] in supply of home growth must be ascribed to some other cause than the seasons?” “I mean to say that I am unable to ascribe the deficiency to season, or any other particular cause, but to state the fact that the four years from 1828 to 1831 have been seriously below an average; on the aggregate 9 per cent., and 1828, the most defective of the series, about 15 per cent. below an average.”
(Select Committee Agriculture, 1833, Mr. Hodgson, Q. 719, p. 38)
Mr. Tooke, “A History of Prices”
Mr. Tooke was a corn merchant, a writer on finance, and an expert witness to Parliamentary Committees; he wrote “A History of Prices” in six volumes referring to financing, banks, liquidity in the country, and the corn trade. For the years 1832 to 1855, we use the reports of Mr. Tooke about the volumes of wheat brought to market, usually as comments of the increase or decrease against previous years.
The basis for the absolute harvest volumes, comes from his information about the years 1834 to 1838, as follows:
“As every part of the ground of the estimate of the supply is vague, so likewise is that for an estimate of consumption. The average consumption of wheat as food for man, and consequently excluding the extra consumption of it for cattle and other purposes, in 1834-35, has been variously estimated by some as 8 bushels per head of calculation, while by others it has been thought to be more nearly 6 bushels. This last, which appears to me to be the most reasonable computation, would, for the present estimated population of Britain, (being, if the ratio of increase has continued since 1831, about 18 millions of souls,) at 6 bushels each, be 13,500,000 quarters, which, with the quantity requisite for seed, would make the aggregate produce required for consumption as food and seed about 15,000,000 of quarters, rather perhaps more than less. The produce of 1835-6-7 having been, by the excess of the two former seasons, against a bare average in 1837, probably an aggregate average of 16,000,000 of quarters, the deficiency of 1838, if taken in comparison with those three years, and estimated at one fourth less, would be 4 millions of quarters, and if taken with reference to the mere necessary consumption, would leave a deficiency of somewhat about 3 millions of quarters, as the minimum to be made up by foreign supply.
……
There is reason to believe, from the surveys at the time, from concurrent testimony of farmers, and from the large quantities of wheat of 1834 which were in the markets during the two or three following years, (not only as may be supposed by the population being in the fullest employ at good wages, but for cattle-feeding and other unusual purposes) that the produce of that crop was more nearly a third than a quarter, that is, more nearly 5 millions than between 3 and 4 millions of quarters, above an ordinary crop. The difference, therefore, between the crops of 1834 and 1838, must have been something like 7 to 8 millions of quarters.” (Vol. III, pp. 12-13)
The population of England and Wales in 1835 was about 15,000,000, and that of Scotland was 2,700,000. Then the ‘normal’ consumption in Britain in 1834-1835, on the basis of 6 bushels would have been about (15,000,000 + 2,700,000) x 6 = 106,000,000 bushels or 13,275,000 quarters. Practically 100 per cent of the population of England and Wales, but only about 30 per cent of the population of Scotland ate wheaten bread, so that in all Britain the consumers were 15,000,000 + (2,700,000 x 0.30) = 15,810,000. The per capita consumption of the wheat-eaters in Britain would have been about 13,275,000 / 15,810,000 = 0.84 quarters or 6.7 bushels. The total normal consumption in England and Wales would have been 15,000,000 x 0.84 = 12,600,000 and thus the harvest quantity would have been 12,600,000 / 0.9 = 14,000,000 quarters.
But Tooke estimates that the real production from the harvest of 1834 was about 30 per cent above a normal crop, and thus would have been 14,000,000 x 1.3 = 18,200,000 quarters. In our calculations, we have put a round figure of 18,000,000. The figure for the 1838 harvest is given as 9,500,000 quarters, which is 6,500,000 less than 1834.
Lawes and Gilbert, 1855-1856 to 1867-1868
These gentlemen were two agricultural scientists who had some plots of land at Rothamsted, on which they grew wheat, with different characteristics of the soil, and of the manure, and of the general maintenance of the plots. The characteristics for each plot were held the same over many years. Particularly, the variety of wheat was the same in each plot. Each year, they calculated the yield per acre, and the average over all the plots.
They made a calculation of the theoretical production of each harvest-year, as per the following definitions.
The acreage for the country in their report was formed by interpolation between the estimate of Mr. Caird in 1850 of 3.4 million acres in England and Wales, and the Agricultural Returns of 1866 of 3.1 million acres.
The Yields per Acre were taken from the yearly data of the plots at Rothamsted.
Harvest Production is the multiplication of Acres with Yield per Acre
Available for Consumption results from subtracting 2 ¼ bushels per acre for the seed reserve.
The principal report of Lawes and Gilbert gives us a reverse-calculation of some of the data for the periods of Harvest Years 1852-1853 to 1859-1860, and 1860-1861 to 1867-1868.
Agricultural Returns of 1866 and 1867
Very important documents for “anchoring” our data are the Agricultural Returns of 1866 and of 1867. These gave a large number of figures as to acreage and gross yield per acre, and thus the total harvest production, in that year. They reported upon the whole country on the basis of physical count (the total printed report was 500 pages). See the section of ‘Acreage’ below. The acreage of wheat in England and Wales in 1866 was 3,240,000.
Agricultural Returns 1868-1869 to 1879-1880
For 1868-1869 to 1879-1880, we have numbers taken by physical count of acreage and estates of yield per acre, each year, in the official Agricultural Returns, with the same processes as the Agricultural Returns of 1866-7.
Harvest (net of seed), England and Wales
Yields in Bushels per Acre
Our contemporary sources are:
| Year | Yields in Bushels per Acre | |
| 1816 to 1838 | Physical counts in different parts of the country by Cropper, and by Sandars | |
| 1839 to 1841 | [Interpolation of the value “28.0”] | |
| 1842 to 1866 | Average of 22 farms and experimental stations, as given in the “Agrarian History of England and Wales” | |
| 1867 to 1880 | “The Corn Crops of 1880”, Journal of the Royal Statistical Society, Dec. 1880 |
The yields of wheat, measured in bushels per acre, changed considerably from year to year, and from county to county. Thus it is/was difficult to assure a figure over the average of the country in a given year, and to distinguish a continuous movement of the figure through the years.
The figure quoted for production was usually “before reserve for seed” (for the next year’s planting), but for our reconstruction of food consumption we have to use “after reserve for seed”, which was about a 10 % decrement.
As to an estimation of the real unit yield of wheat in each year, Mr. Thomas Tooke describes a physical investigation made yearly by wheat merchants, Cropper, Benson, and Company, from 1813 to 1836, and a Mr. Sandars (who took over their company) from 1837 to 1855.
“The surveys were set on foot for a purely business purpose – namely, of placing before the members of the firm, as authentic a statement as possible of the probable yield of the harvest of England in each year; the materials of the statement being collected by persons more or less competent – travelling for the express object, a short time before the harvest, always through the same selected districts of country; pursuing year by year the same methods of observation and confining themselves rigidly to the single question of the yield per Acre of Wheat, as stated in Bushels of a weight of 60 lbs. each.”
(Tooke, A History of Prices … 1848-1856, 1857; p. 119)
“What are the districts of country generally included in this survey of 1,000 miles?”
“We have generally commenced in Kent, and gone down the whole of the east coast down to Berwick, and once or twice to Edinburgh, as one part of the survey; the others we have taken from Liverpool through Cheshire, Shropshire, Worcestershire, Herefordshire, round by Birmingham, and taken in the whole of Warwickshire and Staffordshire, and come round in that circuit here again.”
(Agricultural (Commons) Committee, 1821, page 263. Evidence of David Hodgson, Esq., 12th April, 1821; quoted in Tooke, op. cit., p. 121)
“In what way did you make that Survey?” “Men are sent all over the country, and they are provided with a machine that cannot err; by a movement made it embraces a certain space, the stalks in that space are counted, the number of grains is counted and then weighed.”
(Agricultural Commons Committee, 1836, Evidence of Mr. Sandars; quoted in Tooke, op. cit., p. 121)
(Actually a metal grid one yard square was thrown at a random position in the field)
It must be clear that this survey was the most exact that could have been made in those years, and that the merchants were convinced of the usefulness of the work, otherwise they would not have paid out the salaries of the employees.
For 1842 to 1866, we use here a study of the average values in 22 farms and experimental stations (The Agrarian History of England and Wales, ed. E. J. T. Collins, Joan Thirsk, Vol. VII, Part 2, p. 134). This is to be preferred to the Rothamsted data, which refer to the same wheat variety and the same soil, from year to year, and therefore only show the effect of the weather from each year. The following information shows the real changes in the farming techniques in the country.
Acreage
| Year | Acreage under Wheat | |
| 1816-1817 to 1851-1852 | Division of data of production by gross yield per acre | |
| 1852-1853 to 1867-1868 | Lawes and Gilbert, On the Home Produce …., 1868, Area under Crop | |
| 1868-1869 to 1879-1880 | “The Corn Crops of 1880”, Journal of the Royal Statistical Society, Dec. 1880 |
The experts on the matter – Mr. Jacob, Mr. Porter, Mr. McCulloch, and Mr. Caird – all said that they had no idea how one could proceed to a true calculation of the acreage under wheat. Fairly close figures are only available from 1852-1853 onwards, calculating backwards from the physical count in the Agricultural Returns of 1866.
One would expect that the acreage in each of the earlier years could be calculated from the division of the harvest production by the gross yield per acre. Unfortunately, the numbers of acres are not consistent through time; the numbers move between 3,500,000 and 4,800,000. We do know that the amount cultivated each year changed by ten per cent or more, depending on the plans of the farmers, but the differences shown are of a different magnitude.
We do know that there was an impressive increase in the wheat acreage from 1794 to 1815, due to the Enclosures.
“The number of enclosures therefore, during the war [1794 to 1815] exceeded in round figures 1760. Now if we take the average number of enclosures at an extent of between 750 and 1,000 acres, each enclosure, the total number of enclosed acres will exceed a million and a half, of which it is certainly not too an estimate to assert, that at least 1,000,000 acres, of the newly enclosed land were employed in the growth of corn. But if we take the average produce per area so low as two quarters, here will be 2,000,000 quarters of corn added to the annual growth of the country.” (p. 36)
Anon. Inquiry into the Capacity of Government to administer Relief to Agricultural Distress. Printed, J. Hatchard and Son, London, 1822
Imports
Our documentary sources are:
| Period | Import Volume from Ireland | |
| 1815-1849 | Porter, Progress of the Nation, 1851, p. 345 | |
| 1850-1863 | Thom, Statistics of Ireland, 1864 |
| Period | Import Volume from Rest of World | |
| 1816-1827 | Porter, Progress of the Nation, 1851, pp. 138-139 (calendar years) | |
| 1828-1847 | Tooke, Vol. IV, p. 416 (harvest years) | |
| 1848-1852 | Tooke, Vol. VI, Appendix 4, pp. 451-453 | |
| 1853-1866 | Lawes and Gilbert, Home Produce, 1868 | |
| 1867-1880 | Agricultural Statistics, The Corn Crop, Journal of the Statistical Society of London, Dec. 1880; subtracting estimates of imports by Scotland and Ireland |
The numbers came originally from the monthly reports of the Customs-Houses. Yearly reports from the British Government show the data per calendar year. Some reports and comments by agricultural experts or corn traders use a total for the harvest year (September to August).
Calculated Consumption per Capita per Day
The consumption of wheat grain per capita per day, is obtained by dividing the consumption of the year by the population (Census of England and Wales, with interpolations), and by 360.
The consumption of wheaten bread per average person, is obtained by reducing the consumption of grain by 20 % (representing the husk), and increasing the weight by (4.3 / 3.5), this being the statutory ratio of the weight in pounds of the quartern loaf to the weight of the grain employed.
Results
Production, Imports, Consumption of Wheat, 1770-1880, England and Wales
The amount harvested in England and Wales (net of seed reserve) from 1816 to 1880, was in practically all the years in the range of 10,000,000 to 15,000,000 quarters, and showed no tendency to increase or decrease.
The data show the low harvest (9,000,000) in 1816, which was the “Year without a Summer”; the extremely high harvests in 1820–1821, which caused the low price in 1822; the low amounts in 1829 to 1830, due to the heavy rains; the high amounts in 1834-1836, which were so high that the excess was fed to cattle and pigs; and the low amounts in 1839, which were a partial cause of the Depression in 1839-1842.
Domestic production / requirement
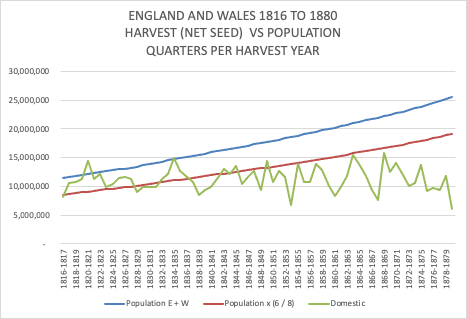
The following Graph shows the harvest production net of seed, compared with the population of England and Wales. The numbers on the left side refer to the harvest amounts in quarters, and to the population of England and Wales, for the different lines.

If we suppose that the people ate on average 1.0 quarters (8 bushels) of wheat per year, then the comparison between the “Domestic” line and the “Population E + W” line gives an idea as to how much of the food requirements would have been covered by domestic production. If we suppose that the people ate on average 6 bushels of wheat per year, then the comparison between the “Domestic” line and the “Population x (6 / 8)” line shows if the requirements would have been covered by domestic production.
It is probable that the real consumption was around 6.6 bushels per year during the period (1.1 pounds of bread per day).
We see that the domestic harvest production was generally enough for the national food consumption up to 1838, with the exception of 1829 and 1830. The production was absolutely not enough in the period starting in 1838, and thus it was necessary to import grain from Europe, and later, from North America.
Geographic origin of supplies
The following Graph shows the division by geographical origin of the estimated yearly consumption. We show a) the available sales amount, equal to the domestic harvest production less the seed reserve, b) the imports from Ireland, taken from official Customs reports, c) the imports from Europe and North America, taken from official Customs reports.
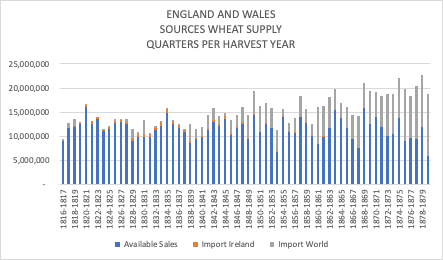
Up to 1838, there are very few imports from outside the British Isles (only in 1828 to 1830, due to the harvest losses from the heavy rains). From 1838, the domestic harvest plus Ireland remains fairly constant around 10,000,000 to 12,000,000 million quarters. Large-scale exports from the United States began in 1869.
Imports from Ireland and from the Rest of the World, were from 1816 to 1838 a small proportion of the total consumption. From 1838 the total imports were 25 % to 40 % of the consumption.
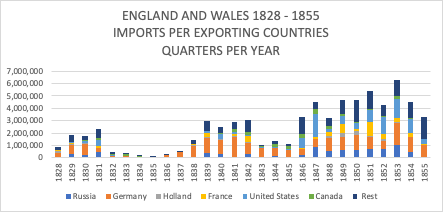
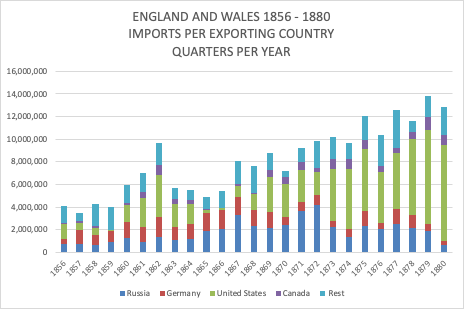
Up to 1864, 70 % per cent of the imports came from Russia, Germany, and the United States; from 1869, 70 % of the imports came from Russia and the United States.
Yield per Acre
The yearly “Liverpool Survey” figures for 1815 to 1855 are shown in Graph 5.
We see that the yield per acre was around 26 to 35 bushels (of 60 lb.) per acre in the period 1815 to 1839, and from 40 to 50 bushels per acre from 1840 to 1855. The authors of the reports were of the opinion that the above figures were somewhat too high, as these supposed that the whole of each field produced a full quantity of wheat, and the reality was that some parts of fields could not be properly sown; the correction proposed was to reduce the calculated yield by one sixth. Further, if we want to convert the figure of seed produced to the amount consumed by humans, we have to retain one ninth part for the seed reserve for the next sowing. This means that the effective yield, net of seed reserve, was about 20 to 26 bushels in 1815-1839, and 30 to 36 bushels in 1840-1855.
For 1815 to 1840, the numbers are fairly constant, and in some years, do reflect the good or bad harvests.
The figures from 1841 onwards would seem to be too high. But Mr. Tooke informs us that he did believe them, because he actually had a conversation with Mr. Sandars on the subject, and Mr. Sandars showed him the original of the book, where the data collected by his employees were noted. We do actually have today, the original of this book. This was discovered by Mr. Healy and Mr. Jones in 1962 in the archives of the Royal Statistical Society. The revision of these papers by Mr. Healy and Mr. Jones leaves no doubt that the work was carried out in a conscientious, exact, and consistent manner.
Wheat Yield bushels / acre («Liverpool Surveys»)

(The figures for 1841 are doubtful, see above)
(Multiply «yields» by 0.70, see above)
Mr. James Caird, having visited the majority of the counties of England in 1850-51, for a series of reports to “The Times”, calculated the average yield at 27 bushels per acre (Caird, 1852, p. 480). In 1866, the first complete Agricultural Statistics for the whole country were collected. On this basis, Mr. Caird calculated that the yield per acre at that time was close to 28 bushels (Caird, 1868, p. 130). This would be an increase of about 25 % against the 22 bushels in 1800-14.
Amount of wheaten bread per person per day
The daily consumption for each year is given in the Graph following.

“Smoothing” refers to an adjustment which theoretically has to be made, to change the y-coordinates from “harvest production in the given harvest-year”, to “effectively eaten in the given harvest-year”. We do not have these figures. The effect would be to reduce the “peaks” and the “valleys” shown.
There are four principal observations about these data:
- The data refer to consumption of wheat, that is, the division of the available amount of wheat in the country, plus the imports, by the number of the total population;
- We do not know how much the total population ate additionally of oats, barley, and rye; this may have been ten per cent in 1815, and five per cent in 1850;
- The average consumption is given by Caird at 1 ¼ pounds of bread daily (all cereals) for each family member; we may suppose that the persons in a good financial situation ate more of other sorts of food and less of bread; then the poorer persons would have eaten more than 1 ¼ pounds of bread;
- The amount of per capita consumption of bread, is a theoretical calculation, supposing that everyone ate fine white bread; in fact, the agricultural labourers ate fine wheat bread, the industrial workers and the middle class ate “household bread”, and the soldiers and the convicts ate “brown bread”; the two last descriptions retained a certain proportion of bran, so that the bread “filled the stomach”, although the calorific content was not much greater.
The resulting consumption numbers are fairly constant during the period 1816 to 1880, at 1.0 to 1.2 pounds of bread daily per average family member, or 1.3 to 1.6 pounds per average adult male. This concurs with descriptions from the period, which mention typical consumption of little more than one pound per day.
In the majority of years from 1794 to 1821, due to weather problems, the harvest was not sufficient in quantity or in quality. This caused hunger, but not deaths from starvation (there were some thousands of additional deaths in 1794-5 and in 1799-1800, from pneumonia and fevers, acting on people weakened by the hunger).
| Year | Harvest Quantity | Harvest Quality |
| 1790 | Peace and favourable Seasons | |
| 1791 | “ “ “ “ | |
| 1792 | “ “ “ “ | |
| 1793 | War but favourable Seasons | |
| 1794 | Deficiency of crop | |
| 1795 | “ “ “ | |
| 1796 | Season less unfavourable | |
| 1797 | “ “ “ | |
| 1798 | “ “ “ | |
| 1799 | Bad season | |
| 1800 | » « | |
| 1801 | Good crop followed by Peace | |
| 1802 | Favourable crop | |
| 1803 | “ “ | |
| 1804 | Deficient crop | |
| 1805 | Average Crops | |
| 1806 | “ “ | |
| 1807 | “ “ | |
| 1808 | Partial deficiency | |
| 1809 | Great deficiency | |
| 1810 | Good crop | |
| 1811 | Deficiency | |
| 1812 | Favourable Crop | |
| 1813 | “ “ | |
| 1814 | Nearly average crop | |
| 1815 | Full average Crop | Quality good |
| 1816 | Great and General Deficiency | Very bad quality; nearly rotten |
| 1817 | Not exceeding average Crop | Quality not very good |
| 1818 | “ “ “ “ | Quality very good |
| 1819 | Somewhat below Average Crop | Quality good; but not so good as 1818 |
| 1820 | Exceedingly average Crop | Sound and dry |
| 1821 | Average Crop | Very inferior; much injured by wet |
| 1822 | “ “ | Very good; harvest remarkably early |
| 1823 | Scarcity | Inferior; wet harvest after a cold spring |
| 1824 | Average | Quality indifferent |
| 1825 | Nearly an Average | Very good; fine dry summer |
| 1826 | Average Crop | Quality of the wheat excellent |
| 1827 | “ “ | Quality various, but mostly inferior |
| 1828 | Scarcity | Bad; damaged by wet weather |
| 1829 | Average | Bad; fully as much so as 1828 |
| 1830 | Full Average | Quality various; some injured by wet |
| 1831 | Nearly an Average Crop | Very similar to that of 1830 |
| 1832 | Above an Average Crop | Quality good |
| 1833 | “ “ “ “ | Quality very fine |
| 1834 | “ “ “ “ | Quality good; but hardly equal to 1833 |
| 1835 | Considerably above an Average | Middling; injured by heavy rains |
| 1836 | Above an Average | Quality good in England and Wales |
| 1837 | Under an Average Crop | Middling |
| 1838 | Bad | |
| 1839 | Bad | |
| 1840 | Middling | |
| 1841 | Very inferior | |
| 1842 | Very good | |
| 1843 | Various | |
| 1844 | Moderately good | |
| 1845 | Indifferent | |
| 1846 | Indifferent | |
| 1847 | The quality fair | |
| 1848 | Bad; worse in the south than in the north | |
| 1849 | Good | |
| 1850 | Indifferent | |
| 1851 | Good | |
| 1852 | Injured by wet in the south | |
| 1853 | Very bad | |
| 1854 | Good throughout | |
| 1855 | Indifferent |
(“Harvest Quantity”: Journal of the Royal Statistical Society, Vol. 1, 1839, p. 56-57)
(“Harvest Quality”: Tooke, A History of Prices … 1848-1856, p. 131)
General Idea of Consumption per Capita
The figure of 1.0 quarters per year per person (9.3 lbs. a week, or a little more than 2 quartern loaves), or a little less, was taken to be a reasonable amount to be eaten by an average person, at the end of the eighteenth century. It was the amount of bread to be given to a pauper without family, but often without any other food; also the menservants in houses were given 2 quartern loaves per week, plus some meat and vegetables.
“In our present established modes of living, bread is an indispensable article, of which every one expects his fill, which cannot in general be restrained, or limited in quantity, without causing clamour and complaint; and this generally made of good wheat, without any mixture; the quantity made from oats, barley, and other grain or pulse, being but a small proportion of the whole. Respecting the quantity necessary to each individual, various estimates have been formed; eight bushels per annum has been reckoned, but this is certainly too much, and more than necessary. The late Dr. Withering reckoned that a labouring man, who lived chiefly on bread, would consume a pound weight a day; this allowance for a year, I believe, he made from six bushels of good wheat; but women and children require, in general, less. In a Report from the Birmingham Union Mill, a quartern loaf and a half per week, to each individual of a family, is stated as a good allowance; and this agrees with my own observations upon the consumption by grown persons; but I think that children and old persons require less, where they have plenty of potatoes, as well as others who have plenty of animal food and beverage; and am of the opinion that to one half of mankind, the full grown, healthy and active, one pound of bread each day may be required; and that to the other half, women, children, and those who have plenty of other food, ¾ lb. per day is sufficient, making the average 14 oz. per day, or 320 lb. per annum.»
(Pitt, 1806, p. 284)
“What do you conceive to be the average consumption of wheat in the British islands?” “I have looked at the subject; formerly, five or six years ago, I calculated it was about six bushels per head for the population.” (Select Committee on the State of Agriculture, 1837, p. 13; question to Mr. W. Jacob, Comptroller of Corn Returns in the Board of Trade).The figure is only for wheat, not the total of cereals, and averaged over all the United Kingdom; thus the figure for England and Wales, and for all cereals, would be somewhat higher.
The question as to whether this amount of wheat produced was sufficient for the appetites of the population, is resolved by Mr. Tooke for the years 1833-1835, in which he says there was a surplus that was actually not eaten by the people:
“The hypothesis, that an unusual abundance of wheat causes an immediate expansion of its consumption as bread, would have entitled us to expect that the surplus wheat produce of the years 1833 to 1835, or the greater part of it, would have been applied in that way. But the facts of the case did not bear out such an anticipation; for so little impression did the extra consumption, as food for man, make upon the extra supply, that wheat in 1834 and 1835 was used to a considerable extent for the purpose of feeding cattle, and sheep, and pigs, and for brewing and distilling. It is true that in consequence of the dryness of the summers of 1833 and 1834 the crops of spring corn were short, and fetched higher prices than usual, relatively to wheat. But still the fact remains, that Wheat, cheap as it was, cheaper than it had been for fifty years before, with a greatly increased population to feed, proved to be, even at extremely reduced prices, so unequivocally in excess of thedemand for it as human foodas to render necessary the adoption of unusual and inferior methods of absorption; …”
(Tooke, op. cit.; p. 74)
Corroborated by:
“Are you aware that any quantity of wheat has been consumed in feeding cattle?” “Immense quantities of all descriptions of corn.”
(Select Committee on Agriculture, 1837, Mr. George Trumper, Land agent, Middlesex, p. 170; examined on 8th March 1836)
“Have you the means of knowing if the increase in wheat has not been occasioned in those counties by its being grown on that land on which they used to cultivate oats?” “I think not; the crops of wheat for 1832 and 1833 I compute as having been crops yielding a supply sufficient for the consumption of the country.”
“From England and Ireland?” “Yes; 1834 the crop greatly exceeded the consumption.”
“What do you say of 1835?” “It was an average, and not producing what I should think would be equal to the consumption of the year.”
(Ibid, p. 102; Mr. David Hodgson, Corn merchant, Liverpool)
It is not exactly true that the consumption of cereals per capita remained constant. The proportion of (eaters of wheat + barley + oats + rye) to only eaters of wheat changed from 1.50 in 1800 to 1.15 in 1850. On the other hand, the population was eating more meat, dairy products, vegetables and fruit in 1850.
Mr. James Caird, having visited the majority of the counties of England in 1850-51, for a series of reports to “The Times”, calculated the average yield at 27 bushels per acre (Caird, 1852, p. 480). In 1866, the first complete Agricultural Statistics for the whole country were collected. On this basis, Mr. Caird calculated that the yield per acre at that time was close to 28 bushels (Caird, 1868, p. 130).
Mr. Caird also made a comparison of the minimum healthy diet per person of bread, potatoes, and meat, with the real data calculated from the Agricultural Statistics of 1866. The required consumption was, according to his sources, one pound of bread per day, one pound of potatoes, and six ounces of meat. The real consumption was one pound of bread, one pound of potatoes, and only two ounces of meat, over the average of the United Kingdom. The real consumption in England, Scotland and Wales was 1 ¼ lb. of bread and ½ lb. of potatoes; the real consumption in Ireland was ¼ lb. of bread and 4 ½ lb. of potatoes (unfortunately, no figures per country for meat) (Caird, 1868, p. 142).
He also commented on the logical necessity that the consumption of bread per capita should remain constant through the years. “[the opinion of Mr. Newmarch, with which I concur] … is that the consumption of bread is very constant, that everything is given up before bread, and that bread being the staff of life it must be had by the people whatever the price may be. This view is confirmed by inquiries which I have since made among some of the leading bakers in the most densely peopled quarters in Whitechapel in the east, and the Harrow Road in the north-west, one of whom has been thirty years in the business, and now has three shops in a district entirely inhabited by the working classes. Their testimony is that the consumption of bread is now very large, for, although dear, it is still the cheapest article of food within reach of the poor, the next substitute, potatoes, being scarce and very dear.” (Caird, 1868, p. 134).
Consumption of Wheaten Bread, 1770-1880, by Occupation and by Region
As a “cross-check” to the numbers produced from the harvest estimates, we use numbers of consumption per head per head, from contemporary observations.
“To corroborate the estimate of eight bushels of wheat, I may observe that the magistrates in Suffolk with whom I have the honour of acting, upon the scarcity in 1795 and 6, made numerous and most careful inquiries in forty-two parishes of our division, in order to ascertain the general consumption; and we found it half a stone of flour per head per week, or a pound a day, or 49 lb. in seven weeks; call this a bushel a week, and it is 7 1-half bushels a year; but as an average bushel of wheat does not produce 49 lb. of flour, it is sufficiently near 8 bushels of wheat per annum.” [One pound of flour a day, is 1.3 pounds of bread per day]
(Arthur Young, The Question of Scarcity plainly stated, and Remedies considered, 1800, p. 43)
Mrs. Rundlell in the 1820´s wrote a series of well-received books on the management and costs of a house and family.
“It has been ascertained, in times of scarcity, that every adult person, having a due portion of other food, consumes more on average than a quartern loaf [4.3 lbs.] of Bread in a week. We state the consumption at upwards of one-fifth more, including flour for pastry and the other purposes of a family. …… At all times, 6 lbs. of Bread per week, per head, may be considered as the average consumption in a family.”
Rundell, María Eliza (attributed), A New System of Practical Domestic Economy: Founded on Modern Discoveries, and the Private Communications of Persons of Experience, A New Edition, revised and enlarged, with Estimates of Household Expenses, adapted to Families of Every Description, 1827, p. 450
Mrs. Rundell gives us a number of weekly budgets for home expenses for workers with good incomes, or lower middle-class (21 to 24 shillings income per week), in which she estimates bread at 24 lbs. per week for two adults and three children, and meat at 6 lbs. per week.
Mr. Charles Mott, who was the Assistant Poor Law Commissioners for Middlesex and Surrey in 1836, and reported on the conditions in the workhouses, decided that it would be useful to know the real consumption of bread and meat by the agricultural workers, in order to compare this with the food amounts in the workhouses; he had a survey carried out, of which unfortunately we do not have the details. It was generally supposed – and the survey confirmed this – that the daily amounts in the workhouses were larger than those eaten by the agricultural laborers.
“The agricultural labourers are unable to procure for themselves and families more than an average allowance per head of 122 ounces of food (principally bread) per week [1.0 pounds per day], of which we will suppose that the man consumes, as his proportion, 140 ounces per week, say 134 ounces of bread and six ounces of meat. Bread contains in round numbers 800 parts in 1,000, or four-fifths of nutritive matter, whilst the meat will yield but 333 parts in 1,000, or about one-third; they will give together 109 ounces per week, about 15 ½ ounces of nutritive matter per day as the consumption of an able-bodied labourer. These results were obtained from returns from labourers in the southern agricultural counties, and as they were selected with care, they may be fairly relied upon; they may, nevertheless, be objected to as insufficient data upon which to ground any general conclusion, inasmuch they may be said to be confined to one class, whose income does not average for the family more than 2s. per head per week, and to show what labourers can obtain, and do not prove that labourers would not consume more if they could get it.”
An extension of the survey to industrial workers with decent incomes in towns, showed that although these people did eat more meat (no figures given) than the agricultural labourers, they then ate less bread, so that the medical calculation of the total of nutritive matter was about the same.
(Second Annual Report of the Poor Law Commissioners for England and Wales, 1836, Report by Mr. Mott, p. 336)
“As a general expression it may be stated that the food obtained by the labouring classes in my district [Yorkshire, Notts, Cambridgeshire, Lincolnshire], consists of from 1 ¾ to 2 lbs. of bread-stuffs daily; ½ lb. of sugar or treacle weekly; ¼ to ½ lb. of butter or other fats weekly; 1 lb. to 1 ¾ lb. of meats weekly; ½ pint to 4 pints of milk weekly; 1 oz. of cheese weekly; and ½ oz. of tea weekly.”
(Smith, Dr. Edward, Dietaries for the Inmates of Workhouses, 1866, The ordinary Food of the Labouring Classes, pp. 55-57)
(These were workers in the rural areas of the stated counties. But the agricultural workers in the South and South-West were paid much less, and ate less.)
The amount of 1.1 pounds of bread per capita per day for the average person, concurs with the 1.1 pounds eaten by the workers in Lancashire in 1861, just before the Cotton Famine. Although the Lancashire workers had a position above the middle of the working class, their situation must have been close to the average of the whole population, i. e. including professional persons and the upper class.
Oddy, D. J., Urban Famine in Nineteenth-Century Britain: The Effect of the Lancashire Cotton Famine on Working-Class and Health, The Economic History Review, New Series, Vol. 36, No. 1 (Feb., 1983), pp. 68-86, see Table 3, p. 78. https://www.jstor.org/stable/2598898
Dr. Lawes wrote an article in 1855 in which he says that he investigated the daily consumption of foods by different groups in one day; the data were extracted from 86 different dietaries. The average yearly consumption of bread was 6 1/2 to 6 3/4 bushels [1.06 to 1.11 pounds per average person per diem]. It would have been very interesting to have the real consumption of bread in each case; unfortunately, the original documents of the dietaries could not be found in the Rothamsted archives. The list of groups is given in Figure 11.
(“On the Sewage of London”, Dr. J. B. Lawes, Journal of the Society of Arts, No. 120, Vol. III, 1855; Table II, pp. 265-267)
Mr. Caird made a comparison of the minimum healthy diet per person of bread, potatoes, and meat, with the real data calculated from the Agricultural Statistics of 1866, plus registered imports. The required consumption was, according to his sources, one pound of bread per day, one pound of potatoes, and six ounces of meat. The real consumption was one pound of bread, one pound of potatoes, and only two ounces of meat, over the average of the United Kingdom. The real consumption, as he calculated it, in England, Scotland and Wales was 1 ¼ lb. of bread and ½ lb. of potatoes; the real consumption in Ireland was ¼ lb. of bread and 4 ½ lb. of potatoes (unfortunately, no figures per country for meat) (Caird, 1868, p. 142).
Discussion
The important points to be revised are:
Are the arithmetical results reliable?
Did the country produce enough wheat?
By how much did the yield increase?
Do the arithmetical results coincide with the information about consumption per person?
Was the amount per person enough?
Were there groups of people who ate less than the one pound of bread per day?
Are the arithmetical results reliable?
The harvest production figures, as given directly by Jacob, Lawes and Gilbert, and Lawes, are the best calculations that these people could make. The numbers in the “Tooke years” are estimated by this author, on the basis of Mr. Tooke’s information as to the increases or decreases in each year. No one at the time could have made better calculations.
The amounts imported are taken from official reports, which give the numbers of quarters of wheat in the custom-house returns.
An important difference against the previous academic investigations, comes from the parameters for loss through milling, reserve for seeds to be used in the following growing season, and general wastage. The figures used in this document are considerably lower than those of the previous investigations, and thus the volume of wheat available for human consumption is larger. The loss due to milling, at 20 per cent, is equal to the weight of the husk, and was demonstrated in experiments reported to a Parliamentary Committee. The reserve for seed, at 2 ¼ bushels per acre, is taken from contemporary estimates by experts. The wastage is taken to be zero, as it is difficult to see, given the modes of storage and transport, where losses might have been caused; illustrative calculations of the available amounts available for eating, starting from a given production amount, do not mention these differences.
The yearly population numbers are based on the Censuses for England and Wales.
Did the country produce enough wheat?
It was generally understood, that – from 1815 to 1838 – the wheat eaten in England and Wales was a little more than the production of the country. The missing amount was about nine per cent, or about four per cent if the production of Ireland was included:
“Will you specify which of these four years you allude to?” “The last four, say 1828 to 1831, were 18 per cent. below the consumption of the country. By consumption of the country, I must be understood as not meaning an average crop, for an average crop is not equal to the consumption.”
“How much is regarded as the consumption of the country?” “An average crop may be about nine per cent. less than the consumption.”
…..
“At what do you estimate the annual consumption now?” “The scale on which I go is assuming it to be about twelve millions.”
(Select Committee on Agriculture, House of Commons, 2 August 1833, David Hodgson, corn merchant, QQ. 693-694, p. 36, Q. 707, p. 37)
“Taking this as one country, supposing an average crop of England and Ireland, would the average crop supply the consumption, or what is required in addition from abroad?” “It would require an importation from abroad of about 500,000 quarters.”
(continuation, David Hodgson, corn merchant, Q. 727, p. 38)
“What do you conceive to be the average consumption of wheat in the British islands?” “I have looked at the subject; formerly, five or six years ago, I calculated it was about six bushels per head for the population.”
(Select Committee on the State of Agriculture, 1837, p. 13; question to Mr. W. Jacob, Comptroller of Corn Returns in the Board of Trade).
Mr. George Porter, at the time Head of the Statistical Section of the Board of Trade, wrote in his “Progress of the Nation” in 1851, that the increase in the number of inhabitants from 1801 to 1841 had been more than paralleled by the increase in the quantity of agricultural produce. Further, that the amounts of wheat imported had been low, in comparison with the total wants of the population:

Porter, 1851, pp. 138-139 (amounts per calendar year, not per harvest year)
Until 1846, the imports were artificially restricted, and were not allowed, unless the domestic price was very high. From 1846, imports were unrestricted in volume, and did not pay any tariff.
By how much did the yield per acre increase?
There can be no doubt that the production of farms increased in efficiency from 1790 to 1860. There were continual improvements in the farms, which were communicated between the farmers; these improvements were, for example, new implements, new ploughs, new methods for preparing the food for the animals; often the improvements were only introduced after comparative experiments; Farmer’s Associations were set up in each county; these Associations gave out prizes for the largest animals, or the most productive milk cow, etc.; the Board of Agriculture required reports about each county.
There was a considerable increase in the use of mineral fertilizers, which improved the volume of the harvests. See: O’Connor, J., Origins, Development, and Impact of Britain’s 19th Century Fertiliser Industry, Fertiliser Manufacturers’ Association, Peterborough, 1993.
The farmers and landlords would not have undertaken these activities, if they could not see real improvements in production.
“The vast increase of agricultural produce has not only proceeded from any greater number of people being employed, but chiefly from the use of improved implements, better courses of cropping, the reclaiming of waste land, melioration of every species of soil, and improved farm stock. By such means farm produce has been doubled, and the condition of the soil, the occupiers of land, and every description of labourers, has been much improved during the present generation.”
(William Aiton, Remarks on Mr. Malthus’ Opinions on Agricultural Subjects, The Farmer’s Magazine, Vols. 25-26, 1824, p. 464)
But the estimated yields in different years are less than what one would expect from this catalogue of improvements. From 1800 to 1880, the average yield only increased from 22 bushels per acre to 28 bushels per acre (See the information in Figure 5), that is, 25 per cent. THIS IS AN OPEN QUESTION.
Do the arithmetical results coincide with the contemporary information as to consumption per person?
The amount of bread consumed per average person per day, according to the calculations commented above, was during practically the whole of our period, between 1.0 and 1.2 pounds.
As a “cross-check” to the numbers produced from the harvest estimates, we use numbers of consumption per head per head, from some contemporary estimates and observations. These are shown above in the section: “Consumption of Wheaten Bread, 1770-1880, by Occupation and by Region”, and are here resumed.
According to Arthur Young, in a survey in Suffolk in the year 1800, the consumption was found to be a pound of flour per day [equal to 1.3 pounds of bread].
Mrs. Rundell, in her book of Domestic Economy, gives an amount of 1.2 quartern loaves per week for adult persons, “having a due portion of other food”, that is, they are in comfortable circumstances, which is 0.75 pounds per day. For a family, it would be 6 pounds per week, per head, i. e. 0.85 pounds per average family member per day. [The numbers would seem to be incongruent]
Mr. Mott, the Assistant Poor Law Commissioner for Middlesex and Surrey in 1834, estimated an average consumption for agricultural families in southern districts, of 122 ounces of food (of which, 95 % bread) per week, i. e. 1.0 pounds per person per day.
Dr. Edward Smith in a survey of adult members of the laboring classes in the rural areas of Yorkshire, Notts, Cambridgeshire, Lincolnshire, in 1866, reports a consumption of 1 ¾ to 2 lbs. of bread-stuffs daily. But the rural workers in the North ate better than those in the South.
The figure of 1.1 pounds of bread per capita per day coincides with the 1.1 pounds reported by Dr. Smith for Lancashire workers in 1861, just before the Cotton Famine.
Dr. Lawes, he of the experimental plots in Rothamsted, informs us of an investigation which he carried out, extracting data from 86 different dietaries. The average yearly consumption of bread was 6 1/2 to 6 3/4 bushels [1.06 to 1.11 pounds per average person per diem].
Mr. Caird made a calculation based on the real data (physical count) of the Agricultural Statistics of 1866, plus registered imports of wheat. This gave 1 ¼ pounds of bread per person in England, Scotland and Wales.
So we see that these data for large segments of the population, do confirm a consumption of a little more than 1.0 pounds per average person per day.
Was the amount per person enough?
It might be supposed that although the population was effectively eating 1.1 pounds per person per day, this was not enough for their energy requirements given their types of work. But contemporary commentaries do say that this was enough (in the period from 1790, one would have to add the amounts of potatoes eaten).
“In our present established modes of living, bread is an indispensable article, of which every one expects his fill, which cannot in general be restrained, or limited in quantity, without causing clamour and complaint; and this generally made of good wheat, without any mixture; the quantity made from oats, barley, and other grain or pulse, being but a small proportion of the whole. Respecting the quantity necessary to each individual, various estimates have been formed; eight bushels per annum has been reckoned, but this is certainly too much, and more than necessary. The late Dr. Withering reckoned that a labouring man, who lived chiefly on bread, would consume a pound weight a day; this allowance for a year, I believe, he made from six bushels of good wheat; but women and children require, in general, less. In a Report from the Birmingham Union Mill, a quartern loaf and a half per week, to each individual of a family, is stated as a good allowance; and this agrees with my own observations upon the consumption by grown persons; but I think that children and old persons require less, where they have plenty of potatoes, as well as others who have plenty of animal food and beverage; and am of the opinion that to one half of mankind, the full grown, healthy and active, one pound of bread each day may be required; and that to the other half, women, children, and those who have plenty of other food, ¾ lb. per day is sufficient, making the average 14 oz. per day, or 320 lb. per annum.”
(Pitt, 1806, p. 284)
The question as to whether this amount of wheat produced/imported was sufficient for the appetites of the population, is resolved by Mr. Tooke for the years 1833-1835, in which he says there was a surplus that actually could not completely be eaten by the people:
“The hypothesis, that an unusual abundance of wheat causes an immediate expansion of its consumption as bread, would have entitled us to expect that the surplus wheat produce of the years 1833 to 1835, or the greater part of it, would have been applied in that way. But the facts of the case did not bear out such an anticipation; for so little impression did the extra consumption, as food for man, make upon the extra supply, that wheat in 1834 and 1835 was used to a considerable extent for the purpose of feeding cattle, and sheep, and pigs, and for brewing and distilling. It is true that in consequence of the dryness of the summers of 1833 and 1834 the crops of spring corn were short, and fetched higher prices than usual, relatively to wheat. But still the fact remains, that Wheat, cheap as it was, cheaper than it had been for fifty years before, with a greatly increased population to feed, proved to be, even at extremely reduced prices, so unequivocally in excess of the demand for it as human food as to render necessary the adoption of unusual and inferior methods of absorption; … “
(Underline by this author)
(Tooke, op. cit.; p. 74)
Corroborated by:
“Are you aware that any quantity of wheat has been consumed in feeding cattle?” “Immense quantities of all descriptions of corn.”
(Select Committee on Agriculture, 1837, Mr. George Trumper, Land agent, Middlesex, p. 170; examined on 8th March 1836)
“Have you the means of knowing if the increase in wheat has not been occasioned in those counties by its being grown on that land on which they used to cultivate oats?”
“I think not; the crops of wheat for 1832 and 1833 I compute as having been crops yielding a supply sufficient for the consumption of the country.”
“From England and Ireland?” “Yes; 1834 the crop greatly exceeded the consumption.”
“What do you say of 1835?” “It was an ave
“What do you say of 1835?” “It was an average, and not producing what I should think would be equal to the consumption of the year.”
(Ibid, p. 102; Mr. David Hodgson, Corn merchant, Liverpool)
Mr. Caird commented on the logical necessity that the consumption of bread per capita should remain constant through the years. “[the opinion of Mr. Newmarch, with which I concur] … is that the consumption of bread is very constant, that everything is given up before bread, and that bread being the staff of life it must be had by the people whatever the price may be. This view is confirmed by inquiries which I have since made among some of the leading bakers in the most densely peopled quarters in Whitechapel in the east, and the Harrow Road in the north-west, one of whom has been thirty years in the business, and now has three shops in a district entirely inhabited by the working classes. Their testimony is that the consumption of bread is now very large, for, although dear, it is still the cheapest article of food within reach of the poor, the next substitute, potatoes, being scarce and very dear.” (Caird, 1868, p. 134).
Graph 3 does not show exactly a calculation of the consumption of wheat bread, but actually a sum of the harvest production and the imports. In those years of high production, the excess wheat was not eaten by the population, but stored in barns and warehouses. It was carried over to the next year, and would be used if there was a shortfall. Equally the insufficient harvests that we see in the graph, were in general compensated with the amounts in the barns.
Therefore, although the graph shows from 1822 onwards, numbers in the range of 0.9 to 1.3, the reality of the amounts eaten would have been probably in the range of 1.0 to 1.2 pounds per dayThe fact that the amount eaten – according to the present calculations – moves little from year to year, in the range between 1.0 pounds and 1.2 pounds, demonstrates that these amounts were those which the population actually required. In years of less harvest production or of more poverty, they did not eat much less; in years of excessive production or of better income levels, they did not eat more.
Were there groups of people who ate less than the one pound of bread per day?
Obviously the fact that we have calculated an average of one pound of bread per person per day, does not necessarily mean that everyone in the country was eating enough bread. (But on the other hand, many of the persons who were eating one pound of bread, were not eating enough food in total).
The really poor, in general, did not always eat enough bread. Here we have the persons who slept in doss-houses, the unemployed for long periods, the Irish in Lancashire in the years after the Famine, the needlewomen who lived alone (who were generally supposed to have to prostitute themselves), those with very large families.
The agricultural workers, in the South and South-west of England and in the Eastern counties, in the period of 1840 to 1870, did eat their one pound of bread, but not much else. And this was often barley bread, and/or was covered with lard or dripping to make it palatable. In the winter, the food situation was worse. (see A. Wilson Fox, “Agricultural Wages …”, 1903, pp. 291-292 and page 343).
We might think that, for example, the upper classes ate 1.7 pounds per day, and the working classes ate 0.8 pounds per day, thus respecting the average consumption of 1.1 pounds per day. But it is difficult to imagine the average family member of the upper classes eating this amount. Further, if they wanted to eat more in total, they would eat more meat.
Conclusions
| This investigation shows that the population of England and Wales on average ate sufficient bread in each year from 1816 to 1880. Until 1838, the average of the home production amounts was slightly less than the required amount, but the difference was made up by imports of wheat from Ireland and from Europe. From 1838 onwards, the domestic production could not cover the requirements of the population, and medium volumes were imported from Europe. From 1850, large amounts were imported from the United States and other countries outside Europe. The average per day consumption per person, calculated from amounts of domestic production plus imports, was about 1.1 pounds of wheaten bread. This corresponds to reports of consumption in some segments of the population. This was taken to be the amount corresponding to the biological requirements of the people. The fact that the consumption of bread was close to constant during the whole period, shows that it was not affected by price or availability, nor by the proportion of agricultural and industrial families, and thus that the 1.1 pounds per day was the amount that was naturally eaten by the people. Since the amount of bread eaten over the years does not change, this report does not tell us anything about changes in living standards. For this, we need as a next phase, yearly information about the amounts eaten of the inferior cereals, potatoes, meat, dairy products, etc. |
Potatoes
These were very important for the poorer part of the agricultural population, especially in the years of poor harvests and high wheat prices from 1795 to 1815. If they had not had the possibility to buy or to cultivate potatoes, they would have faced a situation of starvation. Probably these people consumed half of their requirement of eating volume with the cheaper type of wheat, or with rye/barley/oats, and the other half with potatoes. From 1820 onwards, a number of agricultural families cultivated potatoes in “allotments”, on plots of half an acre, given to them, or rented to them, by the farmer. But some of the potatoes were sold for cash, or fed to the pig. Starting at a date of possibly 1830, potatoes were a common food for the urban working class in their houses.
There were also many farmers who produced potatoes, but the larger part would have been for their animals.
There are no useful statistics for the production of potatoes for human consumption, neither from allotments, nor from farms. The following figures from Harris, 2015, p. 25, seem reasonable, especially as they are close to the information of Caird from the Agricultural Statistics of 1866, that the consumption in Britain in that year was half a pound per person per day.
