11.10. Other Sources of Food, Other Incomes, Cottagers

It is not true that the agricultural labourers’ families only ate bread, bacon or pork, and cheese, such as are shown with cost in the family budgets.

The majority of the poorer segment of the labourers had gardens next to their cottage, where they grew potatoes, cabbages, carrots, and other vegetables. In the worst months of scarcity, the potatoes could make up the half of the physical volume of food consumption.   

A certain proportion of the labourers had a pig, which was fattened, and killed at the end of the year, to be converted into salt pork, which was then eaten through the following year; the costs are given in the family budgets (sometimes), showing the purchase of barley, peas, and beans for feeding the animal. Many labourers also had chickens, for eggs. Milk for children was sometimes given free to the poor villagers, by neighbours who had a cow.  

After the men cut the wheat in the harvest, the next day, the small children of the village were allowed into the field at dawn, to pick up the individual seeds that had fallen to the soil (“gleaning”). The amount over the full harvest period each year might well be 2 to 4 bushels per family, that is, they saved two to four weeks of expenses for food.  

In all the cereal parts of England, it was the custom that during the harvest month, the farmer sent food to the field where the men and women were working, together with a supply of beer. Thus the family did not have to pay the month of food. The day after the end of the harvest, there was a feast, called “Harvest-Home”, also paid for by the farmer; there was usually also a procession with a cart decorated with objects made out of wheat stems.   

“The mode of living, or the kind of food provided for the men, varies considerably in different places. With some it is customary to give seed-cakes and ale for breakfast, as well as at wheat harvest-home, &c.; but in general, meat is allowed three times a day, which consists of pork, bacon, &c. with from one-fourth to one-third of butchers’ meat, and in general plum-puddings; and three meals on each of the four Sundays in the month. It is customary to allow three pints and a half of ale per day; viz. in the morning, at eleven o’clock, and at four in the afternoon; but in some places, the allowance of ale extends to four or five pints, and one pint per man on a Sunday. The evening of the harvest-home is, as is usual in most places, a scene of festivity, when the harvest men, their wives, and children, and other helpers and neighbours, compose a numerous and expensive assemblage. When the month is finished, the plum-pudding disappears, and daily pay is reduced about Lidlington, &c. to 1s. but remains in some places as high as 15d., and even 18d. with food and beer as before.”

(Board of Agriculture / Thomas Batchelor, General View of the Agriculture of the County of Bedford, 1813, p. 584)

“The Harvest Home” by Thomas Rowlandson (1756-1827), painted 1821

But it is also not true, that the families only earned their money by working at agricultural tasks for the farmer. A considerable number, “cottagers”, rented a few acres, to grow their own wheat or to pasture one or more cows. The man would work six days a week for the farmer, and then work late at night or on Sundays on his own plot; the wife and the children would work on the fields during the week.

“ …. There are also a great many cottagers, by which I mean, occupiers of small portions of land, just sufficient to enable them to keep one or two cows, without preventing them from working constantly as day-labourers:- this custom does not prevail in all the parishes, but wherever it does, the benefit of it is felt by the cottagers themselves in the greatest degree, and by the proprietors and occupiers of the lands in the lowness of the poor rates, and in the industry and good order of that description of labourers. These small portions of land are generally well managed, and made the most of.”

(Young, Annals of Agriculture, Vol. XXII, 1794, Agriculture of Rutland,  p. 355)  

We do not know what percentage of labouring families were cottagers in this sense of the term. The Earl of Winchelsea, who was a friend of Arthur Young, and very interested in agricultural improvements, gave a list of eight different forms of working the land by the labourers. We may suppose that if these eight classes were important enough to be mentioned, it cannot be the case that more than 50 % of the families were in the position “8th”. Following we give the Earl’s heading for each type:

1st, Those who have a sufficient quantity of grass-enclosed land to enable them to keep one or more cows, winter and summer, and a garden near their house.

2dly, Those who have a summer-pasture for their cow, and some arable land, upon which they grow the winter provision.

3dly, Those who have a right of common for the summer keep of the cow, and a meadow, or arable ground, or a meadow in common, for the winter provision.

4th, Those who have a right of common and garden.

5th, Those who have a right of common, and no garden.

6th, Those who have several acres of arable land, and no summer pasturage for a cow.

7th, Those who have a garden near their house.

8th, Those who have no land whatever.

(“This is a very bad situation for a labourer to placed in, both for his comfort, and for the education of his children. When a labourer is possessed of cattle, his children are taught early in life the necessity of taking care of them, and acquire some knowledge of their treatment; and if he has a garden, they learn to dig and weed, and their time is employed in useful industry; ….”)

(Earl of Winchelsea, Lord Brownlow, Robert Barclay, Mr. Crutchley, Henry Holland, Robert Beatson, A. Crocker; Communications to the Board of Agriculture, on Subjects relative to the Husbandry and Internal Improvement of the Country, Vol. I, Parts I and II, Part II, Cottages, London, Board of Agriculture, 1797)

The Earl commented that “there are several labourers in my neighbourhood, who have got on in that manner, till they now keep two, three, and some four cows, and yet are amongst the hardest working men in the country, and the best labourers. I believe there are from seventy to eighty labourers upon my estate in Rutland, who keep from one to four cows each; and I have always heard that they are hard working industrious men; they manage their land well, and always pay their rent. With regard to the profit they make of a cow, I am informed that those who manage well, will clear about twenty-pence a week, or £ 6 6s. 8d. per ann. by each cow, …. “ (p. 78)

It seems that the greatest concentration of cottagers with rented fields was in Lincolnshire and Rutland. The Board of Agriculture was very interested to see if this method of farming could be extended – this was 1800, the year of the worst corn scarcity – so they sent a Mr. Robert Gourlay to inspect the area and make a report.

Starting in January 1801, he visited a number of villages in Rutland and Lincolnshire.

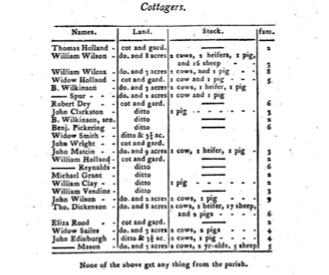
The first village listed is Belton. 24 families (83 family members) farmed rented land. The landowner, Lord Brownlow, allotted them a total of 150 acres for their farming activities. Note that all the men worked during the week for their farmer. They also rented cottages of a comfortable type from Lord Brownlow.

Mr. Gourlay was most impressed by the fact that, of all the people that he interviewed in the two counties, not one had had to apply to the parish for financial aid inthe previous year. And this despite the fact, that in all England there had been a great scarcity of wheat and increase in the price of food, such that many families were only surviving bacause they were receiving parish relief or donations from individuals. The poor rates, that is, the payments to the poor, financed by the taxes on property owners, were less than in villages without “cottagers”.

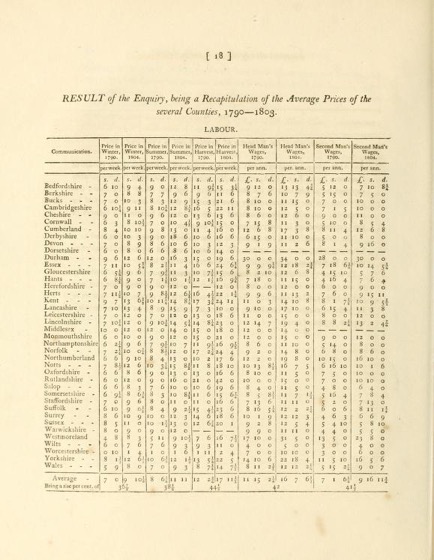
In total, Mr. Gourlay reported on 40 parishes, with a total of 9,058 inhabitants. 618 families with 2,783 family members were cottagers with cows. On average they rented 6 acres of land each, with 1.5 cows, 0.8 pigs, 1.8 sheep, and 0.2 horses. They paid 7 pounds a year as rent of the land. 

(Mr. Robert Gourlay; An Inquiry into the State of the Cottagers in the Counties of Lincoln and Rutland; Annals of Agriculture, Vol. XXXVII, 1801, pp. 514-549 and pp. 577-600)

 “Insuring Cottagers’ Cows

For some years past there has been a custom in Lancashire of insuring cows, paying 5s. a year and having the cow re-placed by the society, in case of death or accident. – It is an excellent institution; some gentlemen began it by subscribing 100 L. a piece, and all the rest an annual payment of 5s. Their annual payment, of late years, have so far exceeded the demand, that they have divided a good sum of their former subscription.” 

(Young, Annals of Agriculture, Vol. 26, 1796, p. 501)

There was a further segment of cottagers, who did not rent the land which they would be working, but actually bought the land freehold, and built their cottage. The total cost between cost of land, payments for building the cottage, pig, cow, horse (in a few cases), and fencing, was about 50 Pounds. The question is, how did they pay for it? There were three ways: using the money they had saved up, as young men and women working as indoor farm-servants (bed and board free) or as apprentices, from 15 to 25 years old; living very economically, and saving the money during years as labourer; or making an initial payment, and contracting a mortgage. 

Arthur Young visited a number of counties (Cambridgeshire, Norfolk, Essex, Surrey, Sussex, Lincolnshire) in the year 1800, and interviewed or informed himself about hundreds of families (not all the cases in his report are freeholders, some only rent). He was also interested in how the total of these activities could reduce the costs of rates to the parish. 

(Arthur Young.  An Inquiry into the Propriety of applying Wastes …….., 1801, whole document)

He was very impressed with the hard work and determination which the families had shown, in order to save up the money necessary, and then to work the fields while the father was working six days a week for the farmer (there is one account of the whole family harrowing their field by moonlight!).

“But the cases here detailed prove clearly, that wherever there is such a hope, it operates beyond all the powers of calculation. How these men were able to effect their object surpasses inquiry; that they saved money with this view is palpable, because in most of cases the erections have been the work of regular carpenters and masons, who could not have been employed without a considerable part of the expence being paid for; and this accordingly I found the case, for where mortgages had taken place, it was only for a part of the expence, in many instances for only a small part, and in some, not a few, without any such assistance at all.”

(pp. 9-10)

“Nothing can be clearer than the vast importance which all these poor people, scattered as they are through so many counties, and affected by circumstances so extremely various, attach to the object of possessing land, though no more than to set a cottage on.”

(p. 11)

“When we set by our fire sides and ask how a poor labourer can afford to build a comfortable cottage, enclose some land, break up and cultivate a rough waste, acquire some livestock, and get many conveniences about him, we defy calculation; there must be some moving principle at work which figures will not count, for in such an inquiry we see nothing but impossibilities. But we forget a thousand animating principles of human feeling. Such effects could not possibly have been produced without a series of years of great industry and most economical saving – to become independent, to marry a girl and fix her in a spot they can call their own, instigates to a conduct, not a trace of which would be seen without the motive ever in view. With this powerful impulse they will exert every nerve to earn, call into life and vigour every principle of industry, and exert all the powers of frugality to save. Nothing less can account for the spectacle, and such animating prospects will account for anything.”  

(pp. 11-12)

Young talked to the wife of a Mr. Thomas Rich, who had been called up to the local militia. “… The woman (Rich) assured me, what is easy to believe, that she and six young children, and big of a seventh, none of whom earn anything regularly, should have perished, had not been for the great assistance derived from her land, which she has, in her husband’s absence, cultivated with her own hands, even to digging for sowing rye and wheat; her rye yielding four bushels and her wheat four bushels and three quarters. She had also cabbages, potatoes and other things.” [she did receive 10 shillings a week as compensation from her husband’s militia service] (pp. 92-93)

A typical information about a “success story”, among dozens, is Mr. Cranham of Waverley in Surrey. “Cranham, three children at home. Cottage built eight years, owes 19 l. on it, and eight years interest. It is of brick and tile, and has two stories. 2s. 9d. from the parish. A sow and four pigs. About an acre of good land in green-sward bottom. The woman thought a cow a fine thing, and would do anything to get one; but not much ability to calculate. Sowed three pecks of wheat this year, and got six bushels.” (p. 98)

Young was given information about a number of cottagers in the village of Blofeld in Norfolk, rich farming land, 2,000 acres, population 400, of which the half were cottagers with freehold. None of these had received assistance from the parish.

(pp. 60-61)

“In the Annals of Agriculture, No. 256, is an account by the late Sir William Pulteney of an occupation by a Shropshire cottager, Richard Milward, who with a wife and six children occupied 1 acre 10 perches of land, upon which, principally by the labour of his wife, the man being employed elsewhere, was raised annually 15 statute bushels of wheat, and 140 bushels of potatoes, of 80 lb. to the bushel, over and above the seed, and from which was supported and fatted a hog of 300 lbs. weight; in this case the odd 10 perch was cultivated for garden vegetables, and the acre in two divisions, wheat and potatoes alternatively, half an acre each; the manure raised from the hog by means of the wheat straw, and potatoe haulm [stem of the plant], being sufficient to support the crops.  

The wheat was sown by the woman upon the following plan; in autumn, when the potatoes were fit to get up, she daily in the morning marked out the work of one day, upon the potatoe ground, from which she first cleared off the potatoe tops and haulm, this served to litter the pig and make manure, she then sowed that spot with wheat, and proceeding to get up the potatoes; the seed wheat was properly covered by that operation, and the wheat crop succeeded equally well or better than in any other way; they had formerly had it sown by the neighbouring farmers, but being frequently disappointed, had adopted this method, which had completely succeeded; and as the proper time of sowing wheat agrees exactly with that of getting up potatoes, namely the whole month of October, or any time then about the two operations are well combined in one; in this system an acre of land produces annually 15 bushel of wheat of 60 lb. each, 900 lb. consequently of bread … 

   900 lbs.

            And potatoes 140 bushels besides seed for next year, at 80 lb. to the bushel … 

11,200

The produce of wheat is more than the average, but may be obtained upon land well managed and kept clean from weeds, which in this case might be done by the wife and children; a clean crop of potatoes, is one of the best preparations for wheat.

An hog at one year old may grow to the weight of 300 lbs., and be supported to that weight from the above produce, and to spare; suppose his average allowance for the first three quarters of the year to be one peck of potatoes per day, besides refuse of wash and garden vegetables.

Suppose 270 days at 20 lb. per day of potatoes                                5400 lbs.

                   90 days when fatting at 40 lb. per day                              3600

                                                                                                                       9000

(Pitt, William; Communications to the Board of Agriculture, 1806, Vol. V, Part I, No. XVI, pp. 313-314)

11.9. Sir Frederick Eden (1795/6)

This member of the better classes also saw that there was an excess of poverty in the country in 1795, and had data collected from a number of towns, as to the care of the poor (particularly the poor-houses, and the direct payments to people without incomes). These reports were published in his “State of the Poor” in 1797; however, it is important to note – and he himself comments this – that the figures actually come from 1795 and 1796, when the food prices were very high, due to the bad harvests.

He also publishes as an appendix, but without explanations or commentaries, reports of earnings and expenses of 68 cases of agricultural labourers; some families are repeated, as they are shown for two different years. In these 68 cases, 31 have children above 10 years old, 22 cases have children’s income above 2 shillings a week, and 16 cases with above 3 shillings a week.

The 68 families have 10 “exceedings” and 58 “deficiencies”. The average outgoing for meat or bacon is about 1s. 2d. per family per week, which is about 2 lbs. meat for the family

Sir Frederick also gives a few reports of families in his text of parochial reports. One of these comes from Berkshire, and shows how the income/expenses situation can improve greatly when the family has two boys over 10 and earning good money. We can take this as a High Case in the range of family situations.   

(Eden, 1797, Vol. II, Parochial Reports, Berkshire, Streatley, pp. 15-16)

Consumption of bread and meat per family per week:

 9 pers.
  
Flour units 4 lb. (*)15
Meat or bacon lb.1 ½ 

(*) 4 lb. of flour gives 5 lb. of baked bread

(there is an error in the table, the bacon should not be ½ pound times 3 pence, but 1 ½ pounds times 10 pence)

As the text says, the calculation is misleading, because it is made at a date when the wheat price was extremely high, and thus the costs were more than 50 % above a normal year. In fact, we can identify the date, as the price of 1s. 9d. the half-peck loaf corresponds to a market price for wheat of 112 shillings the quarter (480 lb.); if we consult the table at the beginning of this chapter, in August 1795 the price was 108 shillings, which was the highest price since records began, and was only exceeded in 1800. The price 12 months earlier was 52 shillings, and the price in 1787 (first data from Rev. Davies) was 53 shillings. We can regress the cost figures to the year 1787, and we see that the family would have had a small surplus, while eating well.

8 half-peck loaves a week, or 410 in the year,
at 10d. each
£ 17   2 10
[one half-peck loaf is four quartern loaves] 
2 lb. of cheese a week, at 4 ½ d. the lb., yearly     1 19   0
2 lb. of butter a week, at 9d. the lb. yearly     3 18   0
2 lb. of sugar a week, at 8d. the lb.     3  9   0
2oz. of tea a week, at 2d. the lb., yearly     0 13   0
½ lb. of oatmeal a week, at 2d. the lb., yearly     0  4   4
1 ½ lb. of bacon a week, at 8d. the lb., yearly     2 12   0
2d. in milk every week, yearly     0  8   8
Candle, soap, salt, starch, blue, etc., yearly about     1 15   0
House-rent     2   0   0
Fuel; what is bought costs about     0 15   0
Shoes, shirts and shifts, other clothes     5  0   0
  
                                            Total Annual Expenses  £ 39 16  0
                                           Total Annual Earnings     40   5  0
                                             
                                           Surplus  £   0   9  0

We have another interesting example, which comes from the page of families from Lincolnshire. Your author decided to use this page, as it shows figures for the same family in different years.

Consumption of bread and meat per family per week:

 No. 1
4 pers.
1792
No. 1
4 pers.
1794
No. 2
8 pers.
1796
No. 3
4 pers.
1793
No. 3
4 pers.
1794
No. 4
6 pers.
1793
No. 4
6 pers.
1795
        
Flour units 4 lb. (*)161420161522 19
Meat or bacon lb.2 ½2 1/241 ½1 ½1 1/20

(*) 4 lb. of flour gives 5 lb. of baked bread

But the strange part is that these families could be found in Lincolnshire, which was probably the county with the best real incomes for agricultural labourers, as Arthur Young informs us:

“Hence we may determine, that labour is probably higher than in any other county in the kingdom.”

(Board of Agriculture / Arthur Young, General View of the Agriculture of Lincoln, 1799, p. 403)

 “At Swinhop, Mr. Allington’s regular labourers (and it is the same all through the county) have cows. If they are rich enough to buy themselves, they do it, if not, the landlord finds them cows, but in that case he has the calf gratis each year; but they like best to have their own cows, and they generally manage to find the money. Two labourers are now building cottages on leases of 21 years, at an expence of not less than £ 30 each. The way the cows are fed, is with the farmer’s own, both in summer and in winter; the value of keeping a cow is estimated at £ 5 at least, for they eat two tons of hay, besides straw. A cottage and garden is reckoned to be worth 40s. to 50s. None have sheep, but all have a pig, which they fatten with gleaned corn; at other times run also with the farmer’s pigs.” (p. 417)

“At Marston, which is a populous village, I remarked that every cottage has a small field of half an acre or an acre, with a garden, and a little hay stack; and each has four or five acres besides, for their cow in summer. They have, besides, a pig or two, and some a few sheep; and as the land here does not suit to remain in meadow, they plough and lay it down again, and their crops are good, and pay them well. This only in the small piece by the cottage. The whole was a sight that pleased me much.” (p. 418)

“It is impossible to speak too highly in praise of the cottage system of Lincolnshire, where land, gardens, cows, and pigs, are so general in hands of the poor. Upon views only of humanity and benevolence, it is gratifying to every honest heart to see that class of people comfortable, on which all other depend.” (p. 419)

11.8. David Davies (1787)

David Davies was an Anglican clergyman, rector of the parish of Barkham in Berkshire from 1781 to his death in 1819. He wrote a book about the incomes and living expenses of his “flock”, called “The Case of the Labourers in Husbandry”, referring to 1787, published in 1795. 

The parish was small and poor. “In this parish the poor-rate is somewhat lower than in any of the contiguous parishes. Here is no work-house, nor any manufacture carried on. Tilling the ground is the only occupation. The number of the inhabitants being only 200, every one is known, and no one can well be idle. The overseers, being frugal farmers, keep down the rate as low as they can.” (p. 26).The parish was only the half of the average size in England. The income from rates (i.e. the amount that could could be paid out to the poor) was only 75 pounds per year.

He was very hurt by the poverty of the people of the village.

“In visiting the labouring families of my parish, as my duty led me, I could not but observe with concern their mean and distressed condition. I found them in general but indifferently fed; badly clothed; some children without shoes and stockings; very few put to school; and most families in debt to little shopkeepers. In short, there was scarcely any appearance of comfort about their dwellings, except that the children looked tolerably healthy. Yet I could not impute the wretchedness I saw either to sloth or wastefulness. For I knew that the farmers were careful that the men should not want employment; and had they been given to drinking, I am sure that I should have heard enough about it. And I commonly found the women, when not working in the fields, well occupied at home; seldom indeed earning money; but baking their bread, washing and mending their garments, and rocking the cradle.” (p. 6)

He thus collected the data about incomes, food costs, and other expenses of six agricultural families in Barkham. Then he sent these calculations to a number of professional persons in other parts of the country, asking them to return him figures about the poor in their respective areas in the same format. In total he had data as to 134 families. He did actually check through the reports received, and correct some figures. He then wrote a book with these figures, with a number of commentaries about the causes of the poverty and some ideas as to how this could be reduced. The book, of 200 pages, was published in 1795, and was well received in the country, being referred to in debates in Parliament. Following we give the two pages referring to Barkham.

Consumption of bread and meat per family per week

 No. 1, 7 pers.No. 2, 7 pers.No. 3, 6 pers.No. 4, 5 pers.No. 5, 5 pers.No. 6, 4 pers.
       
Flour units 4 lb. (*)1513126910 
Meat or bacon lb.1213 (+)3 (+)1 ½

(*) 4 lb. of flour gives 5 lb. of baked bread; (+) Pig bought and fattened in-house

The general idea in England, was that a family (5 or 6 persons) used one bushel of wheat, that is 15 units of 4 lb., a week. The families No. 4 and No. 5 do not need so much bread, since they eat a good amount of meat from the pig.

These people, although working long hours and living in bad housing, do eat just enough, can pay their rent, and can pay for a part of their requirement of clothing. The wives do not earn anything from spinning, as do the majority of labourers’ wives in England; they take up all their time in looking after the children and in the other household tasks, and thus do not have any time for spinning.

According to the title of the table, they are all “families of labourers”, and we might suppose that they are a representative sample of agricultural families, but the reality is that they are all (with the exception of No. 4), in precarious circumstances. That is, they are “poor”.

No. 1.  A man, his wife, and five children, the eldest eight years of age, the youngest an infant.

No. 2.  A woman, whose husband has run away, and six children; the eldest a boy of sixteen years of age, the next a boy aged thirteen, the youngest five; four of the children to young to earn anything. 

No. 3.  A man, his wife, and four small children, the eldest under six years of age, the youngest an infant.

No. 4. A man, his wife, and three small children, the eldest not quite five years old, the youngest an infant.

No. 5. A man, his wife, and three young children, the eldest six years of age, the youngest an infant.

No. 6.  A man, his wife, and two young children, the eldest seven years of age, the youngest four.  

So we have:

  • one family without an adult male (the woman receives a payment from the parish; her expenses are obviously not so high as the other cases);
  • only one family with children over 10 years old, and thus can work;
  • three families with 3 children of 6 years old, or less.

Thus it does not seem that these families form a representative sample from the totality of persons working on the land. Rather, they are at their most vulnerable moment in their life-cycle, with a number of small children, the wife not working, and without children of 11 to 15 years old working.

So that if we want to make an estimate of the average standard of living of agricultural familes at this date, we need an idea of the percentages of people in each age / family size grouping.

The basic parameters of family life events (averages, rounded figures) are taken as follows:

  1. child mortality to 10 years = 12 % (Jones, Table 5, p. 17)
  2. age at which young boys and girls leave home to work = 15 years old (Williams, pp. 65-66)
  3. age at marriage, men and women = 25 years old (Jones, Table 4, p. 16)
  4. death rate counting from live birth = 1 / 50 (Jones, Table 3, p. 15) 
  5. age at death = 55 years old (combination of a) and d))
  6. mean birth interval = first child 18 months, then each 30 months (Jones, Table 7, pp. 18-19)
  7. mean completed family size = 5 children (Jones, Table 1, p. 11)
  8. proportion of adults who never married = 10 % (Whittle, Table 7.4, p. 166)

Samantha Williams; Malthus, Marriage and Poor Law Allowances revisited: a Bedford Case Study, 1770-1834; Agricultural History Review, British Agricultural History Association, Vol. 52, Part I, 2004, pp. 56-82; http://www.bahs.org.uk/AGHR/ARTICLES/52n1a4.pdf

R. E. Jones; Population and Agrarian Change in an Eighteenth Century Shropshire Parish; Local Population Studies, No. 1, 1968, pp. 6-29; http://www.localpopulationstudies.org.uk/PDF/LPS1/LPS1_1968_6-29.pdf

Jane Whittle; Land and People, in Keith Wrightson (ed.), A Social History of England, 1500-1750, Cambridge University Press, Cambridge, 2017 

The proportion in each segment would be approximately:

AgeNo. Years StatusNumber
Children
Total
Persons
Persons x YearsPercent of Population
       
15-2510Single
Working outside home
(with bed and board)
022010 %
25-305Married couple No children
or 1 small Child
13158 %
30-4010Married couple Number of children all under 10466033 %
40-5010Married couple Children
over 10 working
466033 %
50-555Married couple
Children left to work
02106 %
25-5530Never marry02 10 %

The table above is supported by the following real data from Norfolk and Suffolk in 1838, relating to the distribution of family sizes. It shows that 30 % of the people are in the segment of “all children under 10”.

FamiliesPersonsConditionAverage Number of ChildrenAverage Annual Income per Family     
L   s   d
Average Weekly Income per Family    s  d
      
3636Single men25   1   49 10
64128No children at home30 12 1011   9
166813All children under 102.932 13   212   7
120684One child above 103.735   9   013   7
92634Two children above 104.940 10   115   7
44343Three children above 105.845 11   917   6
15153Four children above 107.050 18   619   7
17Five children above 1042 13   016   5
18Six children above 1052   0   020   0
      
539 Total families / Average 35 10   0 
 2788Total persons   

Average weekly wages 10s. 4d.; 1 bushel = 6s. 6d.

(Kay, James Phillips; Earnings of Agricultural Labourers in Norfolk and Suffolk; Journal of the Statistical Society of London, Vol. 1, 1838, pp. 179-183)

We have seen from the data from David Davies, that the families in the third segment of our table are on the margin of subsistence (Worst Case). The fourth segment would be eating enough. The first, second, fifth, and sixth segments would be living comfortably.

Taking this table as a base, we see that all of the six families described by Davies are in the third segment, which has a participation of about 33 % in the total of agricultural familes, and thus are not representative.

But further if we look at the example of Barkham, the parish has only 200 inhabitants, and if we subtract the shopkeepers, the ale-house keeper, the in-house servants, and the rector and his family, we have probably 150 agricultural persons. 33 % of 150 is 50. But in the page with six families, we have 34 persons (men, women, children), who are all in the third segment. So the Rev. Davies is showing us two-thirds of the people in the poorest group in the parish, and this cannot be a coincidence.

Another interesting point is that of the number of persons per family. We have the information (Board of Agriculture / William Mavor, General View of Agriculture of the County of Berkshire, 1813, Population, p. 484),that there were 185 persons in the parish, in 39 families. This is 4.7 persons per family, i.e. man, wife, and 2.7 children. Thus families with 3 to 5 children as given in the Rev. Davies’ page for Barkham, are not the norm in Barkham. 

What is the explanation? Obviously David Davies is not intentionally giving us misleading figures about the families in his parish. His point is that people in the given situation are really poor, and something must be done on a national scale to help them. This group is his “target”. Everybody knew that families with children of working age, or without children (because recently married) earned enough to eat sufficient food. Davies nowhere states that the reports of income and expenses reflect the situations of the totality of the agricultural labourers in the country.

“Whence we may infer, that the present wages of a labouring man constantly employed, together with the usual earnings of his wife, are barely sufficient to maintain in all necessaries, independent of parish relief, the man and his wife with two small children;” (p. 24)

From the second table (although it is from 1838, the relative wages and costs between the different segments would be roughly the same), we see that there is a large effect as to the “margin” of income against wheat costs, from the number of children over 10 and working.

The best paid group from the agricultural labourers, was that of the young men and women from 15 to 25, who worked as “farm servants”, in the occupations of house servants, milk maids, ploughmen, etc.; they ate a good quality of food in the farmhouse, slept there, and received wages which were contracted for the year. Thus they had practically no outgoings, and could save their wages. The idea was that they could save from 20 to 30 pounds, up to the time that they got married.

“Formerly it was not uncommon for young men and women to save in service twenty or thirty pounds in money, besides furnishing themselves with a decent stock of clothes, &c. But now young people are so unfrugal, that few of them have a decent suit to appear in even when they come to be married.” (p. 58)

“Neither can labourers themselves, who wish to migrate from their parents, and set up for themselves, although they may possess the small sum requisite to erect a cottage, always obtain permission from the lord of a manor to build one on a common.”

(Eden, 1797, Vol. 1, p. 361)

Davies does show us the circumstances of a family, who are able with hard work to cover all their expenses. But this is due to a number of facts: the man often works overtime, they live rent-free in the farmhouse, the mother spins, the boys of 12 and 9 together earn the half of the father, and they have a pig.  

(pp. 84-85)

Consumption of bread and meat per family per week

 7 pers.
  
Flour units 4 lb. (*)15
Meat or bacon lb. (+)7

(*) 4 lb. of flour gives 5 lb. of baked bread; (+) Pig bought and fattened in-house, plus bacon bought from shop

We may take this as a Medium Case, for calculations of the average economic conditions of agricultural families. They are between the third and fourth segments according to the first table above. They will of course be even better off, when the children are each 3 years older!

A large number of families in Berkshire had a better standard of living than that shown by the Rev. Davies, as they had plots of land, and animals.

“In the eastern parts of the county, many cottagers pay their rent and leave a surplus for themselves, from pigs, geese, and domestic fowls, in some place, their gardens and orchards yield the same advantages.”

(Board of Agriculture / William Mavor, General View of the Agriculture of the County of Berkshire, 1809, p. 75 footnote)

The totality of the Rev. Davies’ investigations, that is, from the reports sent back by his contacts in other counties, refers to 134 families in 20 counties. In general they show families with the same family structure as the 6 families in Barkham, and in the same penurious conditions (only 23 families show a “surplus”).

In your author’s opinion, although it is true that these families are having a hard time, and not always eating well, as is shown by the textual comments, the figures are somewhat pessimistic, as in many cases they do not include harvest pay or task-work, and do not include “gleaning” (at least 4 weeks of grain consumption a year). On the other hand, they do not show a reserve for the days that the man might be unable to work.

11.7. Jonas Hanway (1767) and Arthur Young (1771)

We have two persons who give us some data about incomes and expenses around the year 1770: Jonas Hanway and Arthur Young. Hanway was a philanthropist, founder of the Marine Society, which looked after very poor boys and found them employment in ships of the Royal Navy, and governor of the Foundling Hospital. As he was involved in the care of poor persons, he was well informed about their financial conditions.

“Let us see how a poor man can live, and whether at the present prices of provisions he has or has not cause to complain.

Bread, 1 ½ lb. at 1 d. per lb. is per ann.          2    5    7

Cheese, 3 oz. at 4 d. per lb. is per ann.            1    2  10

Meat, 4 oz. for 6 days in the week (or roots,

    Vegetables, &c. at 3 lb. per lb. is per ann.  0  19   6

Clothing per ann.                                               1    4   0

Soap, candles, cottage, and other articles        1  00   7

                                                                        6 12   6

Here is nothing for beer, which is an essential article to his health, as well as the joy of his heart; he will drop his bread and die, rather than his beer. If he pays 1 ¼ per lb. for bread, as at this time, then his life will cost him more, 1 l. 2 s. 9 d. or in all 7 15 3                       

Some do not eat ¾ lb. of bread, nor expend above 15 s. in clothing. If a man is in health and strength for laborious work, instead of the computation of                                          

6  12   6

he will earn 1 s. 6 d. a day, for 6 days in a week, which amounts to                                

23    9   6

consequently there remains                            16  17   0

which he has to lay out in beer and meat, or clothes, or whatever may be most agreeable to him. But being in this situation, we are to suppose if the wife and their children add 9 ½ d. a day, it makes both equal to 13 ¼ d., the computation I make of the value of labour, and both comes out per ann. to

35 l. 17 s. 3 d.

If they have 3 children to support, it comes out each person at 7 l.  3 s. 5 d., and if they have none, it must be supposed that they work for at least two others besides themselves; or that two others do not earn half so much for themselves or for the persons who employ them.”

(Hanway, 1767, Letters on the Importance of the Rising Generation…. , Vol. II, pp. 100-101)

We see that the families consume bread, cheese, meat, and beer, and still have a surplus from their income. However, it is not clear in the presentation, what are the food costs for the wife and children.

He also mentions that a large amount of meat is consumed in the country, although it may be that the main part is in London and the towns, and the poor eat a small amount which is arithmetically a surplus.

“The vast consumption of Meat, independent of Seasons or War, one great Cause of the Dearness of it.”

(Ibidem, Vol. II, heading to Letter XXXII, p. 191)

“Some of our domestics eat meat thrice in a day; no wonder if some of the poor cannot get at 3 or 4 ounces in 24 hours.”

(Ibidem, Vol. II, p. 191)

We have from Arthur Young, an estimate of the income and costs in 1771, for an average agricultural family, which he takes as 5 persons: man, wife, child of 15, child of 10, infant. 

            The menu with costs, for the man, he calculates as follows:

            “Seven-days Messes for a stout Man

                                                             s.  d.

First. Bread, 2 lb.                                          0    2

N. B. Wheaten-bread, 1 ½ d. and 2 d. per lb. ryed 1 d. and potatoe-bread, excellent good, ¾. The potatoes at 2 s. a bushel. A mixture of these three, in equal parts, I call 1 d. per lb. No bread exceeds it.

            Cheese, 2 oz. at 4 d. per lb.            0   0 ½

            Beer, two quarts [home brewed]   0   1

Second. Three messes of soup [incl. 3 oz. lean beef]                         

 0   2

Third. Rice-pudding,

            Half a lb. of rice, 1 d., two quarts of flet [skimmed] milk, 1 d. Sugar, ½ d.                                         

0   2 ½

Fourth. Quarter of a lb. of fat meat, and 1 ¾ of potatoes baked together, 1 ¾ d.

            Beer, 1 d.                                           0   2 ¾

Fifth. Rice-milk.                                             0  2 

Sixth. Bread, cheese, and beer as the first,                                             

0   3 ½

Seventh. Potatoes and fat meat, 2 ½ lb, 2 oz. of cheese and Beer,                                                   

0  4

Call the average 3 d. a day,                           1  8 ¼”

(Young, The Farmer’s Letters to the People of England…, pp. 196-197)

            He calculates the food costs for each member of the family proportionately:

“                                                                     s. d.

The man’s food,                                          1  8 ¼

His wife’s,                                                     1  1 ½

Child of 15 years old,      1   3 ½

Ditto, of 10,                                                   0 10 ½

Infant,                                                            1   0

                                                                        5 11″

(Ibidem, p. 198)

The yearly amount of expenses is:

“                                                                      l.   s.   d.

Six shillings a week amounts in the year to,  

15 12   0

To this sum we must add others, which cannot be divided into weekly or daily parts.

House-rent,                                                       1 10   0

Cloaths,                                                             2 10   0 

Soap and candles,                                           1   5   0

Loss of time and physick during illness          1   0   0

                                                                        21 17   0″

(Ibidem, pp. 198-199)

The yearly income is as follows:

“Labourers and manufacturers, earn upon a medium, about 1 s. 3 d. a day, which is per ann.                             

19 10 0                   

The wife earns, on a medium, better, I believe, than a fourth of the husbandsman’s pay: I shall call it a fourth,                             

        4 17  6

The medium of boys and girls, of 15 years old, earn the half of their fathers, which is 9 l. 15 s., but I shall say only,

                                                               9   0  0 

Ditto of 10 years old, a fourth,                         4   7  6

                                                                        37 15  0

(Ibidem, p. 199)

Which then gives a balance of:

“                                                                        l.   s.  d.

Year’s earnings                                                37 15  0

Ditto expenses                                                 21 17  0

Receipt exceeds the expence by                      15 18  0

(Ibidem, pp. 199-200)

Young says that this yearly amount, even if decreased somewhat by unnecessary purchases, is enough to give the man enough to accumulate savings for his old age.

As a basis for evaluating the exactness of this calculation, Young found four agricultural workers, with the same family structure as above, and asked them for their real outgoings. The average expenses were as follows: 

“                                                                      l.   s.    d.

Bread per day, 6 lb. 9 oz. at 1 ½ d. per lb. is 9 ¼ d.       

                               0   5   8 ¼

Cheese, 13 oz. [per day] at 4 d.                      0   1   9

                                                                         0   7   5 ¼

Call this 7s. 6d. it is per ann.                          19 10  0

Beer, 1 s. 6 d. per week,                                   3 18  0

Soap and candles,                                             1   5  0

Rent,                                                                 1 10  0

Cloaths,                                                             2 10  0

Fuel,                                                                  2   0  0

Illness, &c.                                                        1   0  0

Infant,                                                               2 12  0

                                                                        34  5 0”

(Ibidem, p. 202)

The difference against the income given above, gives a surplus of 3 l. 10 s. 

In Young’s opinion, the consumption of bread is given too high, because it implies that the man proportionately would be eating 2 lb. 4 oz. of bread per day, plus cheese, which is difficult to imagine. In any case the family would have a monetary surplus. 

11.6. Absolute Figures as to the Standard of Living

We have now inspected the movements of wages and of living expenses from 1770 to 1815. But now we have to see if this means that the labourers lived in a state of mere subsistence for all this time, or if they ate sufficiently in general. (A segment that did suffer poverty and hunger, was that of families with several small children, and no children over 10 years with work) 

The condition of the agricultural labourers from 1770 to 1794 was not one of near starvation:

“In consequence of the very great price of bread-corn during the whole of 1794, the distresses of the Poor were unusually great, and the sums expended on their relief beyond all former example. If, however, we except the late period of scarcity (which was such as had not occurred for near a century before) it is believed that no period during the present reign [George III] can be adduced in which the condition of day labourers was not much more comfortable than that of the same class of people in what are often called the “good old times” of former reigns.”

(Eden, 1797, Vol. I., Abridged version, A. G. L. Rogers, E. P. Dutton, New York, 1929; https://catalog.hathitrust.org/Record/001742830, Ch. II, p. 111)

“The labouring poor, in general, earn nowsufficient to live decently cloathed, and in good health; some, I know, are not able, but such as their parish assists; I am speaking of those, that support themselves without maintenance.”  

(Arthur Young, The Farmer’s Letters to the People of England, 1771, W. Strahan, Vol. 1, Letter V, p. 204)

“Upon these averages I may remark, that they are high enough for maintaining the labouring poor in that comfortable manner, in which they ought certainly to live;»

(Young, The Farmer’s Tour through the East of England, 1771, Vol. 4, pp. 313)

“Bread in England may be reckoned at 1 ¼ a pound; but we must not, therefore, conclude, that it is near double the French price; for the materials are not the same. In England, it is very generally made of wheat, and the poor, in many parts of the kingdom, eat the whitest and best”

(Arthur Young, Travels During the Years 1787, 1788, & 1789, ….The Kingdom of France, 1794, Vol. I, W. Richardson, London, p. 442)

“In England, the consumption of meat, by the labouring poor, is pretty considerable; … the consumption of cheese in England, by the poor, is immense.” (Arthur Young, op. cit. p. 443)

It is logically very unlikely that the day workers lived in a state of minimum subsistence:                       

  1. the food and care in the poorhouses in 1795 (a bad year) were, according to the reports compiled by Sir Frederick Eden, very good, with meat three times a week and a bed for each old person; it is not possible to mentally construct a socio-economic system in which the adult males working in the fields are not eating enough, and the old, the sick, the indigent, and the bastard children are eating well;
  2. the reports of Sir Frederick refer in general to the poor in the workhouses; he does not report much in the text about the poorest workers, or express any particular compassion for their circumstances;
  3. each year more than 100,000 cattle were driven from Scotland, Wales, and Northumberland; this is more than could be eaten by only the rich and the professional classes;
  4. in the General Views of Agriculture published in 1794, written with respect to 36 counties and reported by an equal number of surveyors, professional farmers and agricultural specialists, there are practically no expressions about horrible conditions of work, of food, or of clothing (although all of them criticise the cottages). We might perhaps think that professional persons did not have much emotional interest in the poorer classes and thus did not make any comments, but that not one of 36 persons said anything about these supposed bad conditions, makes us suppose that the conditions were not very bad. 

11.5. Price Increases in 1795 and 1800, and Reactions

At the beginning of 1795, there was a considerable shortage of cereal food and increases in food prices, due to a bad harvest in 1794 and extremely cold weather in December 1794 and January 1795. There were a large number of projects in the counties to help the poor (according to Edmund Burke, there was “a care and superintendence of the poor, far greater than any I remember”). 

Arthur Young used his “network”, i.e. subscribers to the “Annals of Agriculture”, to collect information about the size of the problem, and about what was being done (79 correspondents answered, from a total of 22 counties):

  • the farmers increased the basic wages to the labourers, in general by 1 shilling per week; 
  • the farmers sold wheat to their labourers at a subsidised level, usually 5 shillings or 6 shillings a bushel (this was not given to the same persons who had received a wage increase);
  • the farm labourers were given extra work on the farm, and the poor without employment were given work to improve the roads or dig drains, paid for by the local authority out of the poor-rates;
  • the unemployed in the villages could buy wheat and other food from the shops, at a price that was subsidised by the parish, or by general collections;
  • in a few cases, the very poor received the corn gratis;
  • firewood and coals were delivered free of charge to the cottages;
  • the professional men who had organized the collections of cash, in some cases went from house to house in the poorest areas of the village or town, giving the poor families an amount of cash according to their obvious needs.

In only one report (Essex) did the correspondent inform that the poor were really suffering. 

In a number of counties, the agricultural labourers did not feel the effect of the increase in the cost of wheat, as during many years, they had been accustomed to receive a part of their earnings directly in quantities of wheat.

“The poor are everywhere relieved, in this county, by liberal subscriptions from the landholders, and farmers; and committees are appointed, in each district, to sell meal and grain at such reduced prices as are equal to their wants. But in the north part of this county, and in Scotland, the farming poor feel the ill effects of the high prices of grain less than in any other part of the island I am acquainted with; because all our shepherds and hinds, &c. are hired in kind, viz. one or two cows each, and grain of different kinds suited to their wants, with also so much wool to each of the hinds; the shepherd needs none, as he has a quantity of sheep; a house rent free, and fuel brought home.”

(Young, Annals of Agriculture, Vol. XXIV, 1795 (1), Letter XV, Northumberland, p. 107)

The better classes, who were organizing these actions of charity, were somewhat irritated by the absolute refusal of the labourers to change from wheaten bread to barley or rye, or a mixture with barley or rye.

“There has no article of food been substituted in the place of wheaten bread, that I have heard of, in this county, or do I know what could be thought of, as the poorest person will not eat good rye bread, without they be drove to it by the greatest necessity.”

(Arthur Young, Annals of Agriculture, Vol. XXIV, 1795 (1), Letter XII, Durham, p. 97)

“No article of food has been successfully used as a substitute for wheaten bread; I believe the daintiness of the poor has been the chief obstacle.”

(Vol. XXIV, 1795 (1), Letter XXVI, Suffolk, p. 137)

“Further, we find the poor are too fine mouthed to eat inferior bread, till imperious necessity compels; and, happily, to that point we are not yet exactly arrived.”

(Vol. XXIV, 1795 (1), Letter XLV, Bristol, p. 204) 

“Not any substitute for wheaten bread has been use of in this part of the country; the poor in this neighbourhood eat as good flour as the gentlemen and farmers of tradesmen in general do.”

(Vol. XXIV, 1795 (1), Letter LX, Sheffield, p. 245) 

The reasoning of the labourers was that, as a large proportion of their consumption of food was bread, it had to be of good quality, so as to give them the energy to work: “…. they alledge [sic] that as they live almost intirely on bread, they cannot perform their labour without good bread.”

(Vol. XXIV, 1795 (1), Letter LXXVIII, Dorset, p. 316) 

Arthur Young was of the same opinion: 

“… To have but one sort of meal in the kingdom is certainly the only way to render the measure effective; it is, however, a strong measure to tell the labouring poor, who, from great exertions of bodily strength, earn wages sufficient to purchase the sort of bread which enables them to go through those exertions, that in future they shall not purchase it.”

(Young, Annals of Agriculture, Vol. XXV, 1796, Political Remarks on the High Price of Corn, p. 455)

[Late 1795 and all 1796]:

“The prices of all other provisions having risen in a greater or less proportion to wheat, and there being a very general apprehension of a continuance of the scarcity, it had become manifestly impossible for the working classes to subsist on their ordinary wages. It was partly from a conviction to this effect, and partly in consequence of the tendency to disturbance and riots among the agricultural labourers, that the allowance system was at this time introduced. There was at the same time a general acquiescence on the part of the employers in the necessity of some advance of wages, which, however, when conceded, bore still a very inadequate proportion to the increased price of the necessaries of life. The distress, accordingly, of the working and poorer classes was very severe, and the privations of the classes immediately above them, and generally of all classes depending on limited money incomes, were great. The whole period, indeed, of this memorable dearth, was one of great suffering for the bulk of the community.” 

(Tooke, 1838, pp. 185-186).  

“Section 2.- Rise of Wages from 1799 to 1801.

            Such and so great being the rise of prices of provisions, and of nearly all consumable commodities, it was quite impossible that the lowest of the working classes could, upon their wages, on the rate of what they were before 1795, obtain a subsistence for themselves and their families, on the lowest scale requisite for human existence; and the classes above the lowest, including some portion of skilled labourers, could do little, if at all, more than provide themselves with food, clothing, and shelter, without any of the indulgences which habit had rendered necessaries. If under these circumstances there had been no rise of wages, no contributions by parishes and by individuals, in aid of wages, great numbers of the people must have actually perished, and the classes immediately above the lowest would with difficulty have preserved themselves from the same fate. In such case the suffering from dearth would have been correctly designated as a famine, a term which has been somewhat loosely applied to the period under consideration. For, severe and intense as were the sufferings and privations of the people of this country, in the dearths of 1795 and 1796, and of 1800 and 1801, there were few recorded instances of death from actual destitution.

A rise of wages was imperatively called for by the urgency of the case, and was complied with to some extent in most of the branches of industry, the claims for increase being aided by the resource which workmen and labourers had of enlisting in the army and navy. There had already been an advance of wages in 1795 and 1796, and the allowance system had been begun and carried to some extent in those years. A further advance of wages took place in 1800 and 1801; but still so inadequate, compared with the prices of provisions, as even with parish allowances and private contributions, to leave a vast mass of privation and misery.”

(Ibid., pp. 225-227)

“Section 5.- On the Wages and Salaries as connected with the Prices of Necessaries [1809-1813].

It may be, as indeed it has been, observed as a ground for questioning, whether there was a scarcity in these seasons justifying the high prices, that although the prices of corn were as high as they had been in 1795, and 1796, and in 1800, and 1801, there was nothing like the same importance attached to them. No committees of parliament to inquire into the causes of the deficiency and to suggest remedies. The answer is that the high prices of 1795, and 1796, and of 1800, and 1801, came abruptly, combining dearth from failure of produce with the effects of heavy taxation, which fell directly or indirectly on consumable commodities, while wages and salaries had been adjusted to the scale of prices resulting from a state of peace and plenty. It has already been observed, in treating of those earlier periods of dearth, that they presented the alternative of the actual starvation of considerable numbers of the working population, or of a rise of wages, whether permanent, or temporary and variable. A great rise of wages, but still short of the rise of necessaries did take place, partly permanent, and partly temporary and variable, including under the latter description parish allowances and individual contributions. And not only did a rise of wages take place on the occasion of those memorable scarcities, but there was a further rise, when, after a short intermediate subsidence of the price of provisions, between 1801 and 1808, a recurrence of defective crops and increasing taxation, and consequent high prices of food and necessaries, gave occasion to further claims for advance of wages; in most occasions these had reached their maximum before 1812. 

The wages of agricultural labourers and artisans had been doubled, or nearly so. Salaries from the lowest clerks up to the highest functionaries, as well as the profesional fees, had been considerably raised on the plea of the greatly increased expenses of living; the expense of living having been increased, not only by the increased price of necessaries, but by a higher scale of general expenditure, or style of living, incidental to the progress of wealth and civilisation. Thus, upon the recurrence of the seasons of dearth between 1808 and 1812, there was more of an adjustment, although still inadequate, of the pecuniary means of a large part of the different classes, which prevented so great a degree of the pressure of distress as had been observable in the previous scarcity.But while the wages of agricultural labourers and of artisans had been raised in a considerable, although still inadequate proportion to the increased price of necessaries, this was not the case, or only partially so, as regarded the wages of the working people in manufacturies. Considerable numbers of these had no advance of wages; or if they had, the advance was more than compensated by reduced hours of work. In the branches of trade which were affected by the state of stagnation and discredit in 1810 and 1811, and those which depended on a demand for export, many workmen were thrown wholly out of employ. The distress accordingly among these classes was very severe, and was the cause of considerable disturbances in the manufacturing districts.” 

(Ibid., pp. 328-330)

We see, however, that in spite of the help given by the better classes to the poor in certain dates, the annual number of deaths increased by 10,000 to 20,000 in 1795, 1801-1803, 1810, 1814, and 1816.

Burials per Year, 1780-1820, England and Wales 

YearBurials YearBurials
     
1780192,000   
1781189,000 1801204,000
1782181,000 1802200,000
1783182,000 1803204,000
1784188,000 1804181,000
1785185,000 1805181,000
1786179,000 1806183,000
1787179,000 1807196,000
1788181,000 1808201,000
1789179,000 1809191,000
1790179,000 1810208,000
1791180,000 1811189,000
1792183,000 1812190,000
1793197,000 1813186,000
1794191,000 1814206,000
1795203,000 1815197,000
1796185,000 1816206,000
1797185,000 1817199,000
1798181,000 1818214,000
1799183,000 1819214,000
1800201,000 1820208,000

1780-1800, Marshall, 1832, p. 61; 1800-1820, equal figures from Marshall, 1832, p. 61, and Rickman, 1822, Preliminary Observations, p. xxiii.

Many of the agricultural labourers’ families could eat a little better than their monetary incomes would seem to indicate, as they had allotments with potatoes, or they had salt pork from a pig that they had fattened and then killed:

“Were it not for potatoes, with such wages, many of their families must starve or come upon the parish.”

(Vol. XXIV, 1795 (1), Letter IV, Shropshire, p. 61)

“Most of the poor people and labourers have a plot of potatoes in their garden, so they seldom have occasion to buy any.”

(Vol. XXIV, 1795 (1), Letter XLVI, Devon, p. 208) 

“Very few of our labourers but what kill a fat hog (which they bring up) of about 30 stone, of 8 lb. in general, and have mostly a good spot of garden ground to their cottages.”

(Vol. XXIV, 1795 (1), Letter LX, Sheffield, p. 245) 

There are also several references to the fact that, although the poor did not have the money to buy “butcher’s meat”, they did buy inferior parts of the animal, and parts of chicken, at reduced prices:

“These are the present prices of joints in the consumption of the poor;- breasts and legs of ewe mutton, 4 d. a pound; the shoulder clod of beef, 4 d.; belly pieces of hog, 5 d.; the cheeks, 3 ½ d.; butter made from whey, 11 d., salt butter, 9 d.; the most ordinary cheese, 5 d.; potatoes, 6d. a gallon; before the frost, 2 ½ d.”

(Vol. XXIV, 1795 (1), Letter XLII, Berkshire/Reading, p. 196) 

We have one comment on the long-term change in the financial situation of the poor:

“Upon an attentive consideration of all circumstances, I am inclined to think that the total present possible earnings of our poor, of every denomination, weavers, combers, spinners, and agricultural labourers, in this parish, is very little more than it was fifty years ago. These exigencies, mean time, from the advanced price of provisions of every kind, are increased, on the most moderate estimate, more than 2,500 L. a year; of this, only 500 L. have been annually supplied by our rates, and the remaining 2,000 L. have sunk them to that destitute condition in which we see them; have stript the cloaths from their backs, torn the shoes and stockings from their feet, and snatched the food from their mouths.”   

(Vol. XXIV, 1795 (1), Letter XXXIII, Essex, p. 161)

The new wages for 1795, and the increases in basic wages for the day-labourers, according to Young’s informants, were as follows:

  Per days. d.Per weeks. d.Advance
Bucks1 48 0some advance
Essex1 58 6one-sixth
Berks1 48 0one-fifth
Salop1 27 0one-seventh
Sussex1 58 6one-sixth
Lancaster1 4 ½ 8 3one-seventh
Staffordtwo pence a day
Kent1 810 0one-fifth
Durham1 48 0one-fifth
Lincoln1 69 0one-fourth
Norfolk1 48 0one-sixth
Nottinghamshire1 58 6one-seventh
Somerset1 27 0one-seventh
Hants1 58 6one-seventh
Cornwall1 58 6one-seventh
Middlesex1 99 0one-seventh
Anglesea0 115 6 
Gloucester1 27 0one-seventh
Cambridge1 27 0 
Huntingdon1 06 0 

(Vol. XXIV, 1795 (1), Recapitulation by the Editor, pp. 334-335)

Thomas Malthus commented on the very high prices in 1800, and the initiatives of private persons and parish administrators to help the poor labourers.

“The harvest of 1799 was bad, both in quality and quantity. Few people could deny that there appeared to be a very considerable deficiency of produce: and the price of the load of wheat rose in consequence almost immediately to £ 20. I returned from the north in the beginning of November, and found the alarm so great and general, and the price of corn so high, that I remember thinking that it was probably fully adequate to the degree of the deficiency, and, taking into consideration the prospect of importation from the very early alarm, that it would not rise much higher during the year. In this conjecture, it appears that I was much mistaken; but I have very little doubt that in any other country equally rich, yet without the system of poor laws and parish allowances, the price would never have exceeded £ 25 the load of wheat; and that this sum would have been sufficiently high to have excluded such a number of people from their usual consumption, as to make the deficient crop, with the quantity imported, last throughout the year.

The system of poor laws, and parish allowances, in this country, and I will add, to their honour, the humanity and generosity of the higher and middle classes of society, naturally and necessarily altered this state of things. The poor complained to the justices that their wages would not enable them to supply their families in the single article of bread. The justices very humanely, and I am far from saying improperly, listened to their complaints, inquired what was the smallest sum on which they could support their families, at the then price of wheat, and gave an order of relief on the parish accordingly. The poor were now enabled, for a short time, to purchase nearly their usual quantity of flour; but the stock in the country was not sufficient, even with the prospect of importation, to allow of the usual distribution to all its members. The crop was consuming too fast. Every market day the demand exceeded the supply; and those whose business it was to judge on these subjects, felt convinced, that in a month or two the scarcity would be greater than it was at that time. Those who were able, therefore, kept back their corn. In so doing, they undoubtedly consulted their own interest; but they, as undoubtedly, whether with the intention or not is of no consequence, consulted the true interest of the state: for, if they had not kept it back, too much would have been consumed, and there would have been a famine instead of a scarcity at the end of the year.

The corn, therefore, naturally rose. The poor were again distressed. Fresh complaints were made to the justices, and a further relief granted; but, like the water from the mouth of Tantalus, the corn still slipped from the grasp of the poor; and rose again so as to disable them from purchasing a sufficiency to keep their families in health. The alarm now became still greater, and more general. The justices in their individual capacities were not thought competent to determine on the proper modes of relief in the present crisis, a general meeting of the magistrates was called, aided by the united wisdom of other gentlemen of the county; but the result was merely the continuation and extension of the former system of relief; and, to say the truth, I hardly see what else could have been done. In some parishes this relief was given in the shape of flour; in others, which was certainly better, in money, accompanied with a recommendation not to spend the whole of it in wheaten bread, but to adopt some other kind of food. All, however, went upon the principle of inquiring what was the usual consumption of flour in the different families, and of enabling them to purchase nearly the same quantity that they did before the scarcity. With this additional command of money in the lower classes, and the consequent increased consumption, the number of purchasers at the then price would naturally exceed the supply. The corn would in consequence continue rising. The poor’s rates in many parishes increased from 4 shillings in the pound to 14; the price of wheat necessarily kept pace with them; and before the end of the year was at near £ 40 a load; when probably without the operation of this cause it would not have exceeded 20 or 25.” [One load of wheat = 5 quarters = 2,400 pounds] 

(Malthus, 1800, pp. 4-5)

11.4. Purchasing Power of the Wages

We now show the comparison between the wages and the price of the 4 lbs. of wheat, that is, how many 4 lb. units of wheat could be bought with one week’s wages.

A. Young
1770
Enq Board
Agric
General View
1st Serie
F. EdeEnq Board
Agric
General View
2nd Series 
1793179417951803
Bedford9.6 8.120.41808
Berkshire19.519.510.925.71808
Buckinghamshire16.3 12.519.31808
Cambridge10.7  22.51807
Cheshire33.5 14.219.31806
Cornwall   22.51808
Cumberland33.527.015.0  
Derby24.422.517.8 1816
Devon 21.011.715.01808
Dorset15.018.020.0 1811
Durham20.325.012.824.41810
Essex15.030.016.930.01807
Gloucester15.819.514.215.01805
Hampshire19.825.012.322.51808
Hereford 18.015.015.01804
Hertford16.818.08.8 1804
Huntingdon13.9   1811
Kent18.826.310.733.81803
Lancaster28.530.015.021.01809
Leicester22.520.511.322.51807
Lincoln15.022.815.9 1799
Middlesex18.827.015.018.81805
Monmouth18.027.019.316.41810
Norfolk16.323.314.1 1803
Northampton25.518.014.117.11809
Northumberland29.024.424.0 1805
Nottingham22.523.212.0 
Oxford13.8 12.015.81807
Rutland10.319.512.522.51808
Shropshire 19.112.5 1801
Somerset 18.010.0 
Stafford25.117.311.3 
Suffolk16.820.015.0 
Surrey 27.013.0 1809
Sussex22.521.312.3  
Warwick 19.110.0 1812
Westmoreland 45.023.8  
Wiltshire 28.110.6 1813
Worcester15.516.212.811.31805
York E Riding27.428.520.628.11811
York N Riding21.321.015.0
York W Riding19.524.018.8
Average18.422.713.521.0

In the terms of this table, the “sufficiency point”, would be about 15 units of 4 lbs. a week; that is, 60 lbs (one bushel per week), which was general held to be the food requirement for a family. At a level of 15, the basic weekly wage of the father would be enough for food; the sum of piece-work, the differences for hay season and harvest season, and the incomes for the wife and from children might just cover rent, fuel and clothing.

We see that the amount for 1795 (high prices due to the insufficient harvest, and the extreme cold at the beginning of the year), absolutely did not reach this level. 

Below we have a first approximation to a comparison of the earnings of the Middle Case family (see below, Absolute Figures as to the Standard of Living), and their cost of living, in terms of the inflation in wheat prices, for the years 1760 to 1825. The earnings include the hay and harvest wages, task-work income, and the earnings of the wife and children, and are taken to be 2.2 times the basic weekly winter wage, averaged over the counties of England. The living costs are equivalent to the price of 2.2 bushels of wheat, including an additional 30 %, which is the difference between the market price for wheat, and the price of the middleman to the labourers. (see Davies, 1795, pp. 33-34).   

According to these results, the average earnings kept up with the net movements in the wheat price during the years 1760 to 1794 (except 1766-1767), and also in the the years 1819 to 1825. In the years of scarcity and thus high prices (1795-1796, 1800-1801, 1808, 1810-1813), the weekly wage could not pay these prices.

11.3. Wheat Prices

Tooke, A History of Prices and of the State of the Circulation from 1793 to 1837, 1838, vol. 2, p. 390

We have also the prices at different dates, for the purchase of 4 pounds of wheat in the market. This is different from the unit used in the rest of this investigation, which is the quartern loaf. This is because, firstly, these are the data we have from our sources, and secondly, the agricultural workers bought the wheat and then baked the bread at home. It might seem that it would not be correct to use this unit of 4 pounds for a comparison, as there would be a difference in price, due to the price of baking in the bakers’s shop. However, there was also a difference in the weight of wheat used. By law, the quartern loaf had to weigh 4 ¼ pounds, and be made with 3 ½ pounds of wheat flour. Thus these two differences cancel each other out. 

The cost of wheat in the market has been taken in general from the same document (Young, General View 1st series, Eden, General View 2nd series) as was used for the weekly wages, for the same county and the same year. Thus the two numbers in each case were noted by the same rapporteur. If the wheat price data was missing, the number was taken from the Annals of Agriculture by Arthur Young. For 1824, the wheat price in each county was taken from the London Gazette for June 1824. 

A. YoungEnq Board
Agric
General View
1st Series
F. EdenEnq Board
Agric
General View 
2nd Series
177017901794179518031799-
1816
Bedford7.0 12.07.01808
Berkshire5.05.011.07.01808
Buckinghamshire6.0 9.07.01808
Cambridge7.0 7.01807
Cheshire3.0 9.07.01806
Cornwall 7.01808
Cumberland3.05.07.0  
Derby4.06.08.0 1816
Devon5.09.07.01808
Dorset6.05.06.0 1811
Durham4.04.510.08.01810
Essex7.05.08.06.01807
Gloucester5.55.09.010.01805
Hampshire5.04.511.06.01808
Hereford5.07.06.01804
Hertford6.05.012.0 1804
Huntingdon7.0  1811
Kent8.06.014.06.01803
Lancaster3.05.012.010.01809
Leicester4.05.512.08.01807
Lincoln6.05.08.0 1799
Middlesex8.05.010.08.01805
Monmouth5.05.07.011.01810
Norfolk6.04.58.0 1803
Northampton4.05.08.07.01809
Northumberland3.04.05.04.01805
Nottingham6.05.510.0
Oxford6.5 10.09.01807
Rutland7.05.09.07.01808
Shropshire5.59.0 1801
Somerset5.012.0
Stafford4.06.512.0
Suffolk6.06.08.0
Surrey 5.011.0 1809
Sussex6.06.011.0  
Warwick5.512.0 1812
Westmoreland3.06.0  
Wiltshire 4.012.0 1813
Worcester6.06.510.012.01805
York E Rid4.05.08.08.01811
York N Rid4.55.08.0
York W Rid5.05.08.0
Average5.45.19.47.6

We see that the average wheat price over the whole country practically did not move from 1770 to 1794, but then in 1795 – due to the scarcity – it nearly doubled. In 1824, it was about 15 % above 1770 and 1794.

In the worst years, the cost of wheat to the agricultural labourers was not so high as shown in the table, as in many cases the farmers sold them an amount equal to requirements of the family (1 bushel per week) at a reduced price of 6 shillings the bushel, i.e. 5 pence for 4 lb.

“In some cases, however, it was found customary for all the employers in a parish to agree in supplying the labourers with wheat at about 6s. per bushel, and which has been carefully issued to the respective peasant families in the following proportions:- a man, his wife, and two children, half a bushel of wheat per week; where there are three children, two pecks and a half, and thus increasing half a peck per head to the number of six children; the parents of which would receive weekly one bushel of wheat at the price above stated.” [1 peck = ¼ bushel]

(Board of Agriculture / Charles Vancouver, General View of the Agriculture of Hampshire, 1808, p. 388)

“In such years as 1810, 1811, 1812, the farmers must lose much money by allowing wheat at less than half the market-price; but in other seasons it is said that the poor are dissatisfied, on account of their receiving only the same nominal wages of 6s. or 7s. a week, as was the case twenty years ago.

About a bushel of wheat is consumed by a man and his wife and three children, which is more than 10 bushels each per annum. Some people assert, that the above-mentioned quantity is enough to supply a family of six persons; and the poor are sometimes accused of unnecessary wastefulness, in making cakes without yeast, and broiling or baking them on a gridiron, by which means, it is said, the quantity is lessened.”

(Board of Agriculture / William Stevenson, General View of the Agriculture of the County of Dorset, 1812, p. 453) 

11.2. Incomes

The wage level for the agricultural workers was defined by the “weekly winter wage” (for 41 weeks per year) in shillings per week. But this was only a standard figure. The earnings were also made up from the higher hay wage (6 weeks), the harvest wage (double amount for 5 weeks), piece-work (especially manual threshing), work by the wife, and work by the children. Further, in a number of cases the farmer gave the worker food in the farmhouse or in the field (particularly in the harvest month), beer or cider in the field, or sold the labourer his weekly requirement of wheat at a price below market. Gleaning of fallen grains could help the family save the expenses of one month of cereal. 

Arthur Young shows the combination of harvest, hay, and winter payments to give a yearly “medium”, expressed in shillings per week:

Young, The Farmer’s Tour through the East of England, 1771. Vol. 4, pp. 312-313

(The final average figure of 7s. 10 d. should be 8s. 7d.)

The “work by the piece” or “work by the great” was much more remunerative than the basic winter wage for field-work. Often the man worked the half of his days at piece-work; when converted to payment per day, the piece-work gave a daily income of 130 % to 160 % of that for field-work. The tasks covered a great number of activities:

(Board of Agriculture / Adam Murray, General View of the Agriculture of the County of Warwick, 1815, pp.167-168)

Young also gives the other job descriptions which could be part of the earnings of the family, basically work by the wife or by sons and daughters:

(Young, op. cit., Vol. 4, p. 317)

There were also a number of other persons employed by the farmer, such as ploughman, foreman, milkmaid, cook, who had “bed and board” in the farmhouse, ate well, and received a salary contracted on a yearly basis.

During much of this period, a superficial comparison of the total earnings of a family with the food prices may show that they can eat well. It is not clear why there could be a certain amount of poverty. The explanation is the progression in family size. It is very different to have a man, a wife, and 3 children under 10, to having a man, a wife, three children from 10 to 18, and 2 children under 10. In the first situation there are 3 mouths to be fed, while in the later situation 3 extra persons are earning. Thus perhaps 30 % of the families at a given point in time, do not have sufficient income. 

(Board of Agriculture / John Bailey, General View of the Agriculture of the County of Durham, 1810, p. 263)

“The pay per diem is but an imperfect representation of the real price of labour; in all parts of the kingdom, much work is done by the piece; and the labourer, by such, earns more by threepence to sixpence a day than the common pay; without this resource, the wages of labour would be too low for the support of the poor.”

(Young, Annals of Agriculture, Vol. XXV, 1795, p. 335) 

We have six sources of information as to wages in all of the counties in this period:

1769-1771      Young, Arthur: A Six Weeks Tour through the Southern Counties of England and Wales; A Six Months Tour through the North of England; The Farmer’s Tour through the East of England

1790                Board of Agriculture: Communications to the …, on Subjects relative to the Husbandry and Internal Improvement of the Country, London, 1806, Vol V., Part I, p. 18; Result of the Enquiry, being a Recapitulation of the Average Prices of the several Counties, 1790-1803: Labour

1794                Board of Agriculture: General View of the Agriculture of…. [a number of counties]

1797                Sir Frederick Eden: The State of the Poor; (IMPORTANT: Although the date of publication is 1797, the income and price data were collected in 1795-1796, a period of scarcity of wheat, and thus very high prices)

1803                Board of Agriculture: Communications to …(as above):

1799-1816      Board of Agriculture: General View of the Agriculture of…. [a number of counties], second series

These give us the following development of winter weekly wages for outdoor workers per county (if the data show that the workers received “board” free, an estimated figure is added to the basic wages):

A. YoungEnq Board
Agric
General View
1st Series
F. EdenEnq Board
Agric
General View 
2nd Series
177017901794179518031799-
1816
Bedford4.56.8 6.59.39.51808
Berkshire6.57.06.58.08.712.01808
Buckinghamshire6.57.0 7.510.29.01808
Cambridge5.06.9 9.910.51807
Cheshire6.79.0 8.511.09.01806
Cornwall6.2 8.910.51808
Cumberland6.78.39.07.010.8  
Derby6.56.09.09.510.212.01816
Devon7.07.07.08.77.01808
Dorset6.06.06.08.08.09.01811
Durham5.49.57.58.512.513.01810
Essex7.07.910.09.010.512.01807
Gloucester5.86.46.58.59.510.01805
Hampshire6.66.77.59.09.09.01808
Hereford7.06.07.09.06.01804
Hertford6.77.96.07.010.611.01804
Huntingdon6.5  11.51811
Kent10.09.610.510.013.513.51803
Lancaster5.77.810.012.013.314.01809
Leicester6.07.07.59.012.012.01807
Lincoln6.07.97.68.512.010.01799
Middlesex10.010.09.010.012.010.01805
Monmouth6.06.09.09.010.012.01810
Norfolk6.57.27.07.510.010.01803
Northampton6.86.26.07.59.58.01809
Northumberland5.86.56.58.09.8  
Nottingham9.07.78.58.012.5
Oxford6.06.5 8.08.59.51807
Rutland4.86.06.57.512.010.51808
Shropshire 6.57.07.58.29.01801
Somerset6.86.08.08.5
Stafford6.77.07.59.09.5
Suffolk6.76.88.08.09.5
Surrey7.58.59.09.510.713.01809
Sussex9.08.48.59.011.0  
Warwick8.07.08.09.015.01812
Westmoreland4.79.017948.2  
Wiltshire5.36.07.58.57.59.01813
Worcester6.27.08.59.01805
York E Rid7.38.19.511.012.515.01811
York N Rid6.48.17.08.012.5
York W Rid6.58.18.010.012.5
Average6.67.37.78.510.310.6

We see that the weekly winter wage (nominal), averaged over the whole country, increased from 6.6 shillings in 1770 to 10.6 shillings in 1816. 

We can extract from the above table the movements in weekly winter wages, for the different regions of England:

177017901794179518031799-
1816
North6.38.08.49.511.912.7
Midlands6.47.17.48.210.210.9
South West5.86.56.87.88.68.7
South East7.47.88.58.810.611.3
England6.47.37.78.510.210.5

North –          Cheshire, Cumberland, Durham, Lancashire, Northumberland, Westmoreland, Yorkshire

Midlands –    Bedford, Berkshire, Buckingham, Derby, Huntingdon, Leicester, Lincoln, Northampton, Nottingham, Oxford, Rutland, Stafford, Warwick

South West – Cornwall, Devon, Dorset, Gloucester, Hereford, Monmouth, Shropshire, Somerset, Wiltshire, Worcester

South East –   Cambridge, Essex, Hampshire, Hertford, Kent, Middlesex, Norfolk, Suffolk, Surrey, Sussex

(Regions defined as in Clark, 2001, p. 11)

Index 1770-1774 = 100.0 in each line

177017901794179518031799-
1816
North100.0126.1132.0149.5188.2200.4
Midlands100.0110.1115.4128.3158.5169.3
South West100.0113.1117.3135.6148.6149.9
South East100.0106.1115.4118.5143.0153.2
England100.0114.3120.7132.9159.0163.5

The North increased in proportion to the other regions in this period; this effect is even stronger when we take into account that the people there ate oats, which were much cheaper than wheat, and thus a smaller proportion of the total income.

There was a small increase from 1794 to 1795, which was absolutely not enough to compensate for the extremely high prices of wheat and other foodstuffs in 1795 and 1796.

The counties with the lowest weekly wages during the period were: Bedford, Cambridge, Dorset, Gloucester, Monmouth, Oxford, and Wiltshire. The highest weekly wages were in: Kent, Lancaster, Middlesex, Nottingham, and Sussex.

To check the yearly movements in the periods of high wheat prices, we also have some continuous series for individual counties, in the period from 1788 to 1825:

1790-1815, Essex: G. E. Mingay, Land, Labour and Agriculture, 1700-1920, Appendix 4.1, p. 90, Indices of Agricultural Labourers’ Wages, the Cost of Living and Real Wages, in Essex, 1790-1840.

1814-1815, Huntingdon, Report of the Select Committee on Labourers Wages, 1824, Minutes of Evidence, pp. 21-22.                    

1790-1815, Lincolnshire, Richardson, T. L., The Agricultural Labourers’ Standard of Living in Lincolnshire, 1790-1840: Social Protest and Public Order, Fig. 1, p. 4, Agricultural Labourers’ Wages at Stamford and the Cost of Living, 1790-1840.

1804-1815, Norfolk, Richard Noverre Bacon, The Report on the Agriculture of Norfolk for which the Prize was awarded by the Royal Agricultural Society of England, 1844, p. 144; The Average Price of Wheat per Coomb received, and Labourers’ Weekly Wages, paid from 1804 to 1844, on a Light-land Farm.

1790-1815, Northampton, Viscount Milton, Address to the Landowners of England on the Corn Laws, James Ridgway, London, 1832, https://catalog.hathitrust.org/Record/001737305, Table A, pp. 44-45.

1788-1815, Sussex, House of Commons, Report from the Select Committee to whom the several Petitions complaining of the Distressed State of the Agriculture of the United Kingdom were referred, 1821, p. 53

1788-1815, Somerset, Committees of the House of Lords appointed to enquire into the State of the Growth, Commerce and Consumption of Grain, and all Laws relating thereto, First and Second Reports, James Ridgway. London, 1814 https://archive.org/stream/firstsecondrepo00grea#page/n33/mode/2up, pp. 24 and 262-271.

1790-1815, Kent, H. G. Hunt, Agricultural Rent in South-East England, 1788-1825, British Agricultural History Society, Vol. 7.2., 1959, http://www.bahs.org.uk/AGHR/ARTICLES/07n2a4.pdf

1802-1815, Norfolk (Great Massingham), Brereton, Rev. C. D. (Rector of Little Massingham, Norfolk), Observations on the Administration of the Poor Laws in Agricultural Districts, J. Hatchard and Son, Norwich, 1824, p. 101.

1811-1815, Middlesex (Houndslow), Select Committee of the House of Lords, appointed to consider of the Poor Laws, 1830-1, Minutes of Evidence, Ordered to be Printed, 7th December 1830, p. 109

1788-1815, Cumberland, John Rooke, An Inquiry into the Principles of National Wealth, A. Balfour and Company, London, 1842, Table I, Part II, p. 432.

These give us the following comparison of the movements:

1788178917901791179217931794179517961797
Essex7.57.57.57.57.58.38.38.3
Huntingdon
Lincoln9.19.19.19.19.810.110.510.5
Norfolk
Northampton7.0
Sussex9.09.09.09.09.09.09.010.012.012.0
Somerset7.57.57.57.57.512.012.012.012.012.0
Kent9.09.09.09.09.09.09.012.0
Norfolk        
Middlesex        
Cumberland7.07.07.07.57.57.08.08.08.09.0
 
Average  8.28.38.38.99.29.610.010.1
Adjusted x0.9 7.47.47.48.08.38.69.09.1
1798179918001801180218031804180518061807
Essex8.38.38.38.78.78.79.09.09.09.4
Huntingdon
Lincoln10.510.011.011.011.011.011.011.011.011.0
Norfolk8.010.09.09.0
Northampton7.07.07.09.09.010.010.010.010.010.0
Sussex12.012.012.015.015.015.012.013.013.013.0
Somerset12.012.012.012.012.014.014.014.014.014.0
Kent12.012.012.012.012.012.012.012.015.015.0
Norfolk12.011.012.012.012.012.0
Middlesex  
Cumberland9.010.511.5 11.5 11.5 12.0 13.5 14.5 15.0 15.5 
Average10.110.311.511.511.411.711.311.712.012.1
Adjusted x0.99.19.210.310.310.310.510.210.610.810.9

18081809181018111812181318141815
Essex9.49.49.49.510.210.410.410.4
Huntingdon14.011.5
Lincoln11.011.012.012.012.012.012.012.0
Norfolk9.010.512.010.015.013.510.010.0
Northampton10.010.010.012.014.014.014.012.0
Sussex13.013.013.013.013.013.013.013.0
Somerset14.014.014.014.014.0
Kent15.015.015.015.018.018.015.013.5
Norfolk12.012.012.015.015.015.012.010.0
Middlesex   18.018.018.015.015.0
Cumberland15.515.515.515.015.014.414.013.5
 
Average12.112.312.513.414.414.312.912.1
Adjusted x0.910.911.011.312.013.012.8

As we have consistent figures from twelve different sources, we may assume that wages of this magnitude were given in all of England.

We see that the wages in these counties moved gradually up to about 12 shillings in 1810, and remained there until 1820. From the beginning of the French Wars in 1792, to the maximum price of wheat in 1812, the increase was from 7.5 shillings to 12 shillings, that is, 60 %. 

From the above data, we can construct a table of winter weekly wages from 1770 to 1825, with considerable certainty:

17706.517907.4181011.3
17716.617917.5181112.0
17726.617927.5181213.0
17736.617937.5181312.8
17746.617947.7181412.9
17756.617958.9181512.1
17766.617969.3
17776.617979.3
17787.017989.2
17797.017999.2
17807.018009.3
17817.0180110.3
17827.0180210.2
17837.0180310.3
17847.0180410.5
17857.0180510.6
17867.0180610.8
17877.1180710.9
17887.2180810.9
17897.3180911.0

We can compare these data with the weekly wages from another study: 

Gregory Clark, Farm Wages and Living Standards in the Industrial Revolution: England, 1670-1850, 2001.

His document is based on a collection and analysis of a large number of real individual wage payments, as found in farmers’ and estate administrators’ books.

The two series are extremely close, which gives us security that they are reporting the real facts “on the ground”. There is small difference for the period 1795-1796. We have information from Arthur Young, that as a measure against the increase in wheat prices and the scarcity in 1795, the weekly wages were in many places increased by 1 shilling. Clark does not show this. This may be because a) Clark could not collect his data with a detail of individual years, or b) the increase was not actually given in a majority of counties, and thus Clark is nearer to the reality. 

The above movements in weekly wages are in general confirmed by the chronological reports of Mr. Thomas Tooke, in his book on “A History of Prices and of theState of the Circulation from 1793 to 1837”, written in 1838. 

11.1. External Factors

The importance of this chapter and the following chapter is to construct a quantitative description of the living standards in agriculture from 1770 to 1860, and particularly in the last years of the period. This should help us to understand the effect of the Industrial Revolution on this section of the population.

The three important points to be checked about the incomes of the agricultural labourers at the end of the eighteenth century and the beginning of the nineteenth century are:

  • did the incomes of these persons keep up with the increases of food prices, due to the effects of the wars (1792-1815) and to the bad harvests, during the period?
  • was the proportion of income to food costs at the beginning the period maintained at the end of the period?
  • did the labourers suffer generally poverty and hunger during this period? 

When we have these general data, we will have a good idea of the standard of living in the countryside in 1815, and then can see if the living conditions in 1815-1840 are a continuation of those in 1815, or if something happened to change the general economic situation for the agricultural labourers.

The main economic and political events or situations which had an effect on the living standards of the agricultural population in this period were:

  • enclosure of the commons lands, that is, privatization of these lands for the benefit of the better classes, and thus taking away the use of these areas (wood and brush for fire, pasture for cows) for the generality of the agricultural population;
  • French Revolutionary and Napoleonic Wars from 1792 to 1815, which removed about 400,000 men from the agricultural working segment, and thus gave a better negotiating position for the remaining workers as to their wages;
  • extreme scarcity of cereals in some years, which caused a more than doubling of the wheat price; 
  • beginnings of industrialization in the woollens industry and thus reduction of the cost of spinning, which made it uneconomic for the labourers’ wives to work on spinning in their cottages;
  • increase in the volume, and reduction in the price, of cotton cloths, which caused a change from woollen clothing to cotton, and at a lower expense;
  • introduction of potato growing, starting in 1770-1780, which gave the labourers a cheaper alternative to bread;
  • changes in the mechanism of the Poor Rates (especially Speenhamland 1795), which practically gave the poorest labourers a guaranteed income level, defined in proportion to the price of a loaf of bread.   

Enclosures

The majority of the farming lands in England in 1760 (excluding Kent, the South West, the North) were organized as “open fields”, that is there was a large area, without fences or walls, which was legally part of the parish or manor, but divided into strips of land which were farmed by individual peasants; one peasant would have a number of non-contiguous strips.

(Slater, 1907, facing p. 8)

The map of Laxton, Nottinghamshire, as shown, dates from a book of 1907, showing the arrangement of the strips of fields, as it was then, and as it had been for centuries. Today (2019) it is one of only three open fields existing in England. 

The process of “enclosure” meant that the landlord of the field was empowered by Act of Parliament to amalgamate all the strips and prohibit the peasants from using “their” lands. He would rent large areas (contiguous) of the field each to a person interested in farming it, which would be done in a much more efficient way. From 1760 to 1870, 7 million acres (one-sixth of the area of England) of common lands were enclosed. (There was another form of “enclosure” by which waste lands not being used for agriculture could be incorporated; 800,000 acres.)

The removal of the “common lands” to private ownership, meant in financial terms that: i) for the better-off workers, they lost the possibility of pasturing a cow, which had given them about 20 pence a week income, and had given them milk for their children; ii) the families could not collect gratis the small wood or gorse etc. for fuel, and thus had to buy wood or coals.   

The change in terms of employment, meant that instead of being peasants with land, they were now wage earners. Many could not find employment with the new owners, as the work was now done more “efficiently”; areas which were changed from tillage to pasture, there was little employment, and areas which changed from pasture to tillage, the number of hands required increased. Those that lost employment had to “go on the parish”, look for work in and industrial town, or emigrate to America. Large regions in some counties lost a considerable part of their population. Cobbett in his “Rural Rides” particularly puts before our eyes the case of the Avon valley in Wiltshire, where the population of an area which had had twenty-nine parishes, is reduced to the half of that of the parish of Kensington. But they do produce a large amount of wheat, barley, sheep, and hogs; in the village of Milton, 100 families (poorly paid) produce food for 500 families (Cobbett, 1830, pp 363-372).   

The animals which were pastured on the improved fields were larger and healthier. “Cattle: Enclosures 571, Increased in 354, Decreased in 106, As before in 111. The full increase in produce does not appear in these numbers, for the difference in the size and calue of the cattle is exceedingly great: it has been a change from poor half starved breeding stocks, to the best breeds for beef. …. Sheep: Enclosures 721, Increased in 467, Decreased in 157, As before in 97. The remark I made on cattle is equally applicable to sheep; these numbers, great as the increase is, do not mark the whole; for before, they were poor, lean, hungry, half starved common fed flocks for folding; but, since, are become far superior in breed, value, and food. …. In fact, the production of mutton and beef has increased enormously, beyond credibility to those who look only to the price they pay, notwithstanding the vast increase of produce.” 

(Board of Agriculture, 1808, General Report on Enclosures, pp. 62-63).

Appendix IV of the above-mentioned Report quotes information given by professional persons and curates, as to the “Effect on the Poor, of the Enclosures which took place during the first Forty Years of His present Majesty” [i.e. up to 1800], in 11 tabular pages. The evaluation is in every case negative. The effects are given as: the poor have lost their cows, and the milk; poverty has generally increased; fewer hands required, and poor rates increased; great decrease in consumption of cheese and pigs; nearly the whole of the owners “come to the parish”; had to sell their tenements.

Loss of spinning income

Many of the wives of the labourers could add something to the household income, by spinning wool. There are two pieces of information from Arthur Young, one from 1788 (vol. IX, pp. 349-353) that the daily pay for adult women was 4d. in Hereford, 6d. in Oxfordshire, and 9d. to 1s. in Sussex, Hampshire, Lancashire and Yorkshire, averaging 6d.,  and another from his correspondents in 1793 (vol. XX, pp. 178-187), with 6d. to 9d. a day in different counties. Sixpence a day was three shillings a week, or about 40 % of the basic weekly wage of the husband. Expressed at an annual level, it was seven pounds a year, which would make a large improvement in the “deficiencies in earnings” in the family budgets which we have seen. 

But starting from 1790-95, the majority of the wives did not spin any more, because the low costs of spinning with the new machines, made it impossible for them to compete. The small jennies were bought and used by some agricultural families, who had enough money to buy one (the woman could earn 10 shillings a week), or by a businessman who bought a number of the machines, and installed them in a small town. 

“The earnings by spinning have for the last year been much curtailed, owing to the wool-staplers using spinning engines, near their place of residence, in preference to their sending wool into the country to be spun by hand. And whereas a poor woman and two small children (which is the average household of a labourer) could heretefore earn fourteen pence per day, they cannot now earn more than ten pence; …..” [“two small children” means “two small girls, of an age to work on spinning”] 

(Young, Annals of Agriculture, Vol. XXVI, 1796 (1), Letter XXV, Cornwall, pp. 18 and 19)   

“The children of the poor are put to some kind of employment as soon as they are able to work. In the manufactories, particularly the clothing, the introduction of machinery has supplied work for very young children, though probably at the expense of health and morals in the rising generation. It has also annihilated the means of domestic employment of women and children, not only in the adjacent villages, but through the whole agricultural district, to the extent of forty miles. The families of labourers who were used to earn a good deal towards their maintenance by spinning, have now no employment in winter, and only a partial supply of such agricultural business as is suited to their strength in summer.”

(General View of the Agriculture of the County of Gloucester, 1807, Poor, pp. 346-347) 

“It is a melancholy fact, that without any particular acts of oppression on the part of the farmers, or of dissoluteness on the part of the poor, the labourers of many parts of this county, and of the South-east District in particular, may truly be said to be at this time in a wretched condition. The dearness of provisions, the scarcity of fuel, and above all, the failure of spinning-work for the women and children, have put it almost out of the power of the village poor to live by their industry, …..” 

(Board of Agriculture / Thomas Davis, General View of the Agriculture of the County of Wiltshire, 1811, p. 215)

 “Formerly, all the women and children in the neighbouring villages, from 10 to 15 miles around, used to be employed in spinning yarn, and the wife and children, on average, could earn nearly as much as the husband. 150 wool-combers used to be employed in Lavenham, each of whom furnished work for 30 spinners. There are now only 16 wool-combers in this and all the adjoining parishes. Their work is quite superseded by machinery; the population is now become almost purely agricultural, and much less well off than formerly.”

(Reports of Special Assistant Poor Law Commissioners on the Employment of Women and Children in Agriculture, 1843, p. 228, Lavenham)

Mr. John Marshall gave the Hand-Loom Weavers Commission a description of what had happened in the countryside from 1790 to 1820:

“…. The census of 1831 proves that the extended application of machinery has annihilated all the domestic industry or domestic manufacture which used to prevail amongst at least from 800,000 to 1,000,000 of families, and which were carried on, not to a large extent, but to such an extent as supplied all the domestic comforts of the family. Domestic manufacture used to pervade every labourer’s cottage, every farm-house, and the habitations of the handicraftsmen. The labourers’ families were more generally employed in carding and spinning of wool, given out by the shopkeepers of the villages; and the yarn, after being taken back by them in exchange for the articles of the shop, passed into other hands to be wove; the farm-houses and the houses of the handicraftsmen, such as the smiths, carpenters, wheelwrights and persons of that description, were more generally employed in the spinning of flax, the yarn of which they afterwards sent to be wove, some for sale and some for domestic use. …. I think that the great alteration which has taken place, has been the means of placing the artizan more completely in a state of dependence upon the manufacturer. My own knowledge of the fact embraces an extensive district in the midland counties, in which I can look back upon the habitations of 50 families, whom I knew as agricultural labourers 35 or 40 years ago, living in great comfort, the mother and children of the family exchanging the produce of their labour at the wheel to the extent of 2s., 3s., 4s., or 5s. a week, all of which operation is now annihilated; and owing to its absence it is that so much privation prevails among the farm labourers in certain districts; and it will be seen, on a close investigation, that there is a greater pressure of poor-rates in all those districts where manufacturing operations were more extensively carried on, as in certain parts of Wiltshire and Hampshire, and more particularly the counties of Essex, Suffolk, and Norfolk, are found to present a far greater parochial assessment than any other district in the kingdom, notwithstanding their superior advantages in an agricultural point of view, in having the benefit of the London market.” 

(Analysis of the Evidence … , Mr. John Marshall, pp. 19-20)

But there were also cases in which the women and girls could find work in small domestic manufacture:

“…. In the straw work, which is the staple manufacture of the place, a woman can earn from 6s. to 12s. a week; children from 2s. to 4s. a week. This business has given employment, for the last 20 years, to every woman, who wished to work; and, for 10 years back, straw work has sold well, particularly in the spring. ….. The straw is mainly manufactured into hats, baskets, &c.”

(Eden, 1797, Vol II, Parochial Reports, Bedfordshire, Dunstable, p. 2) 

“ …. Other commentators believed men were discouraged from seeking continuous employment, allowing their wives and children to become the chief breadwinners of the family. Burns claimed that “it is too much the case that married men, knowing their wives and families can earn enough to support themselves by plaiting, take no care about them, and spend all their earnings at the beer-houses.””

(Nicola Verdon, Rural Women Workers in Nineteenth-century England, The Boydell Press, Woodbridge, Suffolk, 2002; p. 148)   

Bad Harvests

The prices of wheat in the markets, in shillings per quarter (480 lbs.), showed very high figures in mid-1795 to mid-1796 (the physical scarcity started in January 1795, due to an extraordinary cold spell), end 1799 to mid-1801, early 1809 to late 1813, mid-1816 to mid-1817. The first three cases were due to “back-to-back” bad harvests. The last period was probably due to the “year without a summer”, caused by the explosion of Mount Tambora in Indonesia.

In the majority of years from 1794 to 1821, due to weather problems, the harvest was not sufficient in quantity or in quality. This caused hunger, but not deaths from starvation (there were perhaps ten thousand additional deaths in 1795-1796 and in 1799-1800, from pneumonia and fevers, acting on people weakened by the hunger).

YearHarvest QuantityHarvest Quality
   
1790Peace and favourable Seasons 
1791   “       “         “               “ 
1792   “       “         “               “ 
1793War but favourable Seasons 
1794Deficiency of crop 
1795       “          “     “ 
1796Season less unfavourable 
1797      “       “           “ 
1798      “       “           “ 
1799Bad season 
1800   “      “ 
1801Good crop followed by Peace 
1802Favourable crop 
1803       “             “ 
1804Deficient crop 
1805Average Crops 
1806      “           “ 
1807      “           “ 
1808Partial deficiency 
1809Great deficiency 
1810Good crop 
1811Deficiency 
1812Favourable Crop 
1813        “            “ 
1814Nearly average crop 
1815Full average CropQuality good

(“Harvest Quantity”: Journal of the Royal Statistical Society, Vol. 1, 1839, pp. 56-57)

(“Harvest Quality”: Tooke, A History of Prices … 1848-1856, 1857; p. 129)