The wage level for the agricultural workers was defined by the “weekly winter wage” (for 41 weeks per year) in shillings per week. But this was only a standard figure. The earnings were also made up from the higher hay wage (6 weeks), the harvest wage (double amount for 5 weeks), piece-work (especially manual threshing), work by the wife, and work by the children. Further, in a number of cases the farmer gave the worker food in the farmhouse or in the field (particularly in the harvest month), beer or cider in the field, or sold the labourer his weekly requirement of wheat at a price below market. Gleaning of fallen grains could help the family save the expenses of one month of cereal.
Arthur Young shows the combination of harvest, hay, and winter payments to give a yearly “medium”, expressed in shillings per week:


Young, The Farmer’s Tour through the East of England, 1771. Vol. 4, pp. 312-313
(The final average figure of 7s. 10 d. should be 8s. 7d.)
The “work by the piece” or “work by the great” was much more remunerative than the basic winter wage for field-work. Often the man worked the half of his days at piece-work; when converted to payment per day, the piece-work gave a daily income of 130 % to 160 % of that for field-work. The tasks covered a great number of activities:

(Board of Agriculture / Adam Murray, General View of the Agriculture of the County of Warwick, 1815, pp.167-168)
Young also gives the other job descriptions which could be part of the earnings of the family, basically work by the wife or by sons and daughters:

(Young, op. cit., Vol. 4, p. 317)
There were also a number of other persons employed by the farmer, such as ploughman, foreman, milkmaid, cook, who had “bed and board” in the farmhouse, ate well, and received a salary contracted on a yearly basis.
During much of this period, a superficial comparison of the total earnings of a family with the food prices may show that they can eat well. It is not clear why there could be a certain amount of poverty. The explanation is the progression in family size. It is very different to have a man, a wife, and 3 children under 10, to having a man, a wife, three children from 10 to 18, and 2 children under 10. In the first situation there are 3 mouths to be fed, while in the later situation 3 extra persons are earning. Thus perhaps 30 % of the families at a given point in time, do not have sufficient income.

(Board of Agriculture / John Bailey, General View of the Agriculture of the County of Durham, 1810, p. 263)
“The pay per diem is but an imperfect representation of the real price of labour; in all parts of the kingdom, much work is done by the piece; and the labourer, by such, earns more by threepence to sixpence a day than the common pay; without this resource, the wages of labour would be too low for the support of the poor.”
(Young, Annals of Agriculture, Vol. XXV, 1795, p. 335)
We have six sources of information as to wages in all of the counties in this period:
1769-1771 Young, Arthur: A Six Weeks Tour through the Southern Counties of England and Wales; A Six Months Tour through the North of England; The Farmer’s Tour through the East of England
1790 Board of Agriculture: Communications to the …, on Subjects relative to the Husbandry and Internal Improvement of the Country, London, 1806, Vol V., Part I, p. 18; Result of the Enquiry, being a Recapitulation of the Average Prices of the several Counties, 1790-1803: Labour
1794 Board of Agriculture: General View of the Agriculture of…. [a number of counties]
1797 Sir Frederick Eden: The State of the Poor; (IMPORTANT: Although the date of publication is 1797, the income and price data were collected in 1795-1796, a period of scarcity of wheat, and thus very high prices)
1803 Board of Agriculture: Communications to …(as above):
1799-1816 Board of Agriculture: General View of the Agriculture of…. [a number of counties], second series
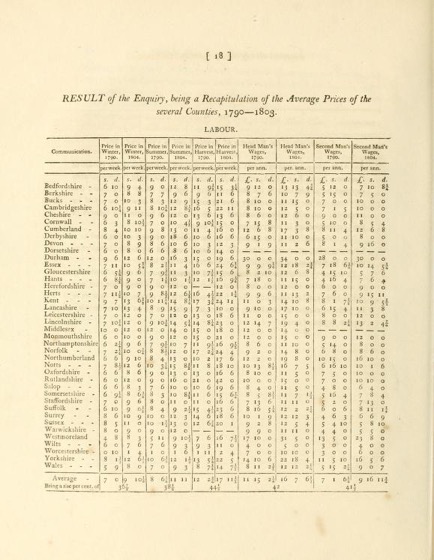
These give us the following development of winter weekly wages for outdoor workers per county (if the data show that the workers received “board” free, an estimated figure is added to the basic wages):
| A. Young | Enq Board Agric | General View 1st Series | F. Eden | Enq Board Agric | General View 2nd Series | ||
| 1770 | 1790 | 1794 | 1795 | 1803 | 1799- 1816 | ||
| Bedford | 4.5 | 6.8 | 6.5 | 9.3 | 9.5 | 1808 | |
| Berkshire | 6.5 | 7.0 | 6.5 | 8.0 | 8.7 | 12.0 | 1808 |
| Buckinghamshire | 6.5 | 7.0 | 7.5 | 10.2 | 9.0 | 1808 | |
| Cambridge | 5.0 | 6.9 | 9.9 | 10.5 | 1807 | ||
| Cheshire | 6.7 | 9.0 | 8.5 | 11.0 | 9.0 | 1806 | |
| Cornwall | 6.2 | 8.9 | 10.5 | 1808 | |||
| Cumberland | 6.7 | 8.3 | 9.0 | 7.0 | 10.8 | ||
| Derby | 6.5 | 6.0 | 9.0 | 9.5 | 10.2 | 12.0 | 1816 |
| Devon | 7.0 | 7.0 | 7.0 | 8.7 | 7.0 | 1808 | |
| Dorset | 6.0 | 6.0 | 6.0 | 8.0 | 8.0 | 9.0 | 1811 |
| Durham | 5.4 | 9.5 | 7.5 | 8.5 | 12.5 | 13.0 | 1810 |
| Essex | 7.0 | 7.9 | 10.0 | 9.0 | 10.5 | 12.0 | 1807 |
| Gloucester | 5.8 | 6.4 | 6.5 | 8.5 | 9.5 | 10.0 | 1805 |
| Hampshire | 6.6 | 6.7 | 7.5 | 9.0 | 9.0 | 9.0 | 1808 |
| Hereford | 7.0 | 6.0 | 7.0 | 9.0 | 6.0 | 1804 | |
| Hertford | 6.7 | 7.9 | 6.0 | 7.0 | 10.6 | 11.0 | 1804 |
| Huntingdon | 6.5 | 11.5 | 1811 | ||||
| Kent | 10.0 | 9.6 | 10.5 | 10.0 | 13.5 | 13.5 | 1803 |
| Lancaster | 5.7 | 7.8 | 10.0 | 12.0 | 13.3 | 14.0 | 1809 |
| Leicester | 6.0 | 7.0 | 7.5 | 9.0 | 12.0 | 12.0 | 1807 |
| Lincoln | 6.0 | 7.9 | 7.6 | 8.5 | 12.0 | 10.0 | 1799 |
| Middlesex | 10.0 | 10.0 | 9.0 | 10.0 | 12.0 | 10.0 | 1805 |
| Monmouth | 6.0 | 6.0 | 9.0 | 9.0 | 10.0 | 12.0 | 1810 |
| Norfolk | 6.5 | 7.2 | 7.0 | 7.5 | 10.0 | 10.0 | 1803 |
| Northampton | 6.8 | 6.2 | 6.0 | 7.5 | 9.5 | 8.0 | 1809 |
| Northumberland | 5.8 | 6.5 | 6.5 | 8.0 | 9.8 | ||
| Nottingham | 9.0 | 7.7 | 8.5 | 8.0 | 12.5 | ||
| Oxford | 6.0 | 6.5 | 8.0 | 8.5 | 9.5 | 1807 | |
| Rutland | 4.8 | 6.0 | 6.5 | 7.5 | 12.0 | 10.5 | 1808 |
| Shropshire | 6.5 | 7.0 | 7.5 | 8.2 | 9.0 | 1801 | |
| Somerset | 6.8 | 6.0 | 8.0 | 8.5 | |||
| Stafford | 6.7 | 7.0 | 7.5 | 9.0 | 9.5 | ||
| Suffolk | 6.7 | 6.8 | 8.0 | 8.0 | 9.5 | ||
| Surrey | 7.5 | 8.5 | 9.0 | 9.5 | 10.7 | 13.0 | 1809 |
| Sussex | 9.0 | 8.4 | 8.5 | 9.0 | 11.0 | ||
| Warwick | 8.0 | 7.0 | 8.0 | 9.0 | 15.0 | 1812 | |
| Westmoreland | 4.7 | 9.0 | 1794 | 8.2 | |||
| Wiltshire | 5.3 | 6.0 | 7.5 | 8.5 | 7.5 | 9.0 | 1813 |
| Worcester | 6.2 | 7.0 | 8.5 | 9.0 | 1805 | ||
| York E Rid | 7.3 | 8.1 | 9.5 | 11.0 | 12.5 | 15.0 | 1811 |
| York N Rid | 6.4 | 8.1 | 7.0 | 8.0 | 12.5 | ||
| York W Rid | 6.5 | 8.1 | 8.0 | 10.0 | 12.5 | ||
| Average | 6.6 | 7.3 | 7.7 | 8.5 | 10.3 | 10.6 |
We see that the weekly winter wage (nominal), averaged over the whole country, increased from 6.6 shillings in 1770 to 10.6 shillings in 1816.
We can extract from the above table the movements in weekly winter wages, for the different regions of England:
| 1770 | 1790 | 1794 | 1795 | 1803 | 1799- 1816 | ||
| North | 6.3 | 8.0 | 8.4 | 9.5 | 11.9 | 12.7 | |
| Midlands | 6.4 | 7.1 | 7.4 | 8.2 | 10.2 | 10.9 | |
| South West | 5.8 | 6.5 | 6.8 | 7.8 | 8.6 | 8.7 | |
| South East | 7.4 | 7.8 | 8.5 | 8.8 | 10.6 | 11.3 | |
| England | 6.4 | 7.3 | 7.7 | 8.5 | 10.2 | 10.5 |
North – Cheshire, Cumberland, Durham, Lancashire, Northumberland, Westmoreland, Yorkshire
Midlands – Bedford, Berkshire, Buckingham, Derby, Huntingdon, Leicester, Lincoln, Northampton, Nottingham, Oxford, Rutland, Stafford, Warwick
South West – Cornwall, Devon, Dorset, Gloucester, Hereford, Monmouth, Shropshire, Somerset, Wiltshire, Worcester
South East – Cambridge, Essex, Hampshire, Hertford, Kent, Middlesex, Norfolk, Suffolk, Surrey, Sussex
(Regions defined as in Clark, 2001, p. 11)
Index 1770-1774 = 100.0 in each line
| 1770 | 1790 | 1794 | 1795 | 1803 | 1799- 1816 | |
| North | 100.0 | 126.1 | 132.0 | 149.5 | 188.2 | 200.4 |
| Midlands | 100.0 | 110.1 | 115.4 | 128.3 | 158.5 | 169.3 |
| South West | 100.0 | 113.1 | 117.3 | 135.6 | 148.6 | 149.9 |
| South East | 100.0 | 106.1 | 115.4 | 118.5 | 143.0 | 153.2 |
| England | 100.0 | 114.3 | 120.7 | 132.9 | 159.0 | 163.5 |
The North increased in proportion to the other regions in this period; this effect is even stronger when we take into account that the people there ate oats, which were much cheaper than wheat, and thus a smaller proportion of the total income.
There was a small increase from 1794 to 1795, which was absolutely not enough to compensate for the extremely high prices of wheat and other foodstuffs in 1795 and 1796.
The counties with the lowest weekly wages during the period were: Bedford, Cambridge, Dorset, Gloucester, Monmouth, Oxford, and Wiltshire. The highest weekly wages were in: Kent, Lancaster, Middlesex, Nottingham, and Sussex.
To check the yearly movements in the periods of high wheat prices, we also have some continuous series for individual counties, in the period from 1788 to 1825:
1790-1815, Essex: G. E. Mingay, Land, Labour and Agriculture, 1700-1920, Appendix 4.1, p. 90, Indices of Agricultural Labourers’ Wages, the Cost of Living and Real Wages, in Essex, 1790-1840.
1814-1815, Huntingdon, Report of the Select Committee on Labourers Wages, 1824, Minutes of Evidence, pp. 21-22.
1790-1815, Lincolnshire, Richardson, T. L., The Agricultural Labourers’ Standard of Living in Lincolnshire, 1790-1840: Social Protest and Public Order, Fig. 1, p. 4, Agricultural Labourers’ Wages at Stamford and the Cost of Living, 1790-1840.
1804-1815, Norfolk, Richard Noverre Bacon, The Report on the Agriculture of Norfolk for which the Prize was awarded by the Royal Agricultural Society of England, 1844, p. 144; The Average Price of Wheat per Coomb received, and Labourers’ Weekly Wages, paid from 1804 to 1844, on a Light-land Farm.
1790-1815, Northampton, Viscount Milton, Address to the Landowners of England on the Corn Laws, James Ridgway, London, 1832, https://catalog.hathitrust.org/Record/001737305, Table A, pp. 44-45.
1788-1815, Sussex, House of Commons, Report from the Select Committee to whom the several Petitions complaining of the Distressed State of the Agriculture of the United Kingdom were referred, 1821, p. 53
1788-1815, Somerset, Committees of the House of Lords appointed to enquire into the State of the Growth, Commerce and Consumption of Grain, and all Laws relating thereto, First and Second Reports, James Ridgway. London, 1814 https://archive.org/stream/firstsecondrepo00grea#page/n33/mode/2up, pp. 24 and 262-271.
1790-1815, Kent, H. G. Hunt, Agricultural Rent in South-East England, 1788-1825, British Agricultural History Society, Vol. 7.2., 1959, http://www.bahs.org.uk/AGHR/ARTICLES/07n2a4.pdf
1802-1815, Norfolk (Great Massingham), Brereton, Rev. C. D. (Rector of Little Massingham, Norfolk), Observations on the Administration of the Poor Laws in Agricultural Districts, J. Hatchard and Son, Norwich, 1824, p. 101.
1811-1815, Middlesex (Houndslow), Select Committee of the House of Lords, appointed to consider of the Poor Laws, 1830-1, Minutes of Evidence, Ordered to be Printed, 7th December 1830, p. 109
1788-1815, Cumberland, John Rooke, An Inquiry into the Principles of National Wealth, A. Balfour and Company, London, 1842, Table I, Part II, p. 432.
These give us the following comparison of the movements:
| 1788 | 1789 | 1790 | 1791 | 1792 | 1793 | 1794 | 1795 | 1796 | 1797 | |
| Essex | 7.5 | 7.5 | 7.5 | 7.5 | 7.5 | 8.3 | 8.3 | 8.3 | ||
| Huntingdon | ||||||||||
| Lincoln | 9.1 | 9.1 | 9.1 | 9.1 | 9.8 | 10.1 | 10.5 | 10.5 | ||
| Norfolk | ||||||||||
| Northampton | 7.0 | |||||||||
| Sussex | 9.0 | 9.0 | 9.0 | 9.0 | 9.0 | 9.0 | 9.0 | 10.0 | 12.0 | 12.0 |
| Somerset | 7.5 | 7.5 | 7.5 | 7.5 | 7.5 | 12.0 | 12.0 | 12.0 | 12.0 | 12.0 |
| Kent | 9.0 | 9.0 | 9.0 | 9.0 | 9.0 | 9.0 | 9.0 | 12.0 | ||
| Norfolk | ||||||||||
| Middlesex | ||||||||||
| Cumberland | 7.0 | 7.0 | 7.0 | 7.5 | 7.5 | 7.0 | 8.0 | 8.0 | 8.0 | 9.0 |
| Average | 8.2 | 8.3 | 8.3 | 8.9 | 9.2 | 9.6 | 10.0 | 10.1 | ||
| Adjusted x0.9 | 7.4 | 7.4 | 7.4 | 8.0 | 8.3 | 8.6 | 9.0 | 9.1 |
| 1798 | 1799 | 1800 | 1801 | 1802 | 1803 | 1804 | 1805 | 1806 | 1807 | |
| Essex | 8.3 | 8.3 | 8.3 | 8.7 | 8.7 | 8.7 | 9.0 | 9.0 | 9.0 | 9.4 |
| Huntingdon | ||||||||||
| Lincoln | 10.5 | 10.0 | 11.0 | 11.0 | 11.0 | 11.0 | 11.0 | 11.0 | 11.0 | 11.0 |
| Norfolk | 8.0 | 10.0 | 9.0 | 9.0 | ||||||
| Northampton | 7.0 | 7.0 | 7.0 | 9.0 | 9.0 | 10.0 | 10.0 | 10.0 | 10.0 | 10.0 |
| Sussex | 12.0 | 12.0 | 12.0 | 15.0 | 15.0 | 15.0 | 12.0 | 13.0 | 13.0 | 13.0 |
| Somerset | 12.0 | 12.0 | 12.0 | 12.0 | 12.0 | 14.0 | 14.0 | 14.0 | 14.0 | 14.0 |
| Kent | 12.0 | 12.0 | 12.0 | 12.0 | 12.0 | 12.0 | 12.0 | 12.0 | 15.0 | 15.0 |
| Norfolk | 12.0 | 11.0 | 12.0 | 12.0 | 12.0 | 12.0 | ||||
| Middlesex | ||||||||||
| Cumberland | 9.0 | 10.5 | 11.5 | 11.5 | 11.5 | 12.0 | 13.5 | 14.5 | 15.0 | 15.5 |
| Average | 10.1 | 10.3 | 11.5 | 11.5 | 11.4 | 11.7 | 11.3 | 11.7 | 12.0 | 12.1 |
| Adjusted x0.9 | 9.1 | 9.2 | 10.3 | 10.3 | 10.3 | 10.5 | 10.2 | 10.6 | 10.8 | 10.9 |
| 1808 | 1809 | 1810 | 1811 | 1812 | 1813 | 1814 | 1815 | |
| Essex | 9.4 | 9.4 | 9.4 | 9.5 | 10.2 | 10.4 | 10.4 | 10.4 |
| Huntingdon | 14.0 | 11.5 | ||||||
| Lincoln | 11.0 | 11.0 | 12.0 | 12.0 | 12.0 | 12.0 | 12.0 | 12.0 |
| Norfolk | 9.0 | 10.5 | 12.0 | 10.0 | 15.0 | 13.5 | 10.0 | 10.0 |
| Northampton | 10.0 | 10.0 | 10.0 | 12.0 | 14.0 | 14.0 | 14.0 | 12.0 |
| Sussex | 13.0 | 13.0 | 13.0 | 13.0 | 13.0 | 13.0 | 13.0 | 13.0 |
| Somerset | 14.0 | 14.0 | 14.0 | 14.0 | 14.0 | |||
| Kent | 15.0 | 15.0 | 15.0 | 15.0 | 18.0 | 18.0 | 15.0 | 13.5 |
| Norfolk | 12.0 | 12.0 | 12.0 | 15.0 | 15.0 | 15.0 | 12.0 | 10.0 |
| Middlesex | 18.0 | 18.0 | 18.0 | 15.0 | 15.0 | |||
| Cumberland | 15.5 | 15.5 | 15.5 | 15.0 | 15.0 | 14.4 | 14.0 | 13.5 |
| Average | 12.1 | 12.3 | 12.5 | 13.4 | 14.4 | 14.3 | 12.9 | 12.1 |
| Adjusted x0.9 | 10.9 | 11.0 | 11.3 | 12.0 | 13.0 | 12.8 |
As we have consistent figures from twelve different sources, we may assume that wages of this magnitude were given in all of England.
We see that the wages in these counties moved gradually up to about 12 shillings in 1810, and remained there until 1820. From the beginning of the French Wars in 1792, to the maximum price of wheat in 1812, the increase was from 7.5 shillings to 12 shillings, that is, 60 %.
From the above data, we can construct a table of winter weekly wages from 1770 to 1825, with considerable certainty:
| 1770 | 6.5 | 1790 | 7.4 | 1810 | 11.3 | ||
| 1771 | 6.6 | 1791 | 7.5 | 1811 | 12.0 | ||
| 1772 | 6.6 | 1792 | 7.5 | 1812 | 13.0 | ||
| 1773 | 6.6 | 1793 | 7.5 | 1813 | 12.8 | ||
| 1774 | 6.6 | 1794 | 7.7 | 1814 | 12.9 | ||
| 1775 | 6.6 | 1795 | 8.9 | 1815 | 12.1 | ||
| 1776 | 6.6 | 1796 | 9.3 | ||||
| 1777 | 6.6 | 1797 | 9.3 | ||||
| 1778 | 7.0 | 1798 | 9.2 | ||||
| 1779 | 7.0 | 1799 | 9.2 | ||||
| 1780 | 7.0 | 1800 | 9.3 | ||||
| 1781 | 7.0 | 1801 | 10.3 | ||||
| 1782 | 7.0 | 1802 | 10.2 | ||||
| 1783 | 7.0 | 1803 | 10.3 | ||||
| 1784 | 7.0 | 1804 | 10.5 | ||||
| 1785 | 7.0 | 1805 | 10.6 | ||||
| 1786 | 7.0 | 1806 | 10.8 | ||||
| 1787 | 7.1 | 1807 | 10.9 | ||||
| 1788 | 7.2 | 1808 | 10.9 | ||||
| 1789 | 7.3 | 1809 | 11.0 |
We can compare these data with the weekly wages from another study:
Gregory Clark, Farm Wages and Living Standards in the Industrial Revolution: England, 1670-1850, 2001.
His document is based on a collection and analysis of a large number of real individual wage payments, as found in farmers’ and estate administrators’ books.

The two series are extremely close, which gives us security that they are reporting the real facts “on the ground”. There is small difference for the period 1795-1796. We have information from Arthur Young, that as a measure against the increase in wheat prices and the scarcity in 1795, the weekly wages were in many places increased by 1 shilling. Clark does not show this. This may be because a) Clark could not collect his data with a detail of individual years, or b) the increase was not actually given in a majority of counties, and thus Clark is nearer to the reality.
The above movements in weekly wages are in general confirmed by the chronological reports of Mr. Thomas Tooke, in his book on “A History of Prices and of theState of the Circulation from 1793 to 1837”, written in 1838.
