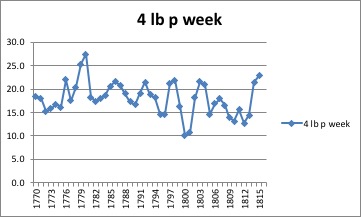
We now show the comparison between the wages and the price of the 4 lbs. of wheat, that is, how many 4 lb. units of wheat could be bought with one week’s wages.
| A. Young 1770 | Enq Board Agric | General View 1st Serie | F. Ede | Enq Board Agric | General View 2nd Series | ||
| 1793 | 1794 | 1795 | 1803 | ||||
| Bedford | 9.6 | 8.1 | 20.4 | 1808 | |||
| Berkshire | 19.5 | 19.5 | 10.9 | 25.7 | 1808 | ||
| Buckinghamshire | 16.3 | 12.5 | 19.3 | 1808 | |||
| Cambridge | 10.7 | 22.5 | 1807 | ||||
| Cheshire | 33.5 | 14.2 | 19.3 | 1806 | |||
| Cornwall | 22.5 | 1808 | |||||
| Cumberland | 33.5 | 27.0 | 15.0 | ||||
| Derby | 24.4 | 22.5 | 17.8 | 1816 | |||
| Devon | 21.0 | 11.7 | 15.0 | 1808 | |||
| Dorset | 15.0 | 18.0 | 20.0 | 1811 | |||
| Durham | 20.3 | 25.0 | 12.8 | 24.4 | 1810 | ||
| Essex | 15.0 | 30.0 | 16.9 | 30.0 | 1807 | ||
| Gloucester | 15.8 | 19.5 | 14.2 | 15.0 | 1805 | ||
| Hampshire | 19.8 | 25.0 | 12.3 | 22.5 | 1808 | ||
| Hereford | 18.0 | 15.0 | 15.0 | 1804 | |||
| Hertford | 16.8 | 18.0 | 8.8 | 1804 | |||
| Huntingdon | 13.9 | 1811 | |||||
| Kent | 18.8 | 26.3 | 10.7 | 33.8 | 1803 | ||
| Lancaster | 28.5 | 30.0 | 15.0 | 21.0 | 1809 | ||
| Leicester | 22.5 | 20.5 | 11.3 | 22.5 | 1807 | ||
| Lincoln | 15.0 | 22.8 | 15.9 | 1799 | |||
| Middlesex | 18.8 | 27.0 | 15.0 | 18.8 | 1805 | ||
| Monmouth | 18.0 | 27.0 | 19.3 | 16.4 | 1810 | ||
| Norfolk | 16.3 | 23.3 | 14.1 | 1803 | |||
| Northampton | 25.5 | 18.0 | 14.1 | 17.1 | 1809 | ||
| Northumberland | 29.0 | 24.4 | 24.0 | 1805 | |||
| Nottingham | 22.5 | 23.2 | 12.0 | ||||
| Oxford | 13.8 | 12.0 | 15.8 | 1807 | |||
| Rutland | 10.3 | 19.5 | 12.5 | 22.5 | 1808 | ||
| Shropshire | 19.1 | 12.5 | 1801 | ||||
| Somerset | 18.0 | 10.0 | |||||
| Stafford | 25.1 | 17.3 | 11.3 | ||||
| Suffolk | 16.8 | 20.0 | 15.0 | ||||
| Surrey | 27.0 | 13.0 | 1809 | ||||
| Sussex | 22.5 | 21.3 | 12.3 | ||||
| Warwick | 19.1 | 10.0 | 1812 | ||||
| Westmoreland | 45.0 | 23.8 | |||||
| Wiltshire | 28.1 | 10.6 | 1813 | ||||
| Worcester | 15.5 | 16.2 | 12.8 | 11.3 | 1805 | ||
| York E Riding | 27.4 | 28.5 | 20.6 | 28.1 | 1811 | ||
| York N Riding | 21.3 | 21.0 | 15.0 | ||||
| York W Riding | 19.5 | 24.0 | 18.8 | ||||
| Average | 18.4 | 22.7 | 13.5 | 21.0 |
In the terms of this table, the “sufficiency point”, would be about 15 units of 4 lbs. a week; that is, 60 lbs (one bushel per week), which was general held to be the food requirement for a family. At a level of 15, the basic weekly wage of the father would be enough for food; the sum of piece-work, the differences for hay season and harvest season, and the incomes for the wife and from children might just cover rent, fuel and clothing.
We see that the amount for 1795 (high prices due to the insufficient harvest, and the extreme cold at the beginning of the year), absolutely did not reach this level.
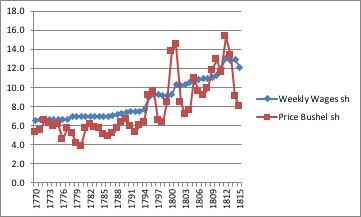
Below we have a first approximation to a comparison of the earnings of the Middle Case family (see below, Absolute Figures as to the Standard of Living), and their cost of living, in terms of the inflation in wheat prices, for the years 1760 to 1825. The earnings include the hay and harvest wages, task-work income, and the earnings of the wife and children, and are taken to be 2.2 times the basic weekly winter wage, averaged over the counties of England. The living costs are equivalent to the price of 2.2 bushels of wheat, including an additional 30 %, which is the difference between the market price for wheat, and the price of the middleman to the labourers. (see Davies, 1795, pp. 33-34).

According to these results, the average earnings kept up with the net movements in the wheat price during the years 1760 to 1794 (except 1766-1767), and also in the the years 1819 to 1825. In the years of scarcity and thus high prices (1795-1796, 1800-1801, 1808, 1810-1813), the weekly wage could not pay these prices.
