Woollen (or cloth) was manufactured from the short curly hair of the upland sheep, and worsted from the longer hair of lowland sheep. The long hair of woollen had to be carded before spinning to bring all the hairs into line, which was a long process; after weaving, as it was not strong, it had to be fulled (soaked in water, and then pressed on, to make a matted cloth), and this required finishing, that is, raising a nap, and then cutting it off at a level of the cloth, to make it smooth.
Worsted wool had to be only combed through, as it was already nearly parallel; it was also easier to work in spinning and weaving, as it was stronger. In both cases, the wool was less strong and more breakable than cotton. Due to these differences, the use of machinery for spinning and weaving came earlier for worsted than for woollen. The worsted cloth was used for clothing for persons (hard-wearing fabrics), and the woollen for blankets and knitwear, (soft and warm fabrics). Woollen items were made in the region around Leeds, Wakefield, and Huddersfield (“fancy goods”), and worsted in the region around Bradford; Halifax had worsted, woollen and cotton production.
For our investigation it is important to distinguish between worsted and woollen, because the changes in processes came about 20 years later in the woollen manufacture, and in the woollen industry the hand-loom weavers did not suffer extreme poverty or hunger.
The wool industry in the West Riding of Yorkshire was only partially similar to the cotton industry. The history of this industry goes back to the Middle Ages, as there had always been a great number of sheep in the county. In the Eighteenth Century it was the main commercial basis for the population, and the county was rich.
The yearly volumes of wool, from domestic sources plus import, were:
| Year | Domestic production (lbs.) | Foreign wool imported (lbs.) | Colonial wool imported (lbs.) | Of which Australia | Total imported (lbs.) | |
| 1800 | 94,000,000 | 8,609,000 | 0 | 0 | 8,609,000 | |
| 1810 | 10,879,000 | 34,000 | 200 | 10,914,000 | ||
| 1820 | 9,653,000 | 122,000 | 99,000 | 9,775,000 | ||
| 1830 | 111,000,000 | 30,303,000 | 2,002,000 | 1,967,000 | 32,305,000 | |
| 1840 | 157,000,000 | 36,585,000 | 12,850,000 | 3,558,000 | 49,436,000 | |
| 1850 | 228,000,000 | 26,102,000 | 48,224,000 | 9,721,000 | 74,326,000 | |
| 1855 | 24,681,000 | 74,619,000 | 39,018,000 | 99,300,000 | ||
| 1857 | 44,522,000 | 82,868,000 | 49,209,000 | 127,390,000 |
(We do not have a division between worsted and woollens, as the British Government did not collect the figures with this differentiation)
(Baines, 1859, Tables (B) and (C), p. 10; domestic production figures very approx.)
The phases in the production of worsted cloth, before industrialization, were:
a) sorting;
b) washing and combing;
c) carding;
d) drawing;
e) slubbing or roving (pulling out the wool, and winding it on bobbins);
f) spinning;
g) weaving;
h) dyeing.
The major changes by inventions and in the chain of production were:
1790’s Fly-Shuttle
1810 Manual spinning replaced by machines
(saved 95 % of cost of labour)
1810-1825 Combing machine (William Cartwright), for preparing the wool in parallel threads.
This reduced the number of men required from 30, to 1 man with 5 children.
The cost of combing inferior wool was reduced from 2 ½ d. to 1 d. per pound, and of finer wool from 6d. to 1 ½ or 1d.
1820’s Steam-powered mills
1820’s Introduction of power-loom in factories, in small quantities
1840 Worsted spinning by throstle, replacing the jenny
As there were not many inventions to increase the speed of the spinning operations, the price of worsted yarn did not decrease after 1825. The price of one pound of yarn was 2s. 4d. in 1822 and 2s. 4d. in 1853, with levels in intermediate years from 3s. 0d. to 1s. 8d. The change in the structure of the spinning activities was only in the increase in volume produced and sold. The price of finished woven articles was reduced in the long term, due to the suppression of a number of stages in the process of weaving.
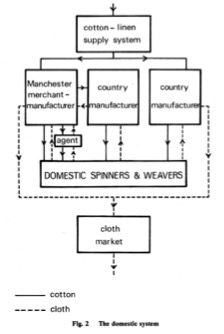
In the eighteenth century, the commercial process for producing worsted was as follows. The weaver or “manufacturer” bought the wool from the farmer, took it to the spinners, received the yarn from the spinners, wove it in his own cottage, and then took it to the town, to be sold to the merchant in the Piece Hall.
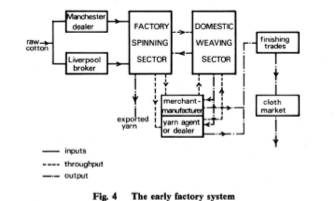
In the 1790’s the first factory buildings were constructed, rather small, with mules and frames, but in the first years they produced low quality yarn. The spinning operators were girls and women, as not much physical strength was required. Of the total of persons employed in the factories, about 12 % were from 9 to 13 years old, and 50 % from 13 to 18 years old. From 1800 to 1814, 7 factories were built in Bradford Borough, from 1815 to 1829, 24 factories, and from 1830 to 1841, 37 factories (Koditschek, 1990, Table 3-1, p. 84)
In the 1820’s power looms for weaving were introduced in the mills, but the volume really picked up from 1840 (2,800) to 1850 (29,500). In this period, the number of worsted hand-loom weavers in the county decreased considerably, and in 1850 there were only about 10,000, in very bad conditions.
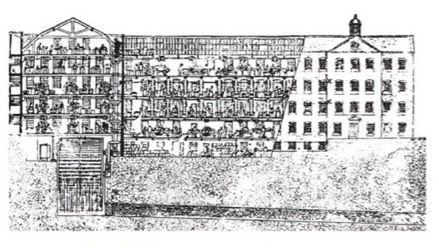
The mills started with only the preparation and finishing processes, then added spinning machines, and later the power looms for weaving; in 1850 there were 163 factories of spinning only, 90 of weaving only, and 149 with spinning and weaving. With the increase in production volume, the mills became larger, and some had very good installations for the workers (Saltaire). The number of persons employed in worsted factories in the West Riding increased from 29,000 in 1838 to 75,000 in 1850.
The distribution of the processes changed through time as follows:
Before 1800
Cottage
Spinning: Spinning wheel, Women
Weaving: Hand-loom, Men
1810-1830
Factories for Spinning, Cottage for Weaving
Spinning: Mules and throstles, Women
Help spinning: Small children
Weaving: Hand-loom with Fly-shuttle, Men
1820-1850
Factory in town, with steam power
Spinning: Mules with steam power, Women and children
Help spinning: Children
Weaving: Hand-loom (in own cottage), Men
OR Power-loom in factory, Young women
(change from hand-loom in cottage to power-loom in factory, gradually during this period)
After 1840
Factory in town, with steam power
Spinning: Mules with steam power, Women and children
Weaving: Power-loom in factory, Young women
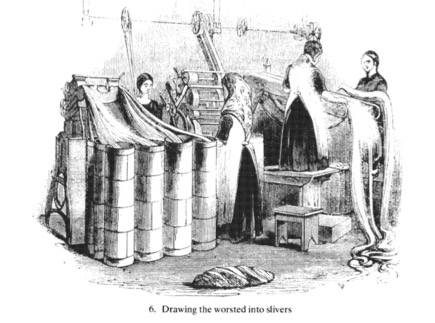
(Labour and the Poor in England and Wales, 1849-1851, Letters to the Morning Chronicle, plate after p. 42)
Monetary income levels
Arthur Young reported on the wages of worsted workersin Leeds in 1769. Male weavers 5 to 12 shillings the week, average 7s.; boys 13-14 5s.; women weavers 3s. 6d. to 4s.; wool combers 6 to 12 shillings; women spinners 2s. 6d. to 3s. the week; girls 13-14 1s. 8d. the week. The price of oats was 10 ounces for one penny, and beef 4 pence the pound, so that the average income for a man weaver could buy 50 pounds of oatcakes or20 pounds of beef (we can add the fact that all the family members worked). (Young, 1771, Vol. I, p. 137-139). There was always enough work.
In 1797, weavers earned 8 to 9 shillings the week, wool sorters and combers 12 shillings, hand spinners 4 shillings. Since oats were at 2s. 8d. for 16 lb. and beef was 6p. the lb., the weavers could buy 48 lb. oatmeal or16 lb. meat each week. (James, 1857, p. 547)
The incomes for the domestic hand-loom weavers were low from 1800 to 1803, then increased considerably to 1815, and then showed a slow but continuous decline. In 1815 it was possible to earn 30 shillings in some weeks, and in 1831, 18 shillings. On the other hand, bread, meat and other expenses were much cheaper in the 1830’s than in the 1800’s. In 1800 a week’s wages would buy 0.7 bushels [40 pounds] of wheat or17 ½ pounds of meat; in 1837 a week’s wages would buy 1.6 bushels [100 pounds] of wheat or 34 pounds of meat. (House of Lords, Handloom weavers, pp. 573-575)
When the wool combers went on strike in 1825, they were earning 23 shillings a week, and wanted an increase. The strike failed. The masters started introducing combing machines, in order to be less exposed if there was another strike (James, 1857, pp. 400-407).
The incomes of the workers in the mills were sufficient (taking into account that generally a family would have at least two members employed), although they could be reduced in times of depression:
| 1823 | 1824 | 1825 | 1826 | 1827 | 1828 | 1829 | 1830 | |
| s. d. | s. d. | s. d. | s. d. | s. d. | s. d. | s. d. | s. d. | |
| Weavers from 12 to 16 years old | 12 1 | 9 10 | 7 6 | 8 1 | 7 11 | 7 11 | 7 6 | |
| Weavers from 16 and upwards | 13 8 | 13 2 | 10 3 | 11 1 | 10 6 | 10 2 | 10 3 | |
| Reelers of worsted yarn, women | 10 0 | 12 11 | 9 4 | 9 4 | 9 8 | 8 7 | 9 4 | |
| Warpers of worsted yarn, women | 12 0 | 12 0 | 12 0 | 12 0 | 12 0 | 12 0 | 12 0 | |
| Hands working by the day in factories from 9 to 11 years, chiefly Girls | 2 3 to 3 9 | 2 3 to 3 9 | 2 0 to 3 6 | 2 0 to 3 6 | 2 0 to 3 6 | 2 0 to 3 6 | 2 0 to 3 6 | |
| Hands from 11 to 14, chiefly girls | 3 9 to 6 0 | 3 9 to 6 0 | 3 6 to 5 9 | 3 6 to 5 9 | 3 6 to 5 9 | 3 6 to 5 9 | 3 6 to 5 9 | |
| Hands from 14 and upwards, women | 8 0 to 8 6 | 8 0 to 8 6 | 7 6 to 7 0 | 8 0 to 7 0 | 8 0 to 7 0 | 8 0 to 7 0 | 7 6 to 7 0 | |
| Overlookers | 18 0 to 26 0 | 18 0 to 26 0 | 18 0 to 26 0 | 18 0 to 26 0 | 18 0 to 26 0 | 18 0 to 26 0 | 18 0 to 26 0 | |
| Woolcombers | 18 0 to 24 0 | 18 0 to 24 0 | 18 0 to 24 0 | 18 0 to 24 0 | 18 0 to 24 0 | 18 0 to 24 0 | 18 0 to 24 0 |
1825 = “Lock-out”, Strike
(Adapted from James, 1857, p. 413 and p. 432)
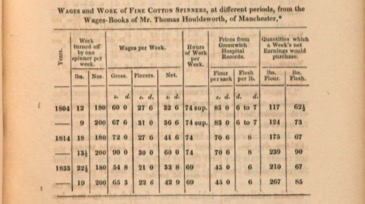
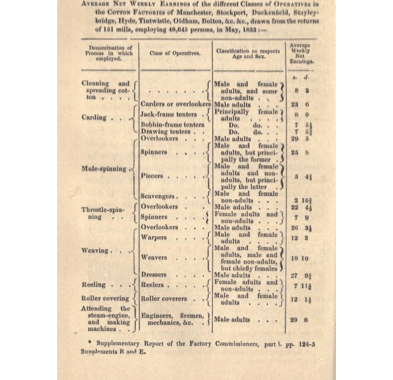
Following, we have a list of wages in a worsted mill (without the weaving function) in 1833:

(James, 1857, p. 443)
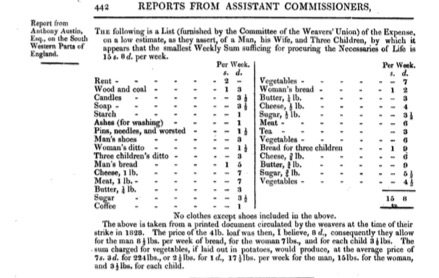
We can compare the data of 1833 and of 1840 with a general list of wages in the Bradford area in 1860, which shows a number of new work functions:
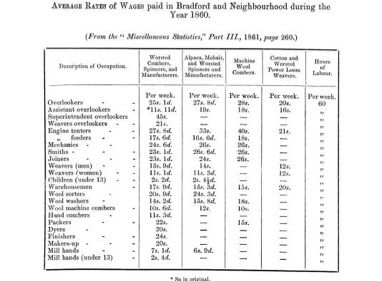
(Secretary of Board of Trade, Returns of Wages, 1887, p. 116)
We see that there are not many jobs in direct contact with the wool. The spinning is done by children under 13 who earn less than 3 shillings, as the machines (throstles) are easy to use and watch over. The weaving (all in-house) costs about 12 shillings. There are some manual wool sorters and combers. The other positions are technological, administrative, and engineering, and they are all well-paid, that is, from 20 to 30 shillings.
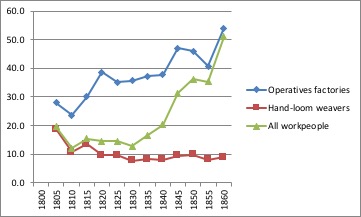
What has happened is that the worsted wool industry has been fully mechanized (see the table below). The important work is not done “on the production line”. This complicates our analysis of the movements of wages. It is true that the wages for spinning and weaving have gone down considerably. But new jobs have appeared, that did not exist before 1833. We cannot show these on the graphs, because we do not have comparable “starting figures” for them. The graphs show a general decrease from 1830. But it is very probable that the average income for workers in the worsted mills increased. Also there were new companies in Bradford, which produced textile machinery, and employed engineers and mechanics at good wages.
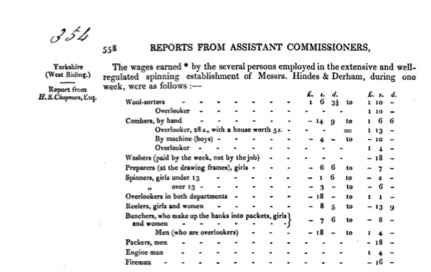
(Report on the Condition of the Hand-Loom Weavers, p. 558, Worsted spinning mill at Bradford)
We see that the number of persons employed, and of power looms, increased particularly in the worsted business from 1838 to 1856:
FACTORIES OF THE UNITED KINGDOM IN 1838 AND 1856
Persons employed Horse Power Power Looms
(only those in factories)
| Factories | 1838 | 1856 | Incr. | 1838 | 1856 | Incr. | 1838 | 1856 | Incr. |
| Cotton | 259,104 | 379,213 | 46 % | 59,803 | 97,132 | 62 % | 108,751 | 298,847 | 175 % |
| Woollen | 54,808 | 79,901 | 44 % | 20,617 | 25,901 | 25 % | 2,150 | 14,453 | 572 % |
| Worsted | 31,628 | 87,794 | 177 % | 7,176 | 14,904 | 108 % | 2,969 | 38,956 | 1,212 % |
| Flax | 43,557 | 80,262 | 84 % | 11,089 | 18,322 | 65 % | 1,714 | 9,260 | 440 % |
| Silk | 34,303 | 56,137 | 64 % | 3,384 | 5,176 | 51 % | 209 | 7,689 | 3,579 % |
| TOTALS | 423,400 | 682,497 | 61 % | 102,069 | 161,435 | 58 % | 115,793 | 369,205 | 219 % |
(Baines, 1859, Table (A), p. 8)
The problem was the income level (piece rates) of the hand-loom weavers. In a bad year like 1838, there were 13,800 in the Bradford district (James, 1857, p. 482), who only earned 6 or 7 shillings, which was absolutely not enough for the food of a family. Also, if the children went to work in the mills, they could earn more than the father.

(House of Lords, Sessional Papers, 1840, Hand-Loom Weavers, p. 575)
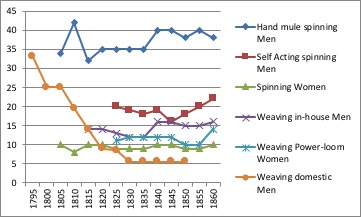
Worsted workers (shillings per week)
| Wool Sorters | Wool Combers | Spinners | Weavers In-house | Weavers | Weaver Domestic | |
| Men | Men | 10 yrs | Men | Women | Men | |
| 1800 | 10 | |||||
| 1805 | 17 | |||||
| 1810 | 17 | |||||
| 1815 | 31 | |||||
| 1820 | 21 | |||||
| 1825 | 12 | 17 | 3 | 11 | 5 | 21 |
| 1830 | 12 | 12 | 3 | 10 | 3 | 18 |
| 1835 | 27 | 16 | 4 | 15 | ||
| 1840 | 12 | |||||
| 1845 | ||||||
| 1850 | ||||||
| 1855 | 21 | 3 | 10 | 10 | ||
| 1860 | 21 | 3 | 14 | 11 |
Mill workers: James, 1857, pp. 412, 432; Weaver domestic: Hand-loom weavers p 57.
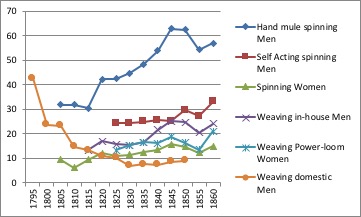
Worsted workers (loaves per week)
| Wool Sorters | Wool Combers | Spinners | Weavers | Weavers | Weaver Domestic | |
| Men | Men | 10 yrs | Men | Women | ||
| 1800 | 9 | |||||
| 1805 | 16 | |||||
| 1810 | ||||||
| 1815 | 30 | |||||
| 1820 | 25 | |||||
| 1825 | 15 | 21 | 4 | 13 | 6 | 25 |
| 1830 | 15 | 15 | 4 | 13 | 4 | 23 |
| 1835 | 37 | 22 | 6 | 21 | ||
| 1840 | 16 | |||||
| 1845 | ||||||
| 1850 | ||||||
| 1855 | 28 | 4 | 14 | 14 | ||
| 1860 | 32 | 5 | 21 | 17 |
Worsted workers (shillings per week)

Worsted workers (loaves per week)