We are conscious of the fact that, in the industrial towns of England in the first half of the Nineteenth Century, half of the babies died before their 60th month of life; further, that of the absolute number of deaths in a given year, and in a given town, 50 % were of children under the age of 5 years.
So that the other persons died at some age of above 5 years. The question is, what was their velocity of dying?
We have the answer below, for Manchester in the year 1841, combining the Age of the Living from the Census, with the Mortality data from the Annual Report of the Registrar-General, by age cohorts. 2.20
We see that for the persons of 5 to 44 years old in Manchester, the probability in 1841 of dying in the following 12 months was some figure between 0.5 % and 1.5 %.
This is not really a difficult health situation.
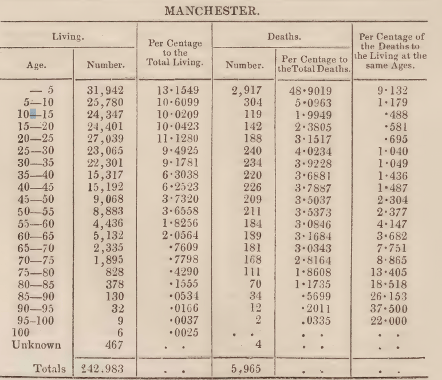
2.20 Neison, F. G. P.
On a Method recently proposed for conducting Inquiries into the Comparative Sanatory Condition of various Districts, with Illustrations, derived from numerous places in Great Britain at the period of the last Census.
Journal of the Statistical Society of London, Vol. VII, 1844, pp. 40-68 (here, p. 58)
[Data taken by Mr. Neison from the Census of 1841 and from the Annual Report of the Registrar-General for 1841]
Mortality in England by “cohorts” for the Year 1841.
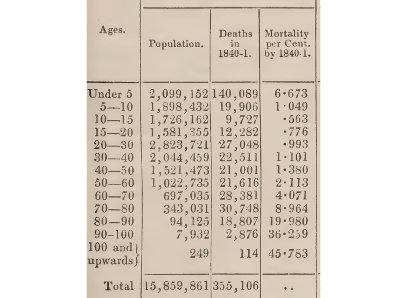
Result: for persons of from 5 to 50 years old in England in 1841, the probability of dying in the following 12 months is from 1.1 % to 1.4 %.
Neison, 1844, op. cit, p. 47
[Unfortunately, the figure for the Total of the Living, as shown, is not at all close to the population of the three Registration Districts of the conurbation of Manchester according to the Census of 1841. Very probably the calculation was made without including Salford. It is not possible to adjust the calculation to add Salford, because there are differences in the definitions of the regions. We therefore pass to a calculation for the total of Manchester conurbation in 1851]
Calculation for Manchester 1851, Both Sexes
| Age | Number Living | Percentage to Total Living | Deaths Number | Percentage to Total Deaths | Percentage Deaths To Living same Age |
| 0 – 4 | 51,736 | 12.89 % | 5,510 | 46.81 % | 10.65 % |
| 5 – 9 | 42,796 | 10.66 % | 522 | 4.43 % | 1.22 % |
| 10 – 14 | 41,093 | 10.24 % | 234 | 1.99 % | 0.57 % |
| 15 – 24 | 82,265 | 20.50 % | 777 | 6.60 % | 0.94 % |
| 25 – 34 | 71,286 | 17.76 % | 911 | 7.74 % | 1.28 % |
| 35 – 44 | 50,431 | 12.57 % | 892 | 7.58 % | 1.77 % |
| 45 – 54 | 33,033 | 8.22 % | 964 | 8.19 % | 2.92 % |
| 55 – 64 | 19,054 | 4.75 % | 806 | 6.85 % | 4.23 % |
| 65 – 74 | 7,340 | 1.83 % | 719 | 6.11 % | 9.80 % |
| 75 – 84 | 2,070 | 0.52 % | 374 | 3.18 % | 18.07 % |
| 85 – 100 | 247 | 0.06 % | 63 | 0.54 % | 25.51 % |
| All Ages | 401,231 | 11,772 | 2.93 % | ||
Calculation by this author
Sources:
“Number Living” from Census 1851
“Deaths Number” from Annual Report of Registrar-General 1851.
Result:
For persons of from 5 to 44 years old in Manchester in 1851, the probability of dying in the following 12 months is from 1.0 % to 1.8 %.
England 1851:
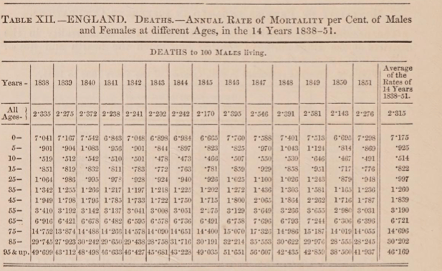
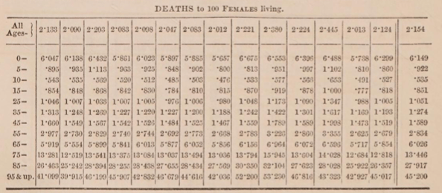
| Males 1851 | Females 1851 | Both Sexes 1851 | ||
| 0 – 4 | 7.298 | 6.299 | 6.799 | |
| 5 – 9 | 0.869 | 0.866 | 0.867 | |
| 10 – 14 | 0.491 | 0.527 | 0.509 | |
| 15 – 24 | 0.776 | 0.818 | 0.797 | |
| 25 – 34 | 0.988 | 1.005 | 0.996 | |
| 35 – 44 | 1.236 | 1.193 | 1.214 | |
| 45 – 54 | 1.787 | 1.519 | 1.653 | |
| 55 – 64 | 3.031 | 2.679 | 2.855 | |
| 65 – 74 | 6.296 | 5.854 | 6.075 | |
| 75 – 84 | 14.955 | 12.818 | 13.886 | |
| 85 – 94 | 28.245 | 26.337 | 27.291 | |
| 95 and up | 41.937 | 45.017 | 43.477 |
(see last right-hand column of the tables above)
For persons of from 5 to 44 years old in England in 1851, the probability of dying in the following 12 months is from 0.5 % to 1.2 %.
Dr. Farr gives us a graphical demonstration of the advance of the proportion of deaths in each of the cases. Note that the “gradient of deaths”, i.e. the increase of cumulative deaths for persons in each “cohort” above the age of 5, is very similar in the cases of: England, rural Surrey, Liverpool, and the Metropolis.
Fifth Annual Report of the Registrar-General, Report 1841, pp. 50-51.
PICTURE
PICTURE
SO THAT WE SEE THAT THE STRESS ON THE BODY OF THE ADULT PERSON, FROM LIVING IN MANCHESTER, IS ONLY SLIGHTLY MORE THAN IS THE CASE IN THE AVERAGE OF ENGLAND.

