Chapter 1: Contemporary Observations
- Comments from professional persons, farmers, and visitors are unanimous that there was a visible and continuous improvement in the incomes and living standards of the great majority of the population during this period.
- This improvement may well have been equivalent to an increase in the real wages of 5 per cent per decade.
Chapter 2: General Study
- The time frame for describing and evaluating the Industrial Revolution in England, should not be from 1770 to 1860; it should start from 1770 for the textile and metals industries, but from 1830 for the rest of the activities of the country. In 1851, only 20 % of the country by area had considerable (more than 40 %) employment in the secondary sector.
- The cotton industry in Lancashire was obviously the principal driver of the new economy from 1770 to 1830; but this does not mean that the cotton region was representative of the country in its economic structure or in its living conditions.
Chapter 3: The Growth of the Cotton, Worsted, Woollens, and Metals Industries
- The cotton industry became extremely efficent and cost-optimised, not only due to the mechanical improvements and the use of the steam engine, but also due to the invention of the cotton gin in the United States, the use of liquid lime chloride for bleaching, gas lighting in the factories in the early morning and the evening, and printing on the cloth from designs engraved on metal cylinders.
- From 1792 to 1832 the price of cotton yarn went down to 20 %, and from 1815 to 1833 the price of calico cloth went down to 30 %.
- The better level of cotton spinners earned 30 shillings a week, and the average class about 22 shillings. As usually three members of a family worked in a cotton mill, they could generally income from 30 to 40 shillings a week. These figures did not change much from 1815 to 1860. The cotton workers in general had a surplus of earnings against expenses.
- From about 1815 onwards, the cotton industry was characterised by low margins for the owners, and high volumes.
- In the worsted industry (long-hair wool, used for clothing for persons) in Yorkshire, the mechanization took place from 1810 to 1850, displacing a number of manual processes. The power loom started to be used around 1840.
- The wages levels for workers in the spinning and weaving processes went down, but a number of new types of jobs were introduced, with sufficient wages.
- In the woollen cloth industry (short-hair wool, used for blankets and knitwear), the mechanisation came about 20 years later than in worsted, due to the different characteristics of the fibre. In 1860, the weaving was still done generally by individual weavers in their cottages.
- The wages in the woollen cloth industry continued at a reasonable level during the whole period.
- The metal extraction, founding, and manufacturing industries in the West Midlands (particularly Birmingham and the later “Black Country”) increased their production volume impressively during the whole period 1770 to 1860. The region also produced pottery, carpets, watches, leather and saddles, and guns barrels.
- There were many technological improvements such as smelting iron with coke instead of charcoal, blast furnaces, high-precision boring of piston chambers, the Watt steam engine, the hydraulic press, railway tracks made from wrought iron (15 feet) instead of cast iron (3 feet).
- The production mode in Birmingham and the other towns for metal products,was not a number of serial processes which were made faster and more efficient, as in the textile industries. The work to be done – and the price – was agreed between the men and the masters, for each different article.
- As the products were always different, and often new, there were few standard prices per article, or standard wages per week. Thus it is – and was – impossible to calculate a series of wage levels through the years.
- The incomes for the workers in all the West Midlands activities were generally known to be very high, starting in the eighteenth century. Many earned more than 20 shillings a week.
- Life was more civilized in Birmingham than in Manchester. There was more civic spirit and more communication between men and business owners. The level of education was higher. There were better sanitary and housing conditions in Birmingham – absolutely no one lived in a cellar.
- A smaller metalworking region was that around Sheffield, where cutlery, workers’ knives, shears, and files were made. The men worked individually in their workshops. The wages were 25 to 60 shillings a week; on the other hand, the workers died young, many at 35 to 40 years old, due to the dangerous nature of the work. Sheffield was possibly the town with the richest workers in the world.
Chapter 4: How was Life for the People before the Industrial Revolution?
- The men who were the first workers in factories in Lancashire and Yorkshire did not come from poor agricultural regions, or from other counties. Those in the Manchester area had always worked there; those in the Pennine areas of Lancashire, moved downhill from farmsteads or villages to towns.
- The workers in Lancashire did not change to working in the mills because they were working in poor areas and were looking for reasonable incomes. They were spinners or artisans who had good incomes, and were attracted to work in the mills, because they were offered excellent incomes.
- The men, women and children in the countryside of Lancashire and the West Riding, had high living standards. The women and children in the farmsteads had good incomes from spinning wool or cotton, the men had weaving work 10 hours a day, and the families could work their plot of land to have enough cereal food.
- The quality and variety of food in the towns of Lancashire were excellent. A large proportion of the population ate white bread, and also meat on some days of the week.
- In the workhouses, the inmates had meat generally 3 times a week.
- The figures for child mortality in all England in the eighteenth century were very high – 170 / 1000 for infants (0 – 12 months) and 170 / 1000 for children (13 – 60 months).
- The incomes in the cotton business in Lancashire were about 9 shillings a week. In Manchester the women spinners earned about 2 to 5 shillings a week, and their husbands as weavers earned from 5 to 10 shillings.
Chapter 5: How was their New Life in the Factory?
- The hours of work in the mills up to about 1805 were 10 daily, and the children were fairly well treated; around 1812 they were increased to 12.
- At the time of the Select Committee hearings in 1818 and 1819, the hours were from 13 to 14 per day, and the children were beaten in the last hours of the day, because it was impossible for them to keep working; a number of children died from the extreme amount of work, and the men spinners either died before they were 40 years old, or were not able to do any physical work in other occupations.
- According to the reports collected for the Law of 1833, the hours were still long, but the work was easier.In 1843, the owners of the mills and other industrial companies decided without legal compulsion to make Saturday afternoon free of work.
- Less than 25 % of the workers in Manchester were employed in the cotton industry, and not all worked in continuous activities on the machines.
- The children who worked in the cotton mills (up to 1833) suffered from high temperature, noise and cotton flakes in the air, work without rest for 12 hours a day, bad treatment by the spinner, danger of accidents from the machinery, and deformities in the spine and legs.
- Life in the mills and company villages in the rural areas was much better than in the towns, as the owners had to offer good conditions. There were company shops, good clothing for the children, enough food, and well-constructed cottages nearby. But the owners insisted on 10 hours work a day for all the employed persons.
- The men, women and children in the cotton spinning had considerably higher wage levels than those of the generation before. The people in the worsted and woollens industries did not have a noticeable real increase.
Chapter 6: How was their new Life in the Town?
- The housing in Manchester was of a number of different levels of quality, and thus of rent. The larger part of the housing in the town was constructed by the better-paid workers and small shopkeepers, in “building clubs”. The men paid a monthly sum into a common bank account, and the construction costs were covered by a loan from the bank, guaranteed by the value of the building.
- The sanitation in the buildings and in the streets was very bad, but in not more than the half of the areas of Manchester Old Township (1832). The local better classes carried out a number of cleaning-up works, starting in 1830. They put into use the first street sweeping machine in the world in 1843.
- The extremely bad descriptions that we have of Manchester as to sanitation, housing, and living conditions of the workers, only refer to the Old Township (130,000 people, compared with 300,000 persons in the whole conurbation). The better paid workers lived in the suburbs. Even inside the area of the Old Township, there were gradations as to the bad conditions. Ancoats, Irish Town, Little Ireland, and Angel Meadow were the worst.
- The child mortality in the industrial cities was very high by our standards (200 per 1000 up to 12 months, and 200 per 1000 from 13 to 60 months). These figures were not excessively high against the data of the second half of the eighteenth century. They were certainly lower than the country averages in the 19th century of Germany, Austria, and Italy, which were predominately agricultural economies. The average for England and Wales was 150 / 1000 and 110 /1000.
- The high infant mortality in the industrial areas was not due to low sanitary levels. It was due to the impossibility of the mothers to look after their very young children, to give them breast milk, and to give them nutritious food. The women in general left their work – ten hours a day standing up – two weeks before birth of the child, and went back to work four weeks after the birth. The infant death rate went down during the Cotton Famine of 1861-1865, as the mothers had more time to devote to their children.
- The death rate averaged over the whole of England and Wales improved from 1780 to 1830, and then remained the same up to 1860. The death rate in the industrial towns remained about the same from 1800 to 1860 (subtracting the effects of epidemics in some years), that is, a negative effect from the worsening living conditions is not to be found.
- Life expectancy was clearly lower in the industrial towns than in the agricultural counties. But the figures have to be adjusted for the high death rate before 5 years, that is, the death rate for persons living after their fifth birthday was not so high. Also, the figures for adult death in the Lancashire towns, are too high, as they take as the divisor the number of persons living in i.e. 1841, which is low, because the number born in i.e. 1810, which is a function of the extreme growth rate of the population in each case.
- Added to the low expectation of life, a number of the workmen had work-related diseases or injuries, which took away their strength starting at 30 years old.
Chapter 7: The Poverty of the Domestic Hand-Loom Weavers
- The income of a male hand-loom weaver went down from 26 shillings in 1814 to 12 shillings in 1817 to 6 shillings in 1826. The weavers and their families had a very bad nutritional situation after 1826.
- The loss of income was not due to competition from the power-loom. The decreases in earnings took place in 1817 and in 1826; there were only 10,000 power-looms in 1820, and 50,000 in 1826.
- The reduction of income in 1817 was due to the export of “twist” (cotton yarn). There had been an export duty from 1810 which expired in 1817, and the export volume increased considerably with the ending of the French Wars. The export of twist meant that the cotton wholesaler on the Continent now had the yarn in his costs at a level of efficient English spinning machinery. Thus for the English wholesaler to compete, he had to bring down his costs of weaving to a level equal to those of the weaver on the Continent. This could only be done by reducing the piece prices paid to the English weaver. Unfortunately the English weaver had to buy his bread or oatmeal at English prices.
- The power-loom did not take away volume from the hand-loom. The power-loom could not produce the “fancy” cloths that the hand-loom made. The power-loom was used for large series of simpler fabrics.
- From 1820 to 1835, the hand-loom weavers were working flat out 12 hours a day and more to produce amount of cloth required by the market. The power-looms were adding to the total amount produced in the country, but the machine companies could not produce the looms quickly enough to cover the demand of cloth.
Chapter 8: Engels
- Although nearly all the data given by Friedrich Engels in “The Condition of the Working Classes in England in 1844” are individually true, Engels filtered his information to give a uniformly bad impression of the living standards of the people.
- In letters to Marx, Engels told him that the workers in continuous employment ate very well, that they had high incomes, that had “cultural Sundays” in the Manchester Hall of Science, and that they were well informed about political theory.
- Engels does not mention in his book the fact that in 1843 – while he was working in Manchester – the business owners decided without legal requirement, to give Saturday afternoons free from work, without affecting wages.
- The well-known “sob story”, apparently perfectly documented, about a man in St. Helens, who has to do the housework, while his wife works 12 hours in the cotton mill, cannot be true as presented. St. Helens did not have any cotton mills, but it did have coal mining, plate glass making, salt mining, copper smelting, chemicals, and brewing, so that the man could have found work.
- Engels’ intention, as he says to Marx, is to use all the information from England to attack the German industry owners and bourgeoisie. His tactic is called “Critique by street-fighting” (Marx’ terminology), and consists of not being a “nice guy”.
- Two German academics visited England at the same time as Engels, and their judgement on his book was that “he wrote down the bad characteristics as sharp and shrill as possible, the better characteristics as smudgy and distorted as possible.” “The individual data are true, the totality is false.”
Chapter 9: Non-Income Parameters
- The average consumption of bread in England during all this period was about two quartern loaves (9 lb. total) per adult per week, corresponding to one quarter (480 lb.) per year. This was generally taken to be a sufficient amount for daily activity.
- In 1834 and 1835, so much wheat was harvested that it exceeded the amount required for human consumption, and had to be given to horses and cattle.
- In England and Wales the percentage of cereal consumption which was wheat, increased from 66 % in 1800 to 88 % in 1850, with a corresponding reduction in barley, oats and rye. This shows that the population had better incomes and could spend more on white bread.
- We have an investigation of real consumption of meat in Liverpool, Manchester, Leeds and Sheffield, in 1815-1820, giving 95 lbs. per person per year (average of men, wives, children, babies, and indigents). Another report, from the Manchester Statistical Society in 1836 gives 100 lbs. per person per year (equivalent to 1.5 McDonald’s Quarter Pounders per person per day!).
- With respect to the short book by Dr. James Philip Kay, physician in Manchester in 1832, “The Moral and Physical Condition of the Working Classes employed in the Cotton Manufacture in Manchester” (1832), and which contains very negative descriptions of the living standards and habits of the workers, Dr. Kay informs us sotto voce in his preface, that it only refers to the poor workers in the Old Township.
- The consumption of food in London during the whole period was very high.
- The people in the six Northern counties had a food culture based on oats, which was more efficient in terms of weight of food per shilling. They were able to use it for a variety of foods.
- Average heights of the men increased by about 2 inches from 1760 to 1830 (birth years).
- From around 1834 something happened with the children, such that their average height when adult went down by 2 inches. Your author attributes this to the New Poor Law, and the prohibition of “outdoor relief”.
Chapter 10: Leisure Expenses, Savings and Education, Non-Financial Improvements
- A large proportion of the population had a surplus from their income, to pay for expenses other than food, clothing and rent. In 1851, 6,000,000 people (one third of the population of the country) visited the Great Exhibition; a large number came by train from all over England and Wales.
- The working classes made payments out of their wages for benefit societies, savings banks, and building societies.
- The better class of industrial workers made use of the Mechanics’ Institutes (from the 1820’s onwards), where they could take lessons or read books, in technical subjects, general culture, and French and German. There was a “Mechanic’s Magazine”, with advanced information about engineering and theoretical physics, with a circulation of 16,000.
- Of the male workers in factories in England in 1833, 86 % could read and 43 % could write.
- There was much drinking in the industrial worker class (including the women), which had its costs for the family budget. The Poor Law Commissioners, the factory owners, and the doctors, were convinced that a large part of the poverty which the working classes suffered, was due to the excess of drinking, and other wasteful expenses.
- The male industrial workers had the surplus time, energy, and money to visit prostitutes; the cost per adult male worker in the large cities was about 5 pounds per year.
- The working classes had a number of improvements in their lives, which were not paid out of their wages. These were street lighting by gas, subsidised third-class train transport, postage stamps, better fruit and vegetables due to railway transport, less physical effort in the textile factories, more mechanization in agriculture, less physical work in bringing the coal up from the mine face.
- Up to the 1830’s the workers in the villages, and in some metals industries had to pay high prices in the village shop, respectively in the “company shop”. This was made illegal in theory from 1831.
- The sale of food through the Co-Operative Societies made the prices lower for the workers.
- Many manufactured goods of general use became much cheaper, due to the introduction of machinery and increased efficiency of the processes.
Chapter 11: Wages and Living Conditions of Agricultural Labourers, 1770-1815
- The figure for wages usually quoted was of “weekly winter wages”. However, these were only “standard” values, and did not represent the whole income of the agricultural labourer and his family. The total came from: higher wages in the hay season, higher wages in the harvest month, task wages for special work (especially hand threshing) which were 150 – 180 % of the basic wage, work by the wife, work by the children. The whole income for a labourer with constant employment was generally about 2.2 times the standard wage. Thus a man with 8 shillings standard wage per week earned (averaged over the year) 17 shillings per week, or 44 pounds per year.
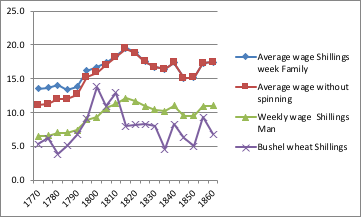
- The weekly winter wages, as an average over all England, were: 6.5 shillings in 1770, 8.9 shillings in 1795, increasing continuously to 13 shillings in 1812/1813.
- The cost of living index, starting from 100 in 1770, remained between 90 and 100 up to 1794, increased to maxima of 190 in 1801 and of 208 in 1812, but with lesser values in the intervening years of 1795-1815, and finished our period in 1815 at 150.
- The price of a bushel of wheat (a week’s consumption for a family), started at 5 shillings in 1770, remained between 4 shillings and 6 shillings up to 1794, increased to 14 shillings in 1800/1801 and to12-15 shillings in 1809-1813, but around 9 shillings in the other years, and finished at 8 shillings in 1815.
- The real wages, index 1770 = 100, remained between 90 and 110 during the whole period 1770-1815, with the exception of 80 in 1800/1801, and 120 in 1803 and in 1814/1815. The purchasing power of a weekly winter wage, in terms of bushels of wheat, was around 1.0 to 1.5 for the whole period 1795 to 1815, with the exception of 0.7 (insufficiency!) in 1800/1801 and 1812.
- From the beginning of the period of high prices for wheat (1794) to the highest point (1812/1813), the weekly wages increased from 7.7 shillings to 13 shillings (x 1.69), while the price of wheat increased from 6.4 shillings per bushel to 15.3 shillings per bushel (x 2.39). However this disequilibrium only took place in the years of great scarcity (1795/1796, 1800/1801, 1810/1813); in the other years in this period, the purchasing power of the agricultural wages was at a normal level.
- The grave insufficiency in earnings as to the requirement for food consumption in the years of the French Wars and the bad harvests was compensated by the following strategies: a) increase of wages to 12, 15, or 18 shillings; b) the farmers sold wheat to the labourers at low prices, generally 6 shillings the bushel; c) the labourers were given extra work on the farm, and the unemployed were given work improving roads, etc.; d) many families changed from eating wheat to eating barley, which cost about 40 % of the wheat; e) the very poor ate a large proportion of potatoes; f) the population in the North were not so much affected, as they normally ate oats, which cost much less; g) the parishes paid increased amounts in poor rates; h) there were many collections of money by the better classes to give the poor food, firewood, and coals, at very low prices.
- The financial situation of the labourers and their families was much influenced by the size of the families. Those families who had more than one small child, and had no child above 10 years old, were continually very close to the bread-line (literally!), and generally had to request money from the poor-rates several times in the year. This segment (30 % of the agricultural population) was not typical. Those families with no children, or on the other hand, with children of above 10 years, who could earn money as helpers in the fields or in domestic services, could eat enough and did not need help from the parish; but with the condition that the man was in continuous employment, and never ill. Young persons (male and female) of 16 to 25 years old, usually worked for their account as indoor farm-servants or as apprentices to artisans, where they paid nothing for their “bed and board”, and could save up to 30 pounds for when they married.
- The figures collected by David Davies in his “Case of the Labourers in Husbandry”, in order to show the pitiful conditions of the farm labourers, are not representative of the countryside nor of his parish. His parish was one of the smallest and poorest in England; there was no alternative in employment to field-work. The six families shown in his sample were not average; they all had a number of small children, and thus were the poorest in the village. He presented the data, obviously, with the best of intentions.
- The majority of agricultural families had enough income to eat sufficient bread or cereal, eat some meat (salted pork or bacon) and vegetables, clothe themselves, pay the rent for the cottage, and buy coal or firewood. The conditions of the cottages were in general not good. Those families who worked very hard, or who rented or owned a plot of land, could accumulate savings.
- The economic position of the labouring families was negatively affected in the period 1770 to 1815 by the advance of enclosures, which made it impossible for the families to pasture a cow or to collect firewood. Further, by the new processes in the woollens industry, which made it uneconomic for the wives to spin wool, and thus subtracted 3 to 4 shillings from the total income of the family. The threshing machines did not at this time cause unemployment, as there actually was a scarcity of workers (requisitioned for the armed forces), and actually improved the quality of life for the men.
- There was a considerable range of standard of living between the counties. Particularly the labourers in the North lived better, as they ate oats which cost the half of the wheat, and thus could eat other types of food. Other factors, additional to the amount of monetary earnings, were: having a plot of land for vegetables, cereals or a cow, fattening and eating a pig, level of cottage rents (or rents not charged), level of cost of fuel (coals or firewood), small manufacturing activities nearby, general productivity of the land in each county. The arable counties of South Central England (Buckingham, Bedford, Berkshire, Oxford, Wiltshire, Hampshire), were not typical of the country, but rather were poorer.
- The Northern counties increased their average agricultural income by much more than the other regions.
- Threshing machines were introduced from 1795, and saved labour, but only in Scotland and the North.
Chapter 12: Wages and Living Conditions of Agricultural Labourers, 1815-1860
- Weekly winter wages were about 12 shillings from 1815 to 1820, and then maintained in the range from 9 shillings to 11 shillings from 1821 to 1860.
- There were other elements of income, which could increase the real weekly figure (average over the whole year), by about 50 %: wife’s work, children’s work, task-work, hay months, harvest month. With these amounts, the family could pay rent, clothing, and fuel.
- Wheat prices were in the range of 5 to 8 shillings per bushel, so that – taking only the weekly wage of the man – the family could buy 20 to 25 quartern loaves (4.5 lbs.) per week, which was sufficient.
- The standard of living for the labourers was bad from 1815 to 1822, due to financial and natural problems, but was then sufficient for the years up to 1860.
- In the period from 1815 to 1830, in the majority of the villages there was a 2-tier structure of employment for the labourers. About 70 % had a continuous job with a farmer; he did not have work for more men. The other 30 % (difficult persons or bad workers) had to do informal work for the parish or were paid weekly out of parish funds; they had full-time work only in the harvest month.
- The report to the Poor Law Commissioners in 1834 (“Rural Queries”), showed that in the majority of counties in England, the families could eat well enough on 10 shillings a week, and a majority of families had enough money to buy meat.
- Up to 1834, the men in villages received moneys from the parish funds, to make up the difference between their weekly income (or zero income) and a basic food-line calculated from the price of a loaf (“Speenhamland System”). This gave rise to number of abuses – by the farmers and by the men – and removed the interest of the “supernumary” men in looking for work. The national Government brought in the New Poor Law, which prohibited the parishes from paying “outdoor relief”, that is payments to people living in their houses. The Government would only help families if they went into the Workhouses, which were designed to be bad experiences. This meant those men who wanted to continue to work “outside” had to accept lower wages from a farmer, and that their wives and children had to work more than before.
- The few family budgets that we have for this period, and the reports of Commissioners from 1843 and in 1846, show that the labourers and their families had in general enough to eat, but everyone had to work hard. In the South-West the incomes were low, and in the North they were high.
- The daily work of the farm labourers was made easier, by the use of new implements and simple machines made of metal, such as scythes, harrows, horse-drawn hay rakes and cheesepresses. From 1840 the steam engines were used to make a number of tasks more efficient, such as threshing cereals and elevators for hay; these made the work less physically demanding, but then the farmer would not pay “task-work” for easy activities.
- The index of family expenses for agricultural workers, went from 150 in 1815 to 140 in 1860 (1770 = 100).
- The real wages (weekly winter wages) went from 123 in 1815 to 121 in 1860 (1770 = 100), with bad years in 1816-1818 and 1842-1846.
- If we take into account the total income of the family (spinning, children’s work, task-work, harvest month), the nominal income was around 13 shillings in 1770-1790, 16 to 19 shillings in 1790-1840, 15 to 17 shillings in 1840-1860. The loss of wool spinning at the beginning of the period, and the lesser percentage of task-work at the end of the period, impacted negatively.
- The wages, expenses, and real wages for agricultural wages (only the man’s weekly wage; with task-work, etc.; adding spinning) changed as follows:
| COMPARISON 1770 TO 1860 AGRICULTURAL WORKERS WEEKLY WAGES 1770 = 100 WAGES 169 EXPENSES 139 REAL WAGE 121 |
| COMPARISON 1770 TO 1860 AGRICULTURAL WORKERS TOTAL FAMILY, WITHOUT SPINNING 1770 = 100 WAGES 158 EXPENSES 139 REAL WAGES 114 |
| COMPARISON 1770 TO 1860 AGRICULTURAL WORKERS TOTAL FAMILY, WITH SPINNING 1770 = 100 WAGES 130 EXPENSES 139 REAL WAGES 94 |
- According to Mr. Caird, an agricultural expert who visited the majority of the farming counties in 1850-51, the labourers’ wages had increased by 34 per cent against 1770, while bread was at the same level as 1770, meat had increased by 50 per cent, and cottage rent by 100 per cent.
- Mr. Denton, a land engineer who had worked in many counties in the preceding 17 years, reported that in 1868 the average basic wage for labourers was 12 shillings 6 pence. He pointed out that the the agricultural worker had advantages in comparison with the industrial worker, such as a much cheaper rent, cultivating potatoes and vegetables without cost, lower price of bread and meat, better quality of air, and savings from gleaning.
Chapter 13: Captain Swing
- The Swing Riots in 1830 were apparently caused by the agricultural labourers rebelling due to their poverty and hunger, which they thought were due to the threshing machines taking away their work in the winter months.
- But it was not true that the threshing machines reduced the demand for labour; the workers believed this against all observation; the better classes (even Cobbett!) could not understand why the workers had this belief.
- The Swing Riots did not take place in all of Southern England. Almost all the violent acts took place in Kent and East Sussex, and in a region formed by contiguous parts of Wiltshire, Hampshire, and Berkshire. In Kent and E. Sussex the disturbances took place during 4 months, in the western counties, only 15 days in total.
- The disturbances were not due to generalized hunger and poverty. Data collected by three Parliamentary Commissions show that the income levels and food levels were sufficient. Descriptions of the convicted men, by the judge presiding at Winchester and by the doctor who accompanied them in their transportation to Tasmania, show that they were strong and healthy.
- In Kent, in the first eight weeks of the disturbances, neither the men nor the authorities mention that the wages were insufficient and should be increased. In any case, Kent was the county in S. England with the highest standard of living.
- In Kent, 82 threshing machines were destroyed, but the half of these were by criminal gangs, and about 10 by the farmers themselves. In the Western Counties, they were: Berkshire 78, Dorset 10, Hampshire 52, Wiltshire 97; about the half were destroyed by the farmers, so as not to have trouble with the gangs.
- The labourers particularly in Wiltshire did not suffer much hunger, as Wiltshire was the county with proportionally most allotments in England. These made it possible for the agricultural families (with a lot of work) to eat considerable quantities of potatoes and vegetables.
- In the Western Counties, in a number of cases, the labourers in each farm volunteered to guard the farm against the gangs, during the night.
Chapter 14: Developments and Wages in the Other Occupations
- The occupations with the most workers according to the 1851 Census were: agricultural labourer, domestic servant, cotton spinning/ weaving/ printing, general labourer, farmer, boot and shoe maker, milliner/ dressmaker, carpenter/ joiner, army and navy, tailor, washerwoman, woollen cloth manufacture, silk manufacture, blacksmith, worsted manufacture, mason/ paver, messenger, linen and flax manufacture, seaman (merchant service), grocer, gardener, iron manufacturer / moulder / founder, innkeeper, seamstress / shirtmaker, bricklayer, butcher / meat salesman, hose (stocking) manufacturer, schoolmaster / -mistress, lace manufacture.
- For a number of these, it is impossible to make a calculation of the movements in income, as a large part of the earnings were in the form of “bed and food, found”.
- The persons who earned wages, that is weekly payments from employers for a given activity, in general could have a decent life. Those who had to sell the product of their work to middlemen and /or a highly competitive market, had a bad time.
- A number of new occupations sprung up during the second half of our period, with good incomes at a professional level, for example, mechanics and engineers, makers of steam engines, and of textile machinery, railway engine drivers, factory clerks and warehousemen.
Chapter 15: The Poor
- The very poor in the Industrial Revolution are “invisible”, that is, they do not appear in official statistics. We do not know the percentage of these people in the total of the population. Neither do we know if the percentage went up or down in our period, although it is probable that it increased from 1834.
- The extreme poverty in London only started in 1840-42, when a large number of starving and unemployed men and women arrived in the Metropolis. Their bad situation was caused by the catastrophic recession and unemployment of 1839-42.
- There was considerable poverty and hunger (but not starvation) among those agricultural labourers who did not have a steady job. Their situation had become worse with the New Poor Law of 1834, which prohibited the parishes from paying “outdoor relief”. In most families, the women and small children had to go to work in the fields.
- The figures of weekly incomes presented in other chapters are to a certain extent theoretical. They do not include the effect of recessions with high unemployment, which reduced the average lifetime income of the workers, and caused situations of hunger. There were recessions in 1810-12, 1816-17, 1819, 1826-27, 1830-31, 1839-42, and 1847-48.
- The worst recession was from 1839 to 1842. This was caused by a “bubble” of capital investment in the cotton industry in 1836-38, which then collapsed; from this point, the United States put up tariff barriers, three harvests failed consecutively, and there was contraction of the money supply by the Bank of England. Unemployment reached 30 % in some regions, and there was much reduction of working hours. Consumption of meat went down by a half. In Lancashire plus Cheshire there were about 4,000 deaths annually above the normal level.
- Many children outside of the textile industries, for example in: metalworking, pottery, glass, lace, paper-making, were badly treated, as they were not subject to official reglamentation or inspection. They had very low incomes (if at all!), had to work long hours, the working conditions were bad, insanitary, and in some cases, dangerous. In some cases, the continuous heavy work attacked their bodies, such that young persons of 18 years old had the stature of 14-year old children, and had not reached sexual maturity.
Chapter 16: Calculations of Movements in Nominal Wages, Cost of Living, and Real Wages
- The average of the weekly wages in the non-agricultural occupations, increased from 10.1 shillings in 1770 to 18.0 shillings in 1860 (+ 78 %).
- The average of the weekly wages in agricultural plus non-agricultural occupations, increased from 8.5 shillings in 1770 to 16.3 shillings in 1860 (+ 92 %).
- The average of yearly wages in agricultural plus non-agricultural occupations, discounting 10 % for lost working time, increased from 19.8 pounds in 1770 to 38.1 pounds in 1860 (+ 92 %); Feinstein’s figures were 18.0 pounds, 38.2 pounds, + 113 %).

- The wages per occupation for 1860 in this study are compared against very detailed figures from Leone Levi, Wages and Earnings of the Working Class, and are very close.
- The living costs for non-agricultural workers in 1860 are 150 (index 1770 = 100); the clothing costs are estimated at index = 40.
- Movements in cost of living indices are very close between agricultural and non-agricultural families, except that the agricultural family was positively affected by low cereal prices.
- Real wages for 1860 in terms of index 1770 = 100 were: agricultural = 121, non-agricultural = 124, total = 133 (the figure for “total” in not between the two component figures, because there was a large percent migration of workers from agricultural to non-agricultural occupations). The Allen number for real wages in 1860 is 145; the difference comes from the data for 1770.
| COMPARISON 1770 TO 1860 AGRICULTURAL PLUS NON-AGRICULTURAL WORKERS 1770 = 100 WAGES 197 EXPENSES 147 REAL WAGES 133 |
- The standard weekly wages given for agricultural and non-agricultural workers require adjustments in order to show the real incomes of the families. For the agricultural families, the changes are to include task-work, harvest month, and wives’ and children’s incomes, plus wives’ spinning up to 1820; the resulting figures are given in the chapters and conclusions about agricultural labourers. For the non-agricultural families, we have to not take 3 persons of a family at i.e. 10 shillings each, but one family of 3 persons at 30 shillings total, because this corresponds to the money to be used by the family.
- With the adjustment of the figures for cotton worker families, the nominal incomes for non-agricultural change in 1770 remain the same at 10 shillings, and change in 1860 from 18 shillings to 20 shillings; the index at 1860 changes from 178 to 195. The real wages at 1860 change from index 118 to index 130.
| COMPARISON 1770 TO 1860 NON-AGRICULTURAL WORKERS COTTON: TOTAL PER FAMILY 1770 = 100 WAGES 195 EXPENSES 150 REAL WAGES 130 |
With these adjustments, the average income for agricultural plus non-agricultural families at 1770 changes from 8.5 shillings to 11.5 shillings, and at 1860 changes from 16 shillings to 19 shillings. The index of nominal wages at 1860 changes from 197 to 168. The index of real wages at 1860 changes from 133 to 113.
| COMPARISON 1770 TO 1860 AGRICULTURAL PLUS NON-AGRICULTURAL WITH CORRECTIONS 1770 = 100 WAGES 168 EXPENSES 148 REAL WAGES 113 |
The average wages for the working class of the country, expressed in pounds, and discounting 10 % for lost working days, are now 27 pounds in 1770 and 45 pounds in 1860 (Feinstein: 18 pounds and 38 pounds). The difference against Feinstein is due to the inclusion of the extra payments to the agricultural families.

A calculation of average wages for non-industrial workers, in terms of the number of 4 lb. units of wheat which could be bought, gives the following graphic. 15 units of 4 lbs. gives one bushel, which was taken to be enough for a minimum decent level of expenses for a worker and his family. The families had just enough income in the years from 1770 to 1830 (with the exception of high grain prices from 1795 to 1815), and a considerable surplus from 1830 to 1860.

Chapter 17: Solutions
- There is an apparent contradiction between the small increase in real wages and the visible improvements in the daily life of the people.
- The logical error is that it is not necessarily true, that the increase in useful income per “mouth” of a family is proportional to the increase in weekly income of the principal wage- / income-earner. This concept is invalidated in the case of a rapidly evolving economy and society, as was the Industrial Revolution from 1770 to 1860.
- The main arithmetical change was that the “Job Density” per family increased, i.e. the number of persons in the family earning a decent wage was higher. In 1860, not just the father, but also the wife and one young person could earn 10 to 15 shillings a week. As a rough calculation, in 1770 the family had 1.65 employed persons with a total of1.27 times the father’s wage, and in 1860 the family had 2.1 employed persons with a total of 2.1 times the average wage in the country. These amounts were the resources for the 4.5 “mouths” of the family. We know from the 1851 Census, and from the notes of Mr. Levi, that each family had two people working, with a total of 31 shillings a week. This means that the useful income for industrial families did not increase in proportion to the average incomes, but additionally with the effect of more persons earning. The increase in real incomes from 1770 to 1860 was probably about 80 %.
- It is not the case that the working class had low living standards at the beginning of the Industrial Revolution, and thus with the apparent zero increase in wages up to 1830, they continued to have a bad standard of living. A large number of the working class in 1770-1795 lived comfortably, and even if they had had zero increase in wages, they would still have lived at a decent level.
- The assumption as seen in the “family budgets”, and in the classical calculation of the index of real wages, is that all the families had expenses that exactly used up all their income. But the fact is that a large number had a surplus. With the wages increasing faster than the cost of living index, this surplus necessarily increased up to 1860.
- The calculation of an average of real wages over the agricultural, mining, industrial, and domestic production activities is incomplete. It leaves out the new occupations such as engineers and railway workers, and also does not take into account the service sector, which increased its participation in the economy.
- Some improvements in the daily life of the people were not a charge on the pay-packet, but were paid for by the better classes or by the government. Particular cases are gas lighting in the streets, and subsidized railway travel.
- The workers in many cases lived in districts with very bad sanitary conditions, and the assumption is often that this is an evidence that they were poor. The logic is not correct. Many workers with medium incomes lived in these districts, but the fact was that even if they had had more wages, they could not have found better areas. The workers and poorer professional persons who lived in these circumstances, did not give up on their lives, but had many cultural, intellectual and political interests.
