With reference to the 376,000 common labourers, we do not have any detail as to their activities. The administrators of the Census of 1851 did not know. “… who undoubtedly include many agricultural labourers, many road labourers, many bricklayers’ labourers, many dock labourers; and also many who are ready to work in any of the ordinary mechanical employments.” (Registrar-General of Great Britain, 1854, Census of Great Britain 1851, Occupations of the People, p. 72). This title would probably include: building construction, road building, urban infrastructure, excavating canals, opening railway cuttings, and laying railway lines.
The major academic study is from Clark, “The Condition of the Working-Class inEngland, 1209-2003” (2004), which gives the development of daily wages for craftsmen and helpers in the building industry for the given period. It made use of 43,000 quotes of day wages, 85,000 price quotes of 44 commodities, and 20,000 quotes of house rents. The wage data come from all regions of England, and from payments by town governments, estate managers and charitable foundations.
Building Wages, the Cost of Living and Real Wages by Decade, 1209-2003
| Decade | Helpers day wage (pence) | Helpers day wage (1780-9 = 100) | Cost of Living (1780-9 = 100) | Helpers real wage (1780-9 = 100) |
| 1780-9 | 17.4 | 100.0 | 100.0 | 100.0 |
| 1790-9 | 20.0 | 114.9 | 116.3 | 98.7 |
| 1800-9 | 26.3 | 151.1 | 156.2 | 96.7 |
| 1810-9 | 32.4 | 186.2 | 174.8 | 106.5 |
| 1820-9 | 29.1 | 167.2 | 143.1 | 116.8 |
| 1830-9 | 29.8 | 171.2 | 129.7 | 132.0 |
| 1840-9 | 30.7 | 176.4 | 125.7 | 140.3 |
| 1850-9 | 31.4 | 180.4 | 119.3 | 151.2 |
| 1860-9 | 35.3 | 202.8 | 126.4 | 160.4 |
(extracted from: Clark, 2004, Table 4, p. 54-55; converted to 1780-9 index = 100 by this author)
The Clark figures as to craftsmen are commented in the section carpenters, joiners, bricklayers, stonemasons, while the data about helpers are used in this section, as they are unskilled workers.
We see that the nominal wages increase continuously from 1780-9 to 1810-9, and remain practically without movement to 1860-9. The real (corrected for inflation) wages remain stable from 1780-9 to 1810-9, and then improve by 50 % to 1860-9. This is arithmetically due to the increases in the price of food (especially corn) in the first period, and the decreases in the second period. It is not clear why there is such an improvement from 1810. These are workers with basic skills, and with not much individual bargaining power. Apparently the “trick” was to retain their nominal daily wage amounts from 1810, even while the cost of living was diminishing. If they did receive these increases, we would have to suppose that all the non-skilled working class also experienced this amount of movement, otherwise the building workers would “leapfrog” over them.
There is another investigation, by B. Eccleston, referring to building labourers and building craftsmen, estate workers, and road labourers in five Midland counties (Leicestershire, Nottinghamshire, Northamptonshire, Warwickshire, and Staffordshire) for 1750-1834, and with a large volume of documentation. The data for building labourers are commented in this section, and the data for building craftsmen in the section below on carpenters, joiners, bricklayers and stonemasons.
We have the following movements in daily wage rates for building workers, estate workers, and road labourers. The figures are in nominal pence per day.
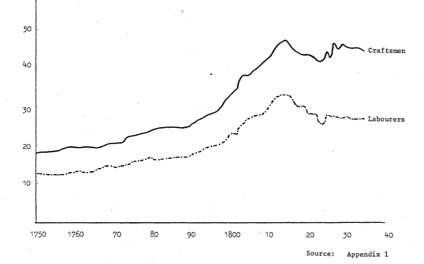
Fig. 9, Building Workers, mean wage rates
(Ecclestone, 1976, Fig. 9, p. 73)

Fig. 14, Estate Workers, mean wage rates
(Ecclestone, 1976, Fig. 14, p. 93)

Fig. 17, Road Labourers, mean wage rate
(Ecclestone, 1976, Fig. 17, p. 109)
From detailed figures in the appendices of the thesis, plus the data from Allen, we have:
Labourers (shillings per week)
| Building | Building | Estate | Road | |
| Helpers | labourers | Workers | labourers | |
| 1780 | 8.7 | 7.6 | 6.5 | 6.3 |
| 1785 | 9.3 | 8.0 | 6.8 | 6.4 |
| 1790 | 10.0 | 8.7 | 6.8 | 6.7 |
| 1795 | 11.6 | 9.5 | 8.1 | 7.7 |
| 1800 | 13.2 | 11.2 | 9.8 | 9.4 |
| 1805 | 14.7 | 13.5 | 9.8 | 10.5 |
| 1810 | 16.2 | 15.0 | 12.2 | 12.3 |
| 1815 | 15.3 | 15.8 | 12.9 | 12.2 |
| 1820 | 14.5 | 13.6 | 11.3 | 10.2 |
| 1825 | 14.7 | 13.6 | 11.4 | 9.9 |
| 1830 | 14.9 | 13.2 | 11.2 | 9.4 |
| 1835 | 15.1 | 13.1 | 10.9 | 8.9 |
| 1840 | 15.3 | |||
| 1845 | 15.5 | |||
| 1850 | 15.7 | |||
| 1855 | 16.4 | |||
| 1860 | 17.1 |
Labourers (loaves per week)
| Building | Building | Estate | Road | |
| Helpers | labourers | Workers | labourers | |
| 1780 | 14.4 | 12.6 | 10.8 | 10.4 |
| 1785 | 16.7 | 14.3 | 12.2 | 11.5 |
| 1790 | 16.7 | 14.5 | 11.3 | 11.2 |
| 1795 | 15.0 | 12.3 | 10.5 | 9.9 |
| 1800 | 12.5 | 10.6 | 9.3 | 8.9 |
| 1805 | 13.7 | 12.6 | 9.2 | 9.8 |
| 1810 | 12.3 | 11.4 | 9.3 | 9.3 |
| 1815 | 14.8 | 15.3 | 12.5 | 11.8 |
| 1820 | 17.5 | 16.4 | 13.6 | 12.3 |
| 1825 | 17.8 | 16.5 | 13.8 | 12.0 |
| 1830 | 19.0 | 16.9 | 14.3 | 12.0 |
| 1835 | 20.8 | |||
| 1840 | 20.6 | |||
| 1845 | 22.3 | |||
| 1850 | 25.8 | |||
| 1855 | 22.2 | |||
| 1860 | 25.7 |
Labourers (shillings per week)

Labourers (loaves per week)
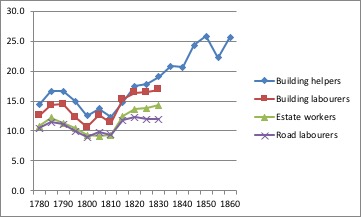
We note that the data from Clark and the data from Ecclestone show a close coincidence, which allows us to state that the real incomes of unskilled labourers increased in the period from 1815 to 1860.
Another class of hard manual work was that of the railway labourers, when the railways started to be introduced in the 1830’s and 1840’s: “For many years the country was covered by armies of “navigators” or “navvies”, whom contractors employed to translate the grandiose dreams of the railway projectors and the capital of their shareholders into solid cutting, embankment, tunnel, and permanent way. In 1848 nearly 200,000 labourers, many of them Irish, were engaged in this vast task. With their rough habits and speech, high wages – pay day was usually a brutal debauch – and their generous taste in steak, plush waistcoats and whisky (they called it “white beer”), they uprooted ancient ways of living in every place where they encamped.”
(Bryant, English Saga, 1942, p. 83)
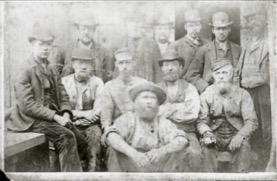
Group of Manchester workers 1848
James Cox, centre on the front row, surrounded by some of the men he worked with. The photograph was taken circa 1848. James Cox came to Manchester from Ireland in 1846 during the famine years. He first lived near Oxford Road Station, Mary Street, an area known as “Little Ireland”. He also worked on the Manchester Ship Canal in the later years of the 19th century. Mr. Cox, although he lived in the worst slum in Manchester, “Little Ireland”, does not appear to be poor or to have suffered hunger!
There does not seem to have been any negative effect from the Industrial Revolution on the wages on this segment of the working class, rather, they had a good life. What we can note, is that the invention of the steam engine, its use for long distance transport, the production in large volume and at low costs of the railway stock and the rails, and the increase in the purchasing power of a large segment of the public, made it possible for 200,000 men to have a well-paid job.
