The general idea, that the infant (0-12 months) and child (13-60 months) death rates in England in the Industrial Revolution were much higher than in the preceding decades, is not true. The infant and child death rates were very high in England during the eighteenth century, around 170 / 1000 for infants and around 170 / 1000 for children, in the whole country. This compares with 150 / 1000 and 130 / 1000 for England in 1841. Manchester had 210 and 200 in 1841, Liverpool 220 and 220, and the rest of Lancashire somewhat less.
The death rates for under-fives in London decreased considerably during the eighteenth century:
“BIRTHS and DEATHS under 5 Years of Age, according to the “London Bills of Mortality”, for 100 years, in 5 Periods of 20 Years each; and the NUMBERS DYING under 5 Years out of 100 born:”
| 1730-49 | 1750-69 | 1770-89 | 1790-1809 | 1810-29 | |
| Total Births | 315,000 | 307,000 | 349,000 | 386,000 | 477,000 |
| Total Deaths under 5 Years | 235,000 | 198,000 | 180,000 | 159,000 | 151,000 |
| Dying per Cent. under 5 Years | 74.5 | 68.0 | 51.5 | 41.3 | 31.8 |
(T. R. Edmonds, On the Mortality of Infants in England, Lancet, Vol. I, 1835-36, London, p. 689; taken from the Mortality Bills of London)
We have some data from Dr. Roberton [sic] in his “Observations on the Mortality and Physical Management of Infants” (1827). He tells us that in the town of Manchester in 1773, the population was 27,000, and one out of 30 – children and adults – died annually (numbers from a Dr. Percival, who was active there at that time); 12 years earlier, the figure was one in 21, and one half of the children died under 5 years of age.
He gives some tables of mortality of children, showing the deaths per age group as a percentage total of deaths in the year (Roberton, 1827, pp. 11-29).The following lines are selected, taking only the oldest data for each locality.
LONDON
| Town | Years Bills of Mortality | Average deaths p. a. | Under the age of 1 | Between 1 and 2 | Between 2 and 5 | Between 5 and 10 | Total under 10 |
| London | 1786- 1793 | 19,600 | 22.00 | 10.68 | 9.99 | 3.91 | 46.58 |
| Simple Average | 22.00 | 10.68 | 9.99 | 3.91 | 46.58 |
LARGE TOWNS
| Town | Years Bills of Mortality | Average deaths p. a. | Under the age of 1 | Between 1 and 2 | Between 2 and 5 | Between 5 and 10 | Total under 10 |
| Liverpool | 1812-1815 | 2,500 | 20.00 | 11.28 | 10.91 | 5.59 | 47.81 |
| Glasgow | 1783-1789 | 1,600 | 26.00 | 13.40 | 10.66 | 3.42 | 53.48 |
| Manchester | 1816-1823 | 1,100 | 26.59 | 13.81 | 14.78 | 4.47 | 59.65 |
| Simple Average | 24.20 | 12.83 | 12.12 | 4.49 | 53.64 |
SMALLER TOWNS
| Town | Years Bills of Mortality | Average Deaths p. a. | Under the age of 1 | Between 1 and 2 | Between 2 and 5 | Between 5 and 10 | Total under 10 |
| Chester | 1772-1781 | 400 | 19.70 | 8.82 | 11.85 | 4.05 | 44.42 |
| Carlisle | 1779-1787 | 200 | 21.19 | 9.40 | 13.51 | 4.83 | 48.93 |
| Warrington | 1773-1781 | 300 | 24.09 | 14.41 | 12.83 | 3.79 | 55.12 |
| Northampton | 1735-1780 | 100 | 22.00 | 10.60 | 7.80 | 4.28 | 44.68 |
| Simple Average | 21.74 | 10.81 | 11.50 | 4.24 | 48.29 |
VILLAGE PARISHES
| Town | Years Bills of Mortality | Average deaths p. a. | Under the age of 1 | Between 1 and 2 | Between 2 and 5 | Between 5 and 10 | Total under 10 |
| Spalding | 1798-1811 | 100 | 35.64 | 4.30 | 4.45 | 3.75 | 48.14 |
| Lymm | 1817-1825 | 40 | 24.92 | 6.60 | 4.80 | 3.90 | 40.22 |
| Eccles | 1818-1825 | 500 | 24.00 | 11.46 | 10.92 | 2.96 | 49.34 |
| Simple Average | 28.19 | 7.45 | 6.72 | 3.54 | 45.90 |
AGRICULTURAL PARISHES
| Town | Years Bills of Mortality | Average Deaths p. a. | Under the age of 1 | Between 1 and 2 | Between 2 and 5 | Between 5 and 10 | Total under 10 |
| Winwick | 1812-1821 | 150 | 16.88 | 7.06 | 6.12 | 4.66 | 34.72 |
| Grappenhall | 1815-1825 | 40 | 20.38 | 5.05 | 7.30 | 2.26 | 34.99 |
| Great Shefford | 1747-1757 | 10 | 20.00 | 10.12 | 4.82 | 3.61 | 38.55 |
| Ackworth | 1757-1767 | 10 | 13.30 | 6.64 | 10.25 | 3.20 | 33.39 |
| Holy Cross | 1750-1759 | 30 | 15.17 | 5.17 | 9.65 | 7.93 | 37.92 |
| Simple Average | 17.14 | 6.81 | 7.63 | 4.33 | 35.91 |
We can convert this approximately to child deaths as a fraction of births per year, dividing by 1.3 for the factor of total births per year to total deaths in the year. If we express this as numbers per thousand, we then have figures with roughly the same definition as in sources with respect to the nineteenth century.
LONDON
| Town | Years Bills Of Mortality | Average deaths p. a. | Under the age of 1 | Between 1 and 2 | Between 2 and 5 | Between 5 and 10 | Total under 10 |
| London | 1786- 1793 | 19,600 | 169 | 82 | 77 | 30 | 358 |
| Simple Average | 169 | 82 | 77 | 30 | 358 |
LARGE TOWNS
| Town | Years Bills of Mortality | Average deaths p. a. | Under the age of 1 | Between 1 and 2 | Between 2 and 5 | Between 5 and 10 | Total under 10 |
| Liverpool | 1812-1815 | 2,500 | 154 | 87 | 84 | 43 | 368 |
| Glasgow | 1783-1789 | 1,600 | 200 | 103 | 82 | 26 | 411 |
| Manchester | 1816-1823 | 1,100 | 204 | 106 | 114 | 34 | 458 |
| Simple Average | 186 | 99 | 93 | 34 | 412 |
SMALLER TOWNS
| Town | Years Bills of Mortality | Average deaths p. a. | Under the age of 1 | Between 1 and 2 | Between 2 and 5 | Between 5 and 10 | Total under 10 |
| Chester | 1772-1781 | 400 | 151 | 68 | 91 | 31 | 341 |
| Carlisle | 1779-1787 | 200 | 163 | 72 | 104 | 37 | 376 |
| Warrington | 1773-1781 | 300 | 185 | 111 | 99 | 29 | 424 |
| Northampton | 1735-1780 | 100 | 169 | 82 | 60 | 33 | 344 |
| Simple Average | 167 | 83 | 88 | 32 | 371 |
VILLAGE PARISHES
| Town | Years Bills of Mortality | Average deaths p. a. | Under the age of 1 | Between 1 and 2 | Between 2 and 5 | Between 5 and 10 | Total under 10 |
| Spalding | 1798-1811 | 100 | 274 | 33 | 34 | 29 | 370 |
| Lymm | 1817-1825 | 40 | 192 | 51 | 37 | 30 | 309 |
| Eccles | 1818-1825 | 500 | 184 | 88 | 84 | 23 | 380 |
| Simple Average | 216 | 57 | 52 | 27 | 352 |
AGRICULTURAL PARISHES
| Town | Years Bills of Mortality | Average deaths p. a. | Under the age of 1 | Between 1 and 2 | Between 2 and 5 | Between 5 and 10 | Total under 10 |
| Winwick | 1812-1821 | 150 | 130 | 53 | 47 | 36 | 266 |
| Grappenhall | 1815-1825 | 40 | 156 | 39 | 56 | 17 | 268 |
| Great Shefford | 1747-1757 | 10 | 154 | 78 | 37 | 28 | 297 |
| Ackworth | 1757-1767 | 10 | 102 | 51 | 78 | 25 | 256 |
| Holy Cross | 1750-1759 | 30 | 117 | 40 | 74 | 61 | 292 |
| Simple Average | 132 | 52 | 58 | 33 | 275 |
RESUMED DATA
| Town type | Under the age of 1 | Between 1 and 2 | Between 2 and 5 | Between 5 and 10 | Total under 10 | |
| London | 169 | 82 | 77 | 30 | 358 | |
| Large towns | 186 | 99 | 93 | 34 | 412 | |
| Smaller towns | 167 | 83 | 88 | 32 | 371 | |
| Village parishes | 216 | 57 | 52 | 27 | 352 | |
| Agricultural Parishes | 132 | 52 | 58 | 33 | 275 |
To check if the death rate was particularly differentiated between manufacturing and agricultural areas, or possibly between large towns and small towns/villages, we can extract the data as to Population and as to Bills of Mortality, in the sections of Sir Frederick Eden’s “State of the Poor” (the following table includes all the towns and villages for which there was sufficient information).
| County | Town | Population | Yearly Births | Yearly Burials | Per Cent | Per Cent |
| Most recent | Average 1790-94 | Average 1790-94 | ||||
| Bedfordshire | Dunstable | 1,000 | 32 | 12 | 3.2 | 1.2 |
| Buckingham | Buckingham | 2,000 | 76 | 39 | 3.8 | 1.9 |
| Buckingham | Winslow | 1,100 | 38 | 24 | 3.5 | 2.2 |
| Cumberland | Cumwhitton | 450 | 12 | 7 | 2.7 | 1.6 |
| Cumberland | Harrington | 1,400 | 37 | 26 | 2.6 | 1.9 |
| Cumberland | Kirkoswald | 950 | 18 | 17 | 1.9 | 1.8 |
| Derbyshire | Chesterfield | 4,000 | 156 | 113 | 3.9 | 2.8 |
| Derbyshire | Derby | 8,000 | 182 | 154 | 2.3 | 1.9 |
| Devon | Clyst. St. George | 230 | 9 | 5 | 3.9 | 2.2 |
| Devon | South Tawton | 2,500 | 51 | 29 | 2.0 | 1.2 |
| Devon | Tiverton | 7,100 | 203 | 160 | 2.9 | 2.2 |
| Dorset | Blandford | 2,100 | 69 | 52 | 3.3 | 2.5 |
| Durham | South Shields | 15,000 | 351 | 347 | 2.3 | 2.3 |
| Durham | Tanfield | 2,000 | 73 | 69 | 3.6 | 3.4 |
| Hampshire | Petersfield | 1,000 | 45 | 29 | 4.5 | 2.9 |
| Kent | Ashford | 2,000 | 44 | 34 | 2.2 | 1.7 |
| Kent | Cobham | 560 | 15 | 14 | 2.6 | 2.5 |
| Kent | Meopham | 600 | 23 | 15 | 3.8 | 2.5 |
| Lancashire | Bury | 17,000 | 485 | 276 | 2.9 | 1.6 |
| Lancashire | Lancaster | 8,000 | 296 | 137 | 3.7 | 1.7 |
| Lancashire | Liverpool | 56,000 | 2,473 | 1,960 | 4.4 | 3.5 |
| Lancashire | Manchester w/o Salford | 50,000 | 2,599 | 1,712 | 5.2 | 3.4 |
| Lancashire | Preston | 7,000 | 171 | 233 | 2.4 | 3.3 |
| Lancashire | Warrington | 8,800 | 455 | 337 | 5.1 | 3.8 |
| Leicester | Leicester | 2,800 | 72 | 72 | 2.6 | 2.6 |
| Lincolnshire | Louth | 4,000 | 126 | 89 | 3.2 | 2.2 |
| Lincolnshire | Spilsby | 850 | 26 | 15 | 3.1 | 1.8 |
| Lincolnshire | Swineshead | 1550 | 65 | 47 | 4.2 | 3.0 |
| Lincolnshire | Willoughby | 400 | 9 | 8 | 2.2 | 2.0 |
| Monmouthshire | Abergavenny | 2,500 | 60 | 56 | 2.4 | 2.2 |
| Northamptonshire | Brixworth | 800 | 24 | 19 | 3.0 | 2.4 |
| Northumberland | North Shields | 10,000 | 350 | 350 | 3.5 | 3.5 |
| Nottinghamshire | Newark | 7,000 | 226 | 150 | 3.2 | 2.1 |
| Nottinghamshire | Nottingham | 22,000 | 806 | 517 | 3.7 | 2.3 |
| Shropshire | Bishop’s Castle | 1,350 | 38 | 25 | 2.8 | 1.9 |
| Somersetshire | Minehead | 1,200 | 36 | 24 | 3.0 | 2.0 |
| Surrey | Farnham | 3,000 | 141 | 87 | 4.7 | 2.9 |
| Surrey | Reigate | 2,000 | 72 | 50 | 3.6 | 2.5 |
| Sussex | Winchelsea | 550 | 22 | 10 | 4.0 | 1.8 |
| Warwick | Southam | 750 | 28 | 21 | 3.7 | 2.8 |
| Westmoreland | Kendal | 8,000 | 205 | 250 | 2.5 | 3.1 |
| Westmoreland | Orton | 1,500 | 33 | 18 | 2.4 | 1.6 |
| Wiltshire | Trowbridge | 7,000 | 134 | 148 | 1.9 | 2.1 |
| Yorkshire | Great Driffield | 1,600 | 40 | 29 | 2.5 | 1.8 |
| Yorkshire | Kingston-upon-Hull | 22,000 | 752 | 662 | 3.4 | 3.0 |
| Yorkshire | Leeds | 31,500 | 1,116 | 967 | 3.5 | 3.1 |
| Yorkshire | Market-Weighton | 1,200 | 37 | 24 | 3.1 | 2.0 |
| Yorkshire | Sheffield | 35,000 | 1,626 | 1,314 | 4.6 | 3.7 |
| Yorkshire | Skipton | 2,100 | 63 | 51 | 3.0 | 2.4 |
| Yorkshire | Stokesly | 1,600 | 53 | 44 | 3.3 | 2.8 |
It is very clear that the large, industrializing, towns had high figures of death rates; Liverpool, Manchester, Preston, Warrington, North Shields, Kingston-upon-Hull, Leeds, and Sheffield, are all above 3.0 %. What is not clear is if the reason is: size of town (overcrowding and bad sanitation), industrial processes, or increased formal employment of women (less time to look after their little children). The question arises because the large towns were not yet industrialized; not even in Manchester were there any mills before 1792.
Herewith we show a specimen of a Bill of Mortality (Liverpool, 1795-96), from Sir Frederick Eden, “State of the Poor”.
q

b

The excessive number of deaths (more than the births) will have been due to the shortage of cereals in this year.
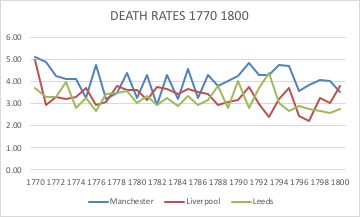
To see what was happening in Manchester, Liverpool, and Leeds, with reference to the living conditions of the people from 1770 to 1800, we can calculate the birth rates and death rates from the Bills of Mortality in the “State of the Poor”; the numbers of inhabitants are interpolations from a few real enumerations.
Manchester, Township
| Persons | Births | Burials | Birth Rate % | Death Rate % | |
| 1770 | 19,400 | 1,050 | 988 | 5.41 | 5.09 |
| 1771 | 20,400 | 1,169 | 993 | 5.73 | 4.87 |
| 1772 | 21,400 | 1,127 | 904 | 5.27 | 4.22 |
| 1773 | 22,400 | 1,168 | 923 | 5.21 | 4.12 |
| 1774 | 23,400 | 1,245 | 958 | 5.32 | 4.09 |
| 1775 | 24,400 | 1,359 | 835 | 5.57 | 3.26 |
| 1776 | 25,600 | 1,241 | 1,220 | 4.85 | 4.76 |
| 1777 | 26,800 | 1,513 | 864 | 5.64 | 3.22 |
| 1778 | 28,000 | 1,449 | 975 | 5.17 | 3.48 |
| 1779 | 29,300 | 1,464 | 1,288 | 5.00 | 4.39 |
| 1780 | 30,600 | 1,566 | 993 | 5.12 | 3.24 |
| 1781 | 32,000 | 1,591 | 1,370 | 4.97 | 4.28 |
| 1782 | 33,400 | 1,678 | 984 | 5.02 | 2.94 |
| 1783 | 35,000 | 1,615 | 1,496 | 4.61 | 4.27 |
| 1784 | 36,600 | 1,958 | 1,175 | 5.35 | 3.21 |
| 1785 | 38,000 | 1,942 | 1,734 | 5.11 | 4.56 |
| 1786 | 39,400 | 2,319 | 1,282 | 5.88 | 3.25 |
| 1787 | 41,200 | 2,256 | 1,761 | 5.47 | 4.27 |
| 1788 | 43,000 | 2,391 | 1,637 | 5.56 | 3.81 |
| 1789 | 44,500 | 2,487 | 1,788 | 5.59 | 4.02 |
| 1790 | 46,000 | 2,576 | 1,940 | 5.60 | 4.22 |
| 1791 | 47,500 | 2,960 | 2,286 | 6.23 | 4.81 |
| 1792 | 49,700 | 2,660 | 2,122 | 5.35 | 4.27 |
| 1793 | 51,900 | 2,579 | 2,223 | 4.97 | 4.28 |
| 1794 | 54,000 | 2,345 | 2,572 | 4.34 | 4.76 |
| 1795 | 56,500 | 2,296 | 2,661 | 4.06 | 4.70 |
| 1796 | 58,500 | 2,532 | 2,095 | 4.32 | 3.58 |
| 1797 | 60,500 | 2,767 | 2,322 | 4.57 | 3.83 |
| 1798 | 62,500 | 2,789 | 2,553 | 4.46 | 4.08 |
| 1799 | 65,000 | 2,828 | 2,625 | 4.35 | 4.03 |
| 1800 | 67,500 | 2,590 | 2,367 | 3.83 | 3.50 |
| 1801 | 70,000 |
(1770-1793, Eden, State of the Poor, Vol. II, p. 355); (1794-1800, Census 1801, Parish Register Abstract)
Dr. Percival, who carried out an informal “enumeration” of Manchester in 1773, gives us his comments, as to why the death rate was decreasing:
“It is pleasing to observe, that, notwithstanding the enlargement of Manchester, there has been a sensible improvement, in the healthiness and longevity of its inhabitants; for the proportion of deaths is now considerably less, than in 1757. But this is chiefly to be ascribed, as Dr. Price has justly observed, to the large accretion of new settlers from the country. For as these usually come in the prime of life, they must raise the proportion of inhabitants to the deaths, and also to births and weddings to the burials, higher than they would otherwise be. However, exclusive of this consideration, there is good reason to believe, that Manchester is now more healthy than formerly. The new streets are wide and spacious, the poor have larger and more commodious dwellings, and the increase of trade affords them better cloathing and diet, than they before enjoyed. I may add too, that the late improvements in medicine have been highly favourable to the preservation of life. The cool regimen in fevers, and in the small pox, the free admission of air, attention to cleanliness, and the general use of antiseptic remedies and diet, have certainly mitigated the violence, and lessened the mortality of some of the most dangerous and malignant distempers, to which mankind are incident.” (pp. 5-6)
(Percival, Observations on the State of Population in Manchester, and other adjacent Places, 1773)
By 1790 there were only 8 cotton mills in Manchester, none with steam power, and by 1800 there 29 cotton mills, 6 steam powered. All of these were outside the continuous built-up area (Nevell, 2003, Chapter 3, table 3.1 and map 3.14)
Liverpool, parish only
| Year | Persons | Births | Burials | Birth Rate % | Death Rate % |
| 1770 | 31,400 | 1,347 | 1,562 | 4.29 | 4.97 |
| 1771 | 32,400 | 1,470 | 951 | 4.53 | 2.93 |
| 1772 | 33,400 | 1,375 | 1,103 | 4.11 | 3.30 |
| 1773 | 34,400 | 1,397 | 1,109 | 4.06 | 3.22 |
| 1774 | 35,500 | 1,451 | 1,166 | 4.09 | 3.28 |
| 1775 | 36,600 | 1,498 | 1,352 | 4.09 | 3.69 |
| 1776 | 37,700 | 1,541 | 1,113 | 4.09 | 2.94 |
| 1777 | 38,900 | 1,538 | 1,186 | 3.95 | 3.05 |
| 1778 | 40,100 | 1,616 | 1,511 | 4.03 | 3.77 |
| 1779 | 41,400 | 1,648 | 1,489 | 3.98 | 3.60 |
| 1780 | 42,700 | 1,709 | 1,544 | 4.00 | 3.61 |
| 1781 | 44,000 | 1,760 | 1,383 | 4.00 | 3.14 |
| 1782 | 45,200 | 1,766 | 1,687 | 3.91 | 3.73 |
| 1783 | 46,400 | 1,872 | 1,696 | 4.03 | 3.65 |
| 1784 | 47,600 | 2,068 | 1,635 | 4.34 | 3.42 |
| 1785 | 48,800 | 2,007 | 1,778 | 4.11 | 3.64 |
| 1786 | 50,200 | 2,143 | 1,772 | 4.27 | 3.53 |
| 1787 | 51,600 | 2,267 | 1,773 | 4.39 | 3.43 |
| 1788 | 53,000 | 2,332 | 1,564 | 4.40 | 2.95 |
| 1789 | 54,500 | 2,366 | 1,662 | 4.34 | 3.05 |
| 1790 | 56,000 | 2,244 | 1,763 | 4.00 | 3.15 |
| 1791 | 57,600 | 2,491 | 2,166 | 4.32 | 3.76 |
| 1792 | 59,200 | 2,606 | 1,767 | 4.40 | 2.98 |
| 1793 | 61,000 | 2,500 | 1,464 | 4.09 | 2.40 |
| 1794 | 62,800 | 2,527 | 2,009 | 4.02 | 3.20 |
| 1795 | 64,600 | 2,252 | 2,394 | 3.48 | 3.70 |
| 1796 | 66,000 | 2,122 | 1,609 | 3.21 | 2.43 |
| 1797 | 67,800 | 2,382 | 1,496 | 3.51 | 2.20 |
| 1798 | 69,600 | 2,464 | 2,250 | 3.54 | 3.23 |
| 1799 | 71,400 | 2,664 | 2,152 | 3.82 | 3.01 |
| 1800 | 73,200 | 2,903 | 2,782 | 3.80 | 3.80 |
| 1801 | 75,000 |
(1770-1795, Eden, State of the Poor, Vol. II, p. 337); (1796-1800, Census 1801, Parish Register Abstract)
Leeds, township only
| Year | Persons | Births | Burials | Birth Rate % | Death Rate % |
| 1770 | 15,400 | 552 | 570 | 3.58 | 3.70 |
| 1771 | 15,700 | 610 | 518 | 3.88 | 3.30 |
| 1772 | 16,000 | 586 | 528 | 3.66 | 3.30 |
| 1773 | 16,300 | 614 | 647 | 3.77 | 3.97 |
| 1774 | 16,700 | 543 | 466 | 3.25 | 2.79 |
| 1775 | 17,100 | 625 | 558 | 3.65 | 3.26 |
| 1776 | 17,500 | 637 | 465 | 3.64 | 2.65 |
| 1777 | 17,900 | 635 | 618 | 3.54 | 3.45 |
| 1778 | 18,300 | 709 | 635 | 3.87 | 3.47 |
| 1779 | 18,700 | 613 | 667 | 3.27 | 3.57 |
| 1780 | 19,100 | 673 | 576 | 3.52 | 3.01 |
| 1781 | 19,500 | 654 | 653 | 3.35 | 3.34 |
| 1782 | 19,900 | 656 | 581 | 3.29 | 2.92 |
| 1783 | 20,300 | 639 | 665 | 3.15 | 3.27 |
| 1784 | 20,700 | 740 | 596 | 3.57 | 2.88 |
| 1785 | 21,200 | 763 | 707 | 3.60 | 3.33 |
| 1786 | 21,700 | 815 | 636 | 3.75 | 2.93 |
| 1787 | 22,200 | 773 | 702 | 3.48 | 3.16 |
| 1788 | 22,700 | 813 | 864 | 3.58 | 3.81 |
| 1789 | 23,200 | 873 | 650 | 3.76 | 2.80 |
| 1790 | 23,700 | 999 | 953 | 4.21 | 4.02 |
| 1791 | 24,200 | 1,003 | 677 | 4.14 | 2.79 |
| 1792 | 24,700 | 1,025 | 916 | 4.15 | 3.70 |
| 1793 | 25,200 | 1,061 | 1,107 | 4.21 | 4.39 |
| 1801 | 30,700 |
(1770-1793, Eden, State of the Poor, Vol. III, p. 862)
Leeds, Town and out-townships
| Year | Persons | Births | Burials | Birth Rate % | Death Rate % |
| 1794 | 46,000 | 1,545 | 1,394 | 3.35 | 3.03 |
| 1795 | 47,000 | 1,567 | 1,253 | 3.33 | 2.66 |
| 1796 | 48,000 | 1,529 | 1,392 | 3.18 | 2.90 |
| 1797 | 49,000 | 1,662 | 1,348 | 3.39 | 2.75 |
| 1798 | 50,000 | 1,766 | 1,332 | 3.53 | 2.66 |
| 1799 | 51,000 | 1,748 | 1,321 | 3.42 | 2.59 |
| 1800 | 52,000 | 1,742 | 1,428 | 3.35 | 2.75 |
| 1801 | 53,200 |
(1794-1800, Census 1801, Parish Register Abstract)

Deaths in Childhood: Chester 1772-1774 and Carlisle 1779-1789
| Chester | Carlisle | ||||
| Under 1 Year | 1 to 5 Years | Under 5 Years | |||
| Small pox | 55 | 140 | 225 | ||
| Consumption | 4 | 12 | 34 | ||
| Convulsions | 139 | 55 | 10 | ||
| Whooping cough | 15 | 16 | 18 | ||
| Weakness of infancy | 20 | 27 | 204 | ||
| Measles | 28 | ||||
| Scarlet fever | 31 | ||||
| Thrush | 1 | 63 | |||
| Infantile remittent fever | 19 | ||||
| Other and unknown | 21 | 28 | 74 | ||
| Total | 254 | 278 | 706 |
(“Convulsions” were generally caused by extreme diarrhea or by fevers)
(Roberton, 1827, pp. 84-85)
The people who were born in the late 18th century, and supposing that they survived childhood, could expect to live to a good age. Comparing data from births in 1770, etc., and persons living in 1841 according to the Census, we can show that 23 per cent of persons from 1770 were still alive in 1841, that is, they reached an age of 70.
| Year | Baptisms | Year | Age 1841 | Number Living | Per cent Surviving | ||
| 1770 | 207,000 | 1841 | 70 | 48,000 | 23.6 | ||
| 1780 | 222,000 | 1841 | 60 | 83,000 | 37.4 | ||
| 1790 | 249,000 | 1841 | 50 | 127,000 | 51.0 |
(Births extracted from: Marshall, 1832, p. 61)
(Number Living extracted from: Accounts and Papers of the House of Commons, p. 286: Statement of the Ages of Persons living in England and Wales, as ascertained by the Census of 1841)
The doctors and intellectuals of the late eighteenth century did not have enough long-term data to calculate an expectation of life. What they used was the “value of life” or “average of mortality”, which was the total population of the town in the year, divided by the number of deaths registered in the year (child and adult). This gave a good approximation to the average expected age at death, so long there was not a large growth in the population. The parameter was easy to calculate, and could be used for comparisons between cities or between countries; the increase in this number through the years, would show the improvement in health conditions.
In the course of collecting the infant and child death rates for a number of towns, Dr. Roberton was also able to find some data as to the “value of life” in each case, and its progression through the years.
For Glasgow, Dr Roberton (following Dr. Watt, official of the town) gives us numbers of 26.7 for 1780-1785, 27.9 for 1786-1791, 35.2 for 1792-1801, and 40.8 for 1802-1811. For Liverpool we have 39.3 for 1811-1821. For Manchester, there are some individual data of 21 in 1761 and 30 in 1773. In Warrington, the registers give 26.5 for 1773-1781, and 37 for 1811-1821. For Chester in 1774, the figure was 31.0; for Carlisle in 1779-1787 it was 40. As to the smaller units, Holy Cross (1750-1780) was 33.1, Ackworth (1747-1767) was 55.3, Great Shefford (1747-1757) was 51.2, Spalding (1798-1811) was 31.3, Eccles (1818-1825) was 48.3, Lymm (1821) was 56.5,
The figures from the Bills of Mortality (yearly or monthly official reports of births and deaths) in London remained fairly constant through the eighteenth century, from 34.0 in 1701-10 to 37.2 in 1791-1800. The “value of life” in the nineteenth century improved from 40 in 1841-1850 to 52 in 1891-1900.
Lifespans were fairly long, once the child had passed the 5-year hurdle. According to later analysis, a child of 10 years old in 1770 had an average expected age at death of 47, and a man or woman of 30 would expect on average to live to 54.
(Brownlee, John; The Health of London in the Eighteenth Century, 1925; whole document)
For the whole of England and Wales, the “annual mortality” was 40 in 1780, 45 in 1790, 47 in 1801, 50 in 1811, and 58 in 1821 (Hawkins, 1829, p. 16).
